

Digital Asset Allocation made easy
CF Benchmarks helps pensions, sovereign wealth funds, insurance companies and other institutional investors navigate the digital asset class and make more informed investment decisions through comprehensive frameworks, tools and price benchmarks to construct, manage and assess their portfolios
Navigate the Blockchain Economy and Understand Exposures of Digital Assets
The Digital Asset universe is constituted of a diverse range of Assets with differing characteristics, use cases and applications. The lack of a coherent classification system by which to segment this universe, understand its constitution and map exposures of digital assets to real world use cases and differing economic activities severely limited any quantitative analysis of the asset class. The CF Digital Asset Classification Structure (CF DACS) gives investors a simple, comprehensive and evergreen framework by which to attribute performance to real world activities and adoption.
Benchmark Digital Asset Pricing
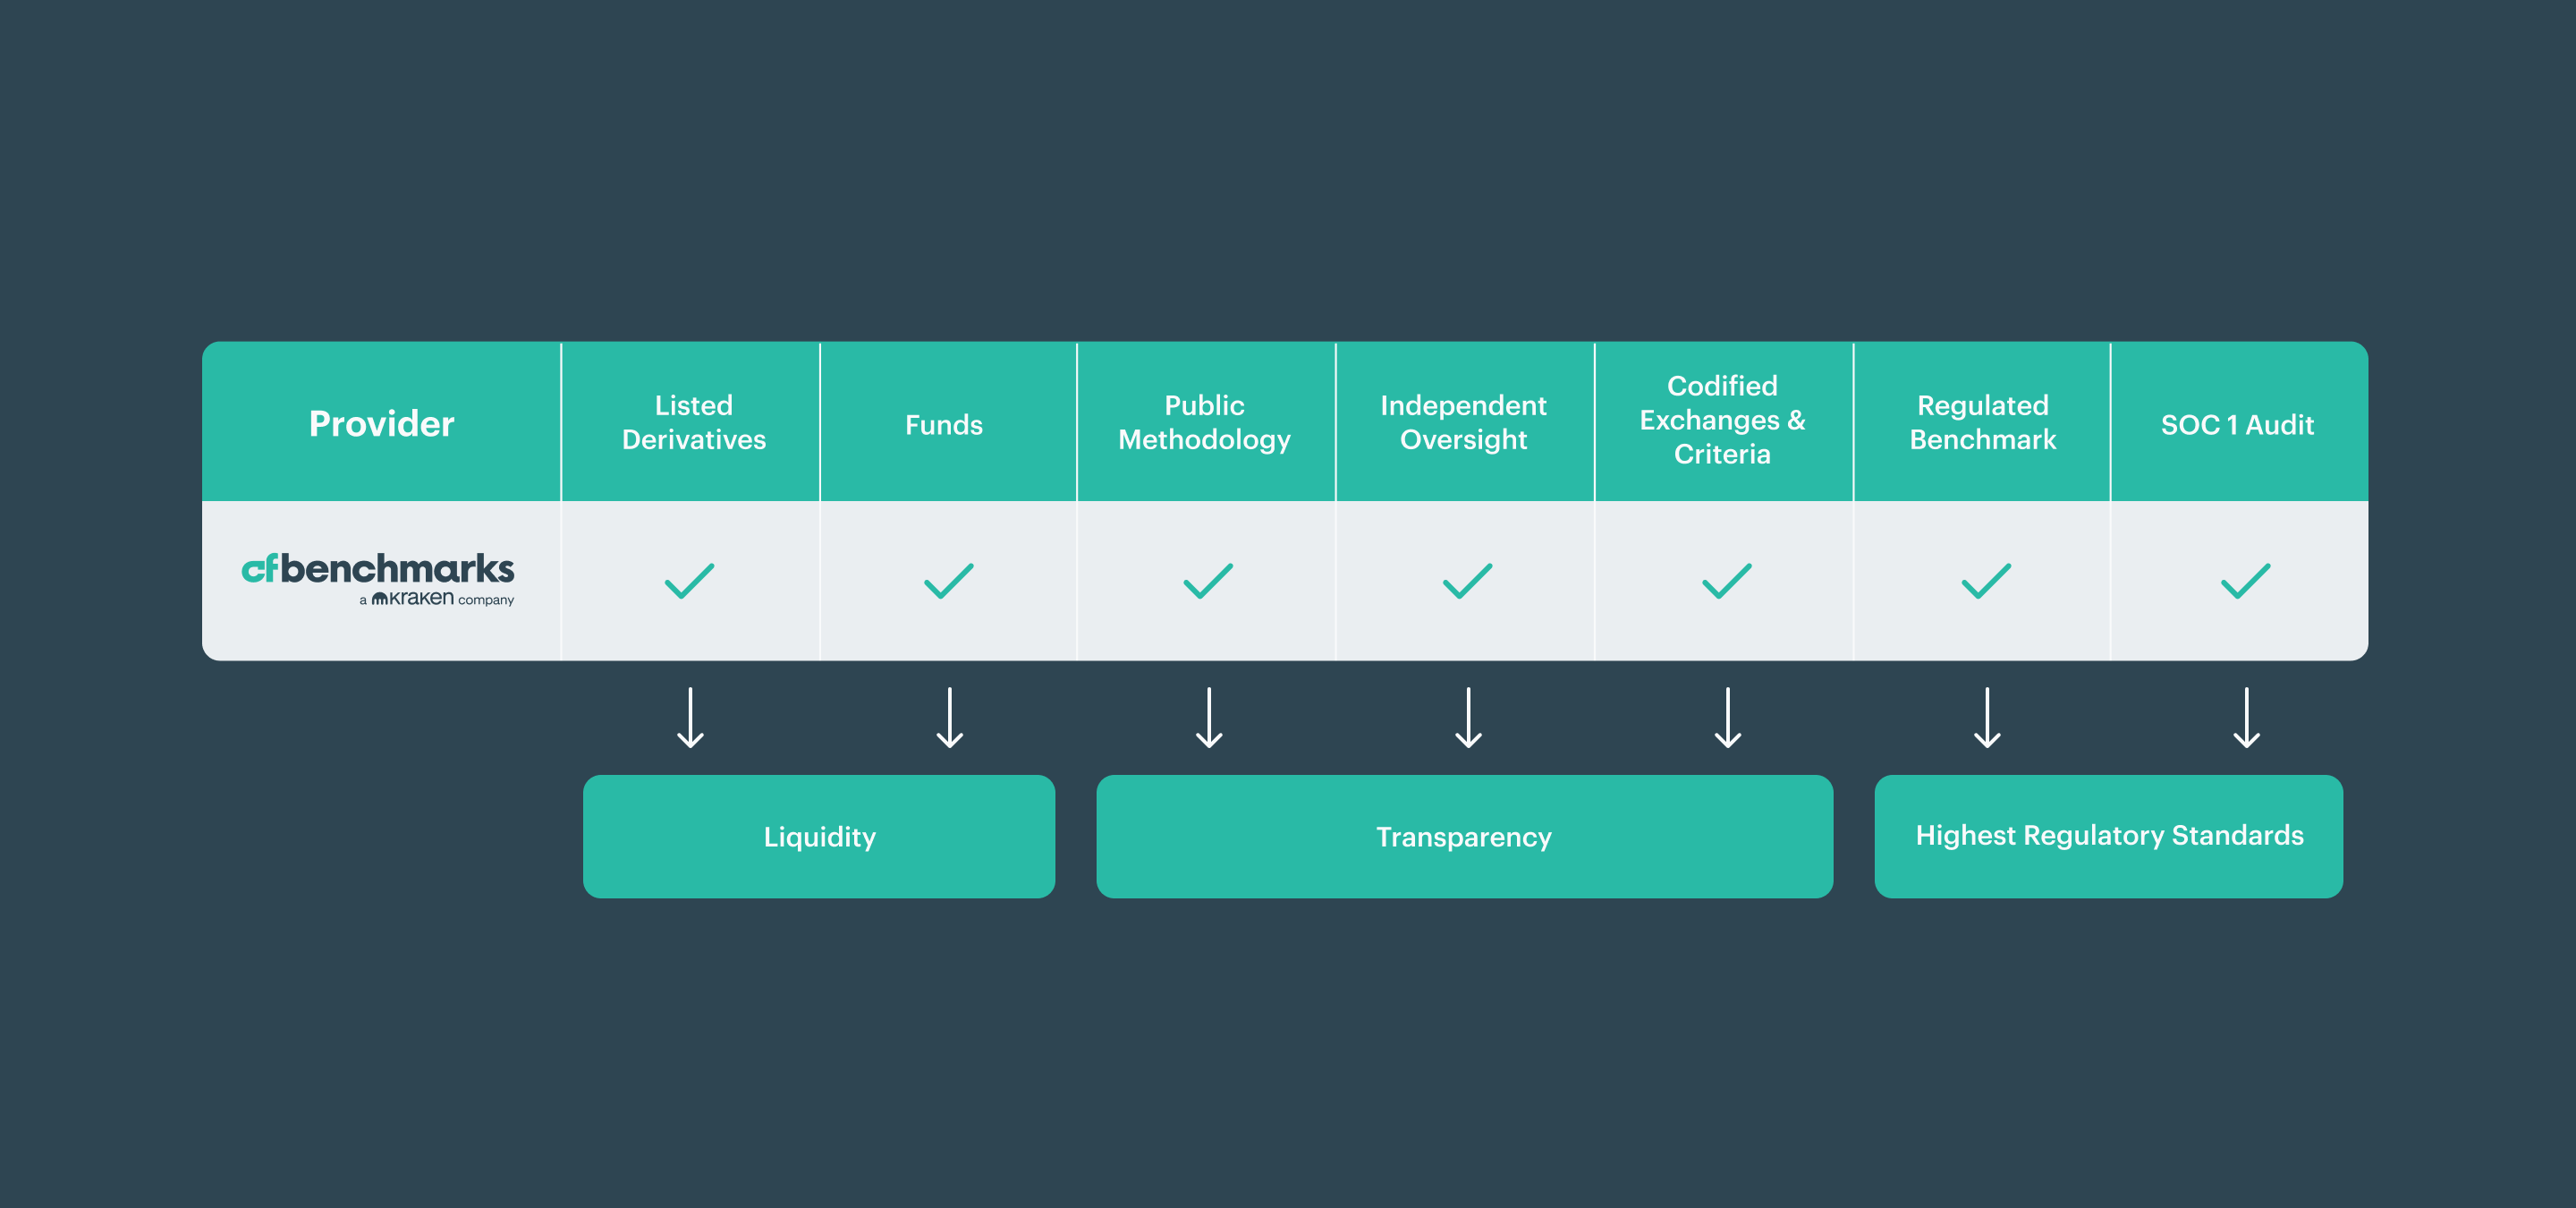
Regulated price benchmarks for all liquid digital assets where underlying transaction data is sourced from multiple reputable crypto exchanges that conform to strict criteria that cover market surveillance, AMLKYC and legal compliance to deliver high integrity price benchmarks that can stand up to the most stringent scrutiny.
Benchmark Portfolio Index Families
Regulated portfolio benchmarks that measure the price performance of specific digital asset exposures including; capitalization ranges, economic sectors and blockchain ecosystem categories utilising portfolio construction techniques that drive comprehensive exposure and weighting techniques that mitigate liquidity, operational and concentration risks.
Readily available data through major data vendors
CF Benchmarks provides key index analytics on its website in real time to give index users an up to date picture of price action dynamics and volume flows.
CME CF BRR is published and disseminated through major vendor platforms
- Bloomberg: BRR GO
- Refinitiv: .BRR
- CME MDP and DataMine

Highlighted products
 CF Large Cap Index
The CF Large Cap Index (CFFLCLDN_RR_TR) is a liquid investible benchmark portfolio index designed to track the performance of large-cap digital assets.
$LCAP The Large Cap Index DTF ($LCAP) is a fully collateralized token tracking the CF Large Cap Index and offers a transparent, efficient way to gain exposure to the index that brings the benefits of tokenization
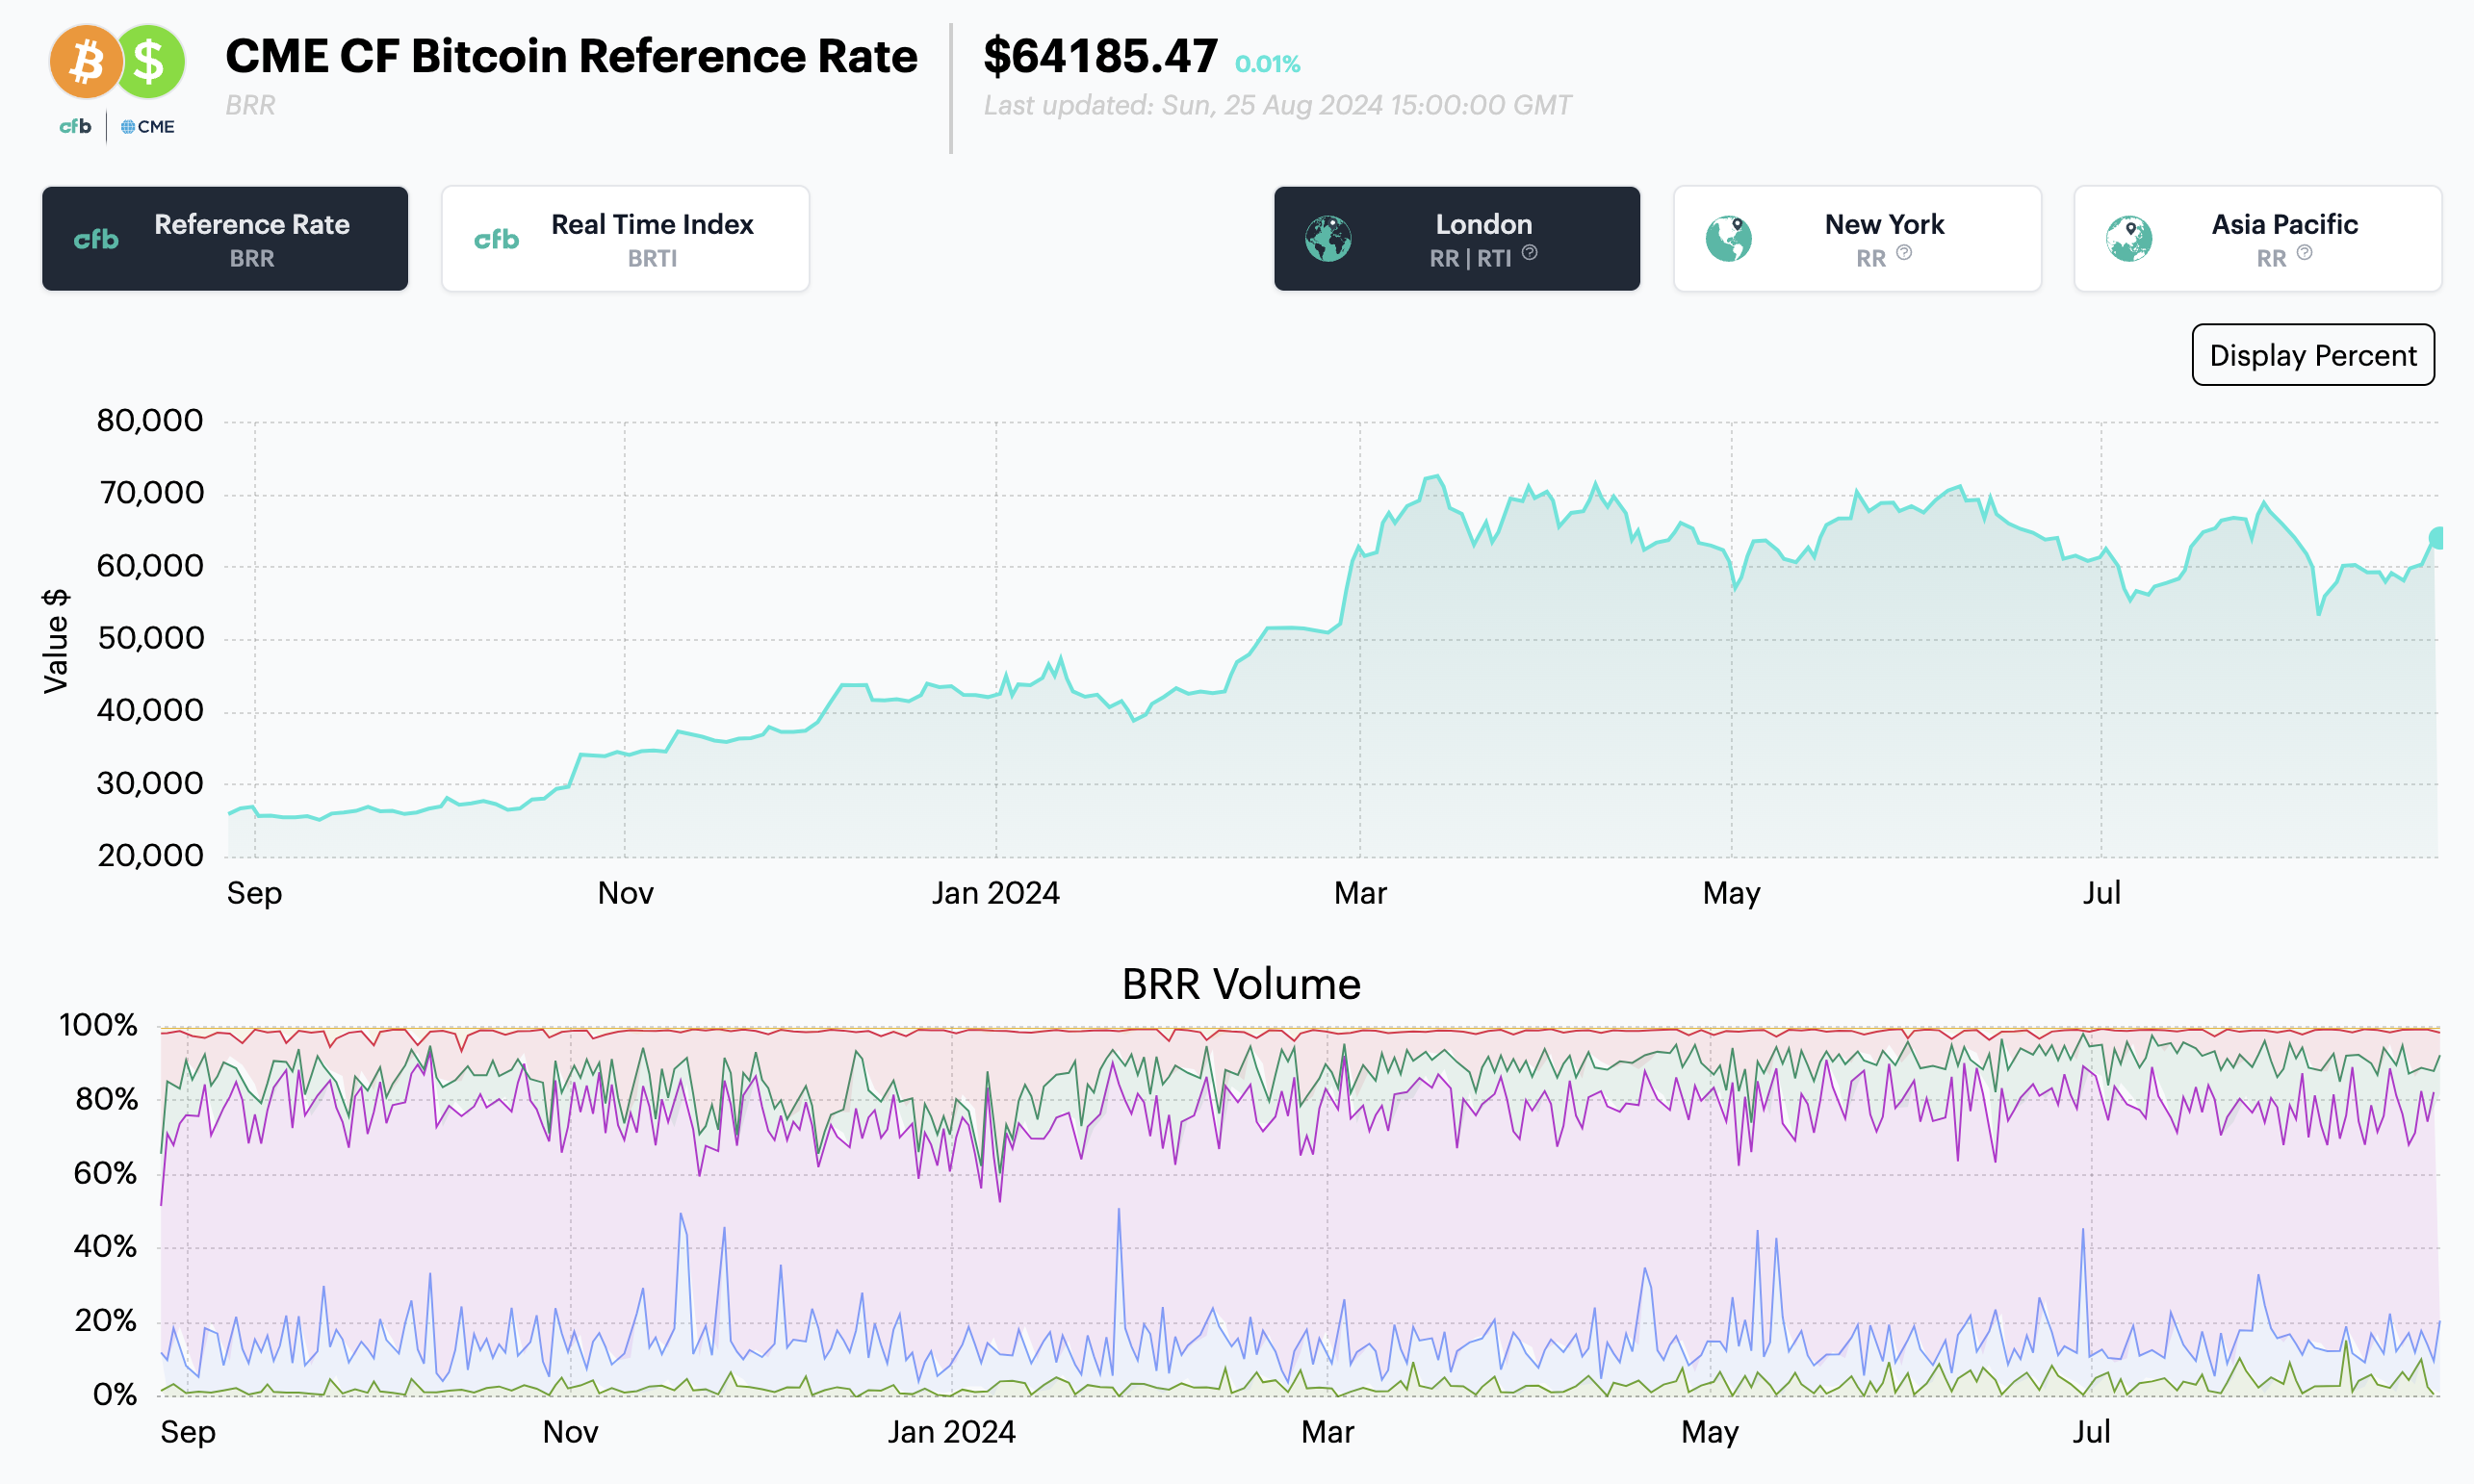
 CME CF Bitcoin Reference Rate (BRR)
The CME CF Bitcoin Reference Rate (BRR) is a once a day benchmark index price published at 1600 London time for Bitcoin that aggregates trade data from multiple Bitcoin-USD markets operated by major cryptocurrency exchanges that conform to the CME CF Constituent Exchange Criteria.
ETFs
BRR exposure is available through ETPs & ETFs offered by: CME CF Bitcoin Reference Rate - New York Variant (BRRNY)
The CME CF Bitcoin Reference Rate - New York Variant (BRRNY) is a once a day benchmark index price published at 1600 New York time for Bitcoin that aggregates trade data from multiple Bitcoin-USD markets operated by major cryptocurrency exchanges that conform to the CME CF Constituent Exchange Criteria.
ETFs
BRRNY exposure is available through ETPs & ETFs offered by: CME CF Ether-Dollar Reference Rate
The CME CF Ether-Dollar Reference Rate (ETHUSD_RR) is a once a day benchmark index price published at 1600 London time for Ether that aggregates trade data from multiple Ether-USD markets operated by major cryptocurrency exchanges that conform to the CME CF Constituent Exchange Criteria.
ETFs
ETHUSD_RR exposure is available through ETPs & ETFs offered by:- CME CF Ether-Dollar Reference Rate - New York Variant
The CME CF Ether-Dollar Reference Rate (ETHUSD_NY) - New York Variant is a once a day benchmark index price published at 1600 NY time to synchronise with US equity market close for Ether that aggregates trade data from multiple Ether-USD markets operated by major cryptocurrency exchanges that conform to the CME CF Constituent Exchange Criteria. Index .
ETFs
ETHUSD_NY exposure is available through ETPs & ETFs offered by:  CF Bitcoin Interest Rate (BIRC)
The CF Bitcoin Interest Rate Curve (BIRC) is intended to measure the underlying economic reality of cryptocurrency borrowing and lending, whether outright or implied in traded instruments.
 CME CF Bitcoin Volatility Index (BVX)
The CF Bitcoin Volatility Real Time Index (BVX) is a once a second benchmark representing a forward looking, 30-day constant maturity measure of implied volatility based on CFTC regulated Bitcoin option contracts traded on the CME.
 CF Broad Cap Index
The CF Diversified Broad Cap Index (CFDBCLDN_RR_TR) is a liquid investible benchmark portfolio index designed to track the performance of diversified exposure to a broad portfolio of the digital asset class.
 CF Rolling CME Bitcoin Futures Index
The CF Rolling CME Bitcoin Futures Index (CFCMBTCF_BTC) is a means of replicating the USD returns of holding physical Bitcoins through Bitcoin-USD futures contracts that allow investors to seek USD price exposure to Bitcoin.
 CF Staking Series
The CF ETH Staking Series and CF SOL Staking Series serve as a transparent and representative indicator of the daily realised reward associated with the staking of digital assets. They serve investors in providing an accurate measure of the economic incentives associated with a specific PoS network.
 CF Digital Asset Classification Structure (CF DACS)
The CF DACS classifies coins and tokens based on the services that the associated software protocol delivers to end users, grouping assets by the role they play in delivering services to end users.


Factor Friday - July 24, 2026
Beta's four-week grind higher stalled this week as style leadership rotated again: Momentum took the top spot, last week's leader Value fell to the bottom, and Growth stayed July's weakest factor. Size remains the only style factor positive on the year; beta, not style selection, is setting returns.

Mark Pilipczuk
Softer CPI Reprices July Hike Risk & Lifts Digital Assets
Digital assets extended their recovery over the past week as cooler US inflation prints repriced Fed expectations; the bid was broad across the large cap indices, growth factor leadership returned, stablecoin funding repriced lower, and stress stayed isolated in names hit by token-specific news.
Mark Pilipczuk
Bitcoin ETF Outflow Streak Ends as BVX Falls to a 12-Month Low
Digital assets traded mixed over the week: ETF inflows returned and the mega caps carried our headline indices, while high-beta names and diversified breadth lagged. DeFi led the themes, meme coins absorbed a governance attack, implied volatility kept compressing.
Gabriel Selby
By clicking Accept, you consent to CF Benchmarks's use of cookies.
Visit Cookie Settings to learn how CF Benchmarks uses cookies and to adjust your preferences.