
Jul 27, 2022
How CF DACS helps crack the Diversified Large Cap code
Deconstructing CF Diversified Large Cap Index exposure with CF Digital Asset Classification Structure spotlights portfolio management potential
CF DACS, ICYMI
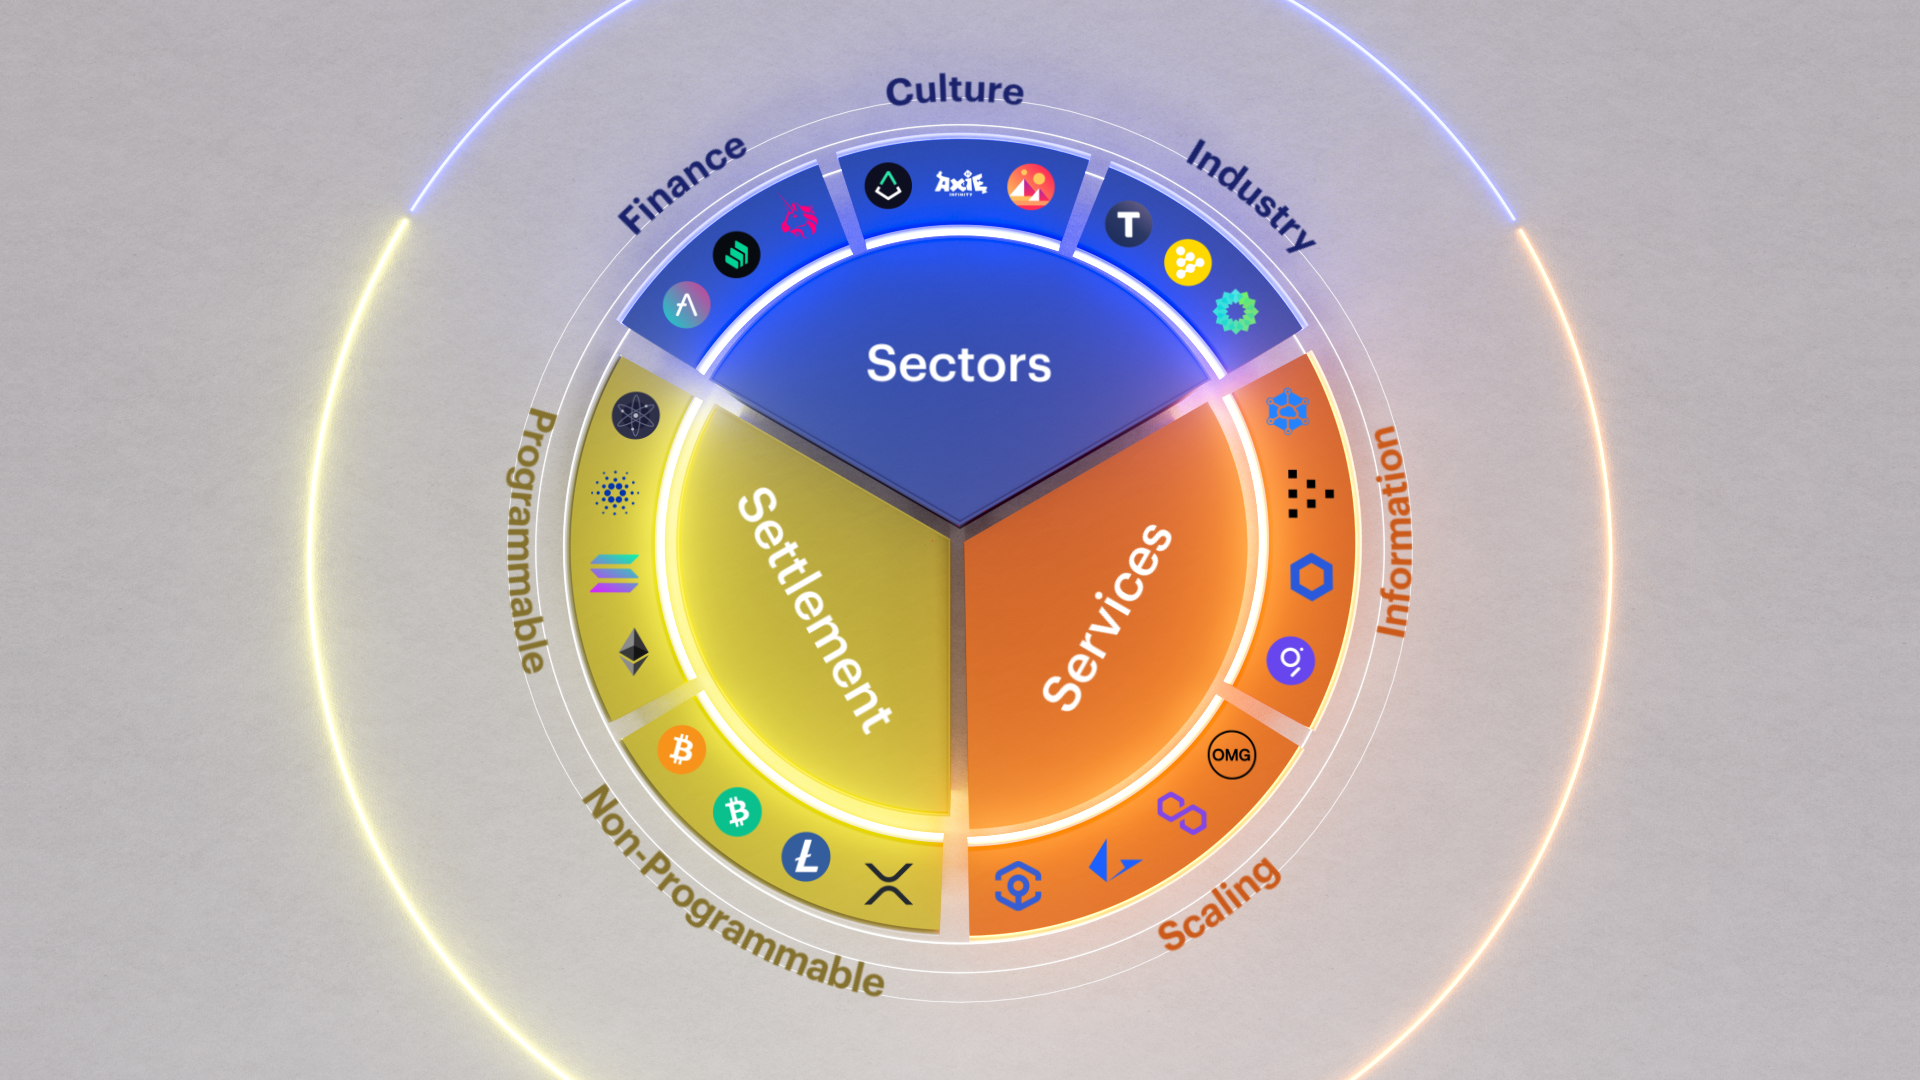
As a reminder, here’s how CF Digital Asset Classification Structure (CF DACS) meets the critical need for a cogent framework that defines protocols of the digital asset universe:
- CF DACS codifies standards by which digital assets are categorised:
- As Sector applications, Settlement networks or on-chain Services
- Subcategories define the function through which protocols serve outcomes to end users:
- Through an economic Sector - Finance, Culture, or Industry
- Through one of two broad types of Service protocols - Scaling or Information
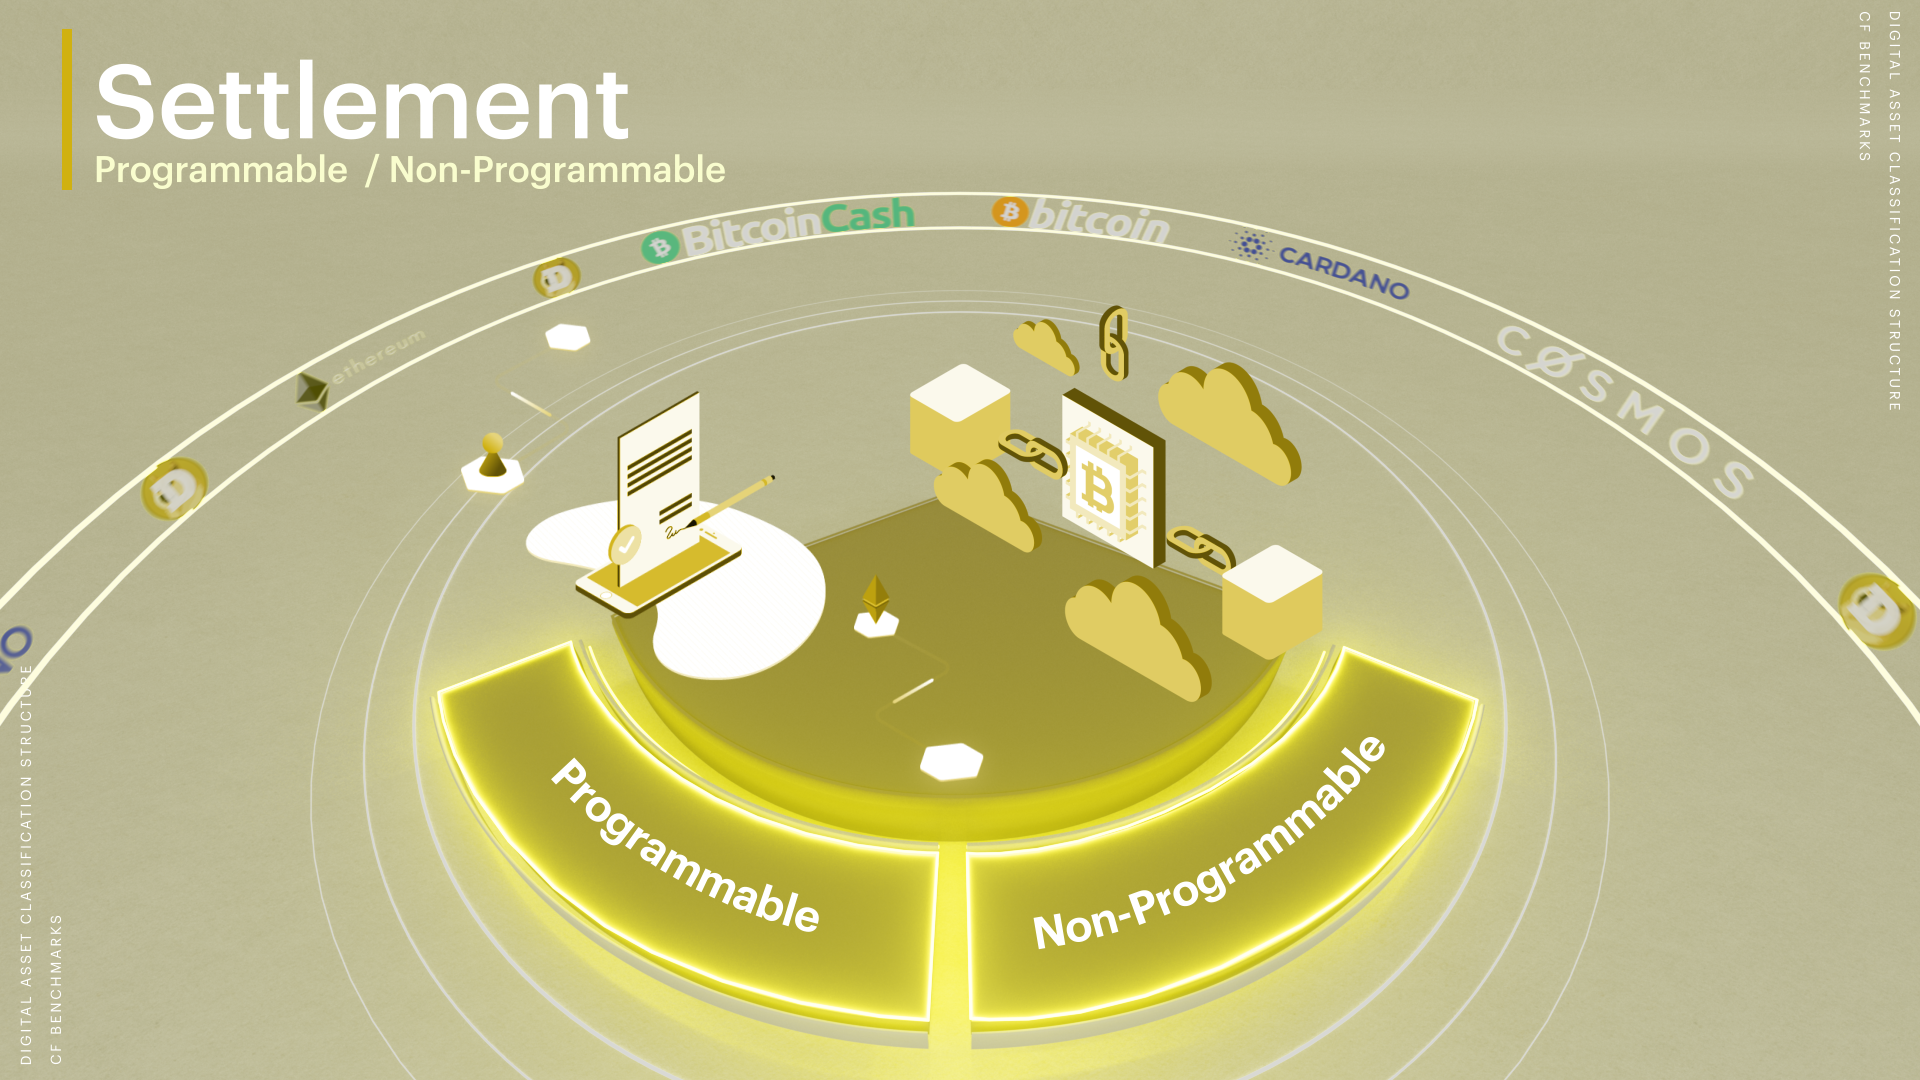
- Through the Settlement layer – either Programmable or Non-Programmable
Investors can now conduct reliable attribution analyses of cryptoasset portfolios; a process that was all but impossible to undertake before CF DACS existed, and a critical prerequisite for the evolution of institutional digital asset management.
As we showed in our recent outline returns attribution of Nasdaq Crypto Index (NCI), CF DACS provides information and insights into the economic reality engendered by digital asset holdings at a higher-resolution than is possible from an examination of assets and weights alone.
How Diversified is CF Diversified Large Cap Index?
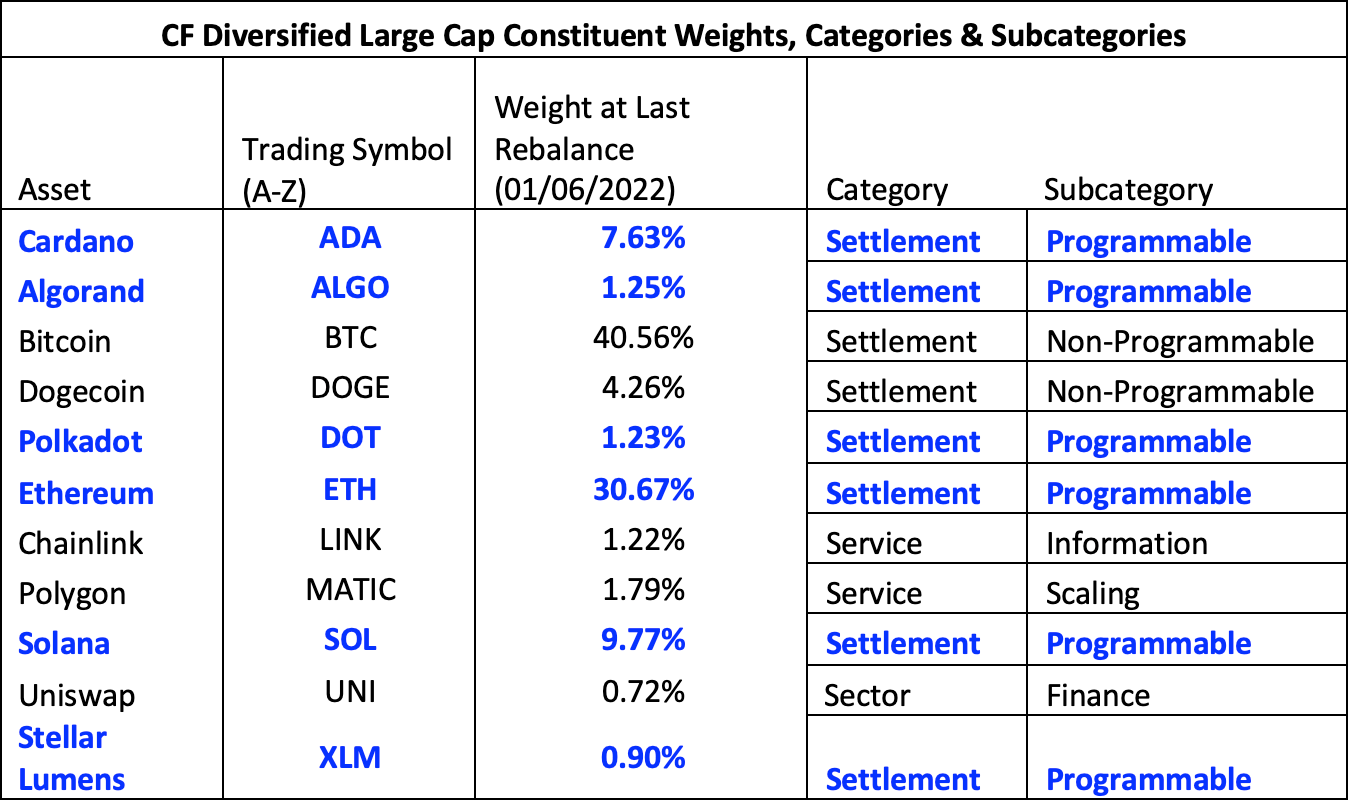
For another example, we’ve applied the structure to CF Benchmarks’ CF Diversified Large Cap Index - the regulated liquid benchmark representing 95% of the total market capitalisation of the investible digital asset universe.
And whilst this is not the place to go too deeply into a comparison of the portfolios, it’s worth noting – at a high level – differences between CF Diversified Large Cap and NCI category and subcategory weights.
Doing this helps illustrate their differing methodologies and how well they meet implied investment objectives – together with CF DACS, the exercise is an attribution-lite that spotlights the key strengths of the structure.
The Diversified goal
First, let’s outline CF Diversified Large Cap’s implied objectives.
Its diversification objective is self-evident. But that goal is quantified by CF Benchmarks’ Diversified Market Capitalisation Method.
For the full methodology go here:
CF Diversified Series Methodology Guide
And here:
CF Digital Asset Index Family - Multi Asset Series Ground Rules - Section 4
For an egregiously simplified version, see below:
- The guiding rationale is to avoid over-concentration, particularly of BTC and ETH (due to their dominant free-float market caps)
- Constituent eligibility is determined by criteria defined in the Multi Asset Series Ground Rules (see above) – chiefly section 2
- The top 95% eligible constituents are selected on a free float market cap basis
- Constituents’ weights are then modified as follows:
- The weight of each constituent is divided into intervals of equal length – 4%
- Intervals (except interval 1) are subjected to sequentially increasing divisors (i.e., 2, 3, 4, etc):
- So instead of 4%, the second interval is divided by 2 and becomes 2%; the third interval (interval 8%-12%) is divided by 3, and so on
- Modified weights from each interval are combined to provide the new constituent weight
- The process is repeated for each constituent
This methodology is designed to ‘penalize’ free float market caps of heavier constituent weights more than lighter weights, thereby reducing the index weight dominance of the former.
NCI – more ‘measured’
By contrast, Nasdaq Crypto Index does not have ‘diversification’ as a manifest objective. Instead, eligible assets are selected “according to their relative free float market capitalizations.”
As NCI’s Methodology states, it is designed "to measure the performance of a material portion of the overall digital asset market”.
Weight shift
Comparing resultant CF DACS subcategory weights for CF Diversified Large Cap with those of NCI, we find moderate-to-sharp differences.
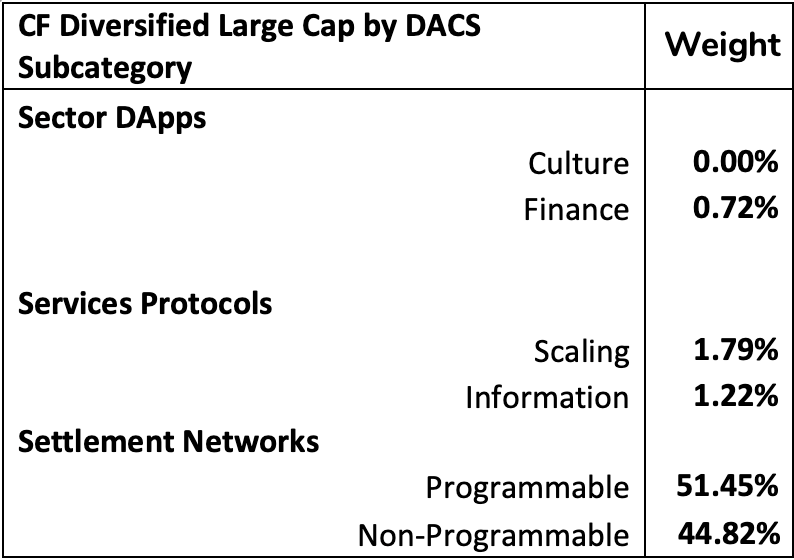
As shown in Figure 1. below, the Non-Programmable subcategory of the Diversified Large Cap Index equated to 44.82% as of June 1st, 2022. The Programmable subcategory comprised 51.45%.
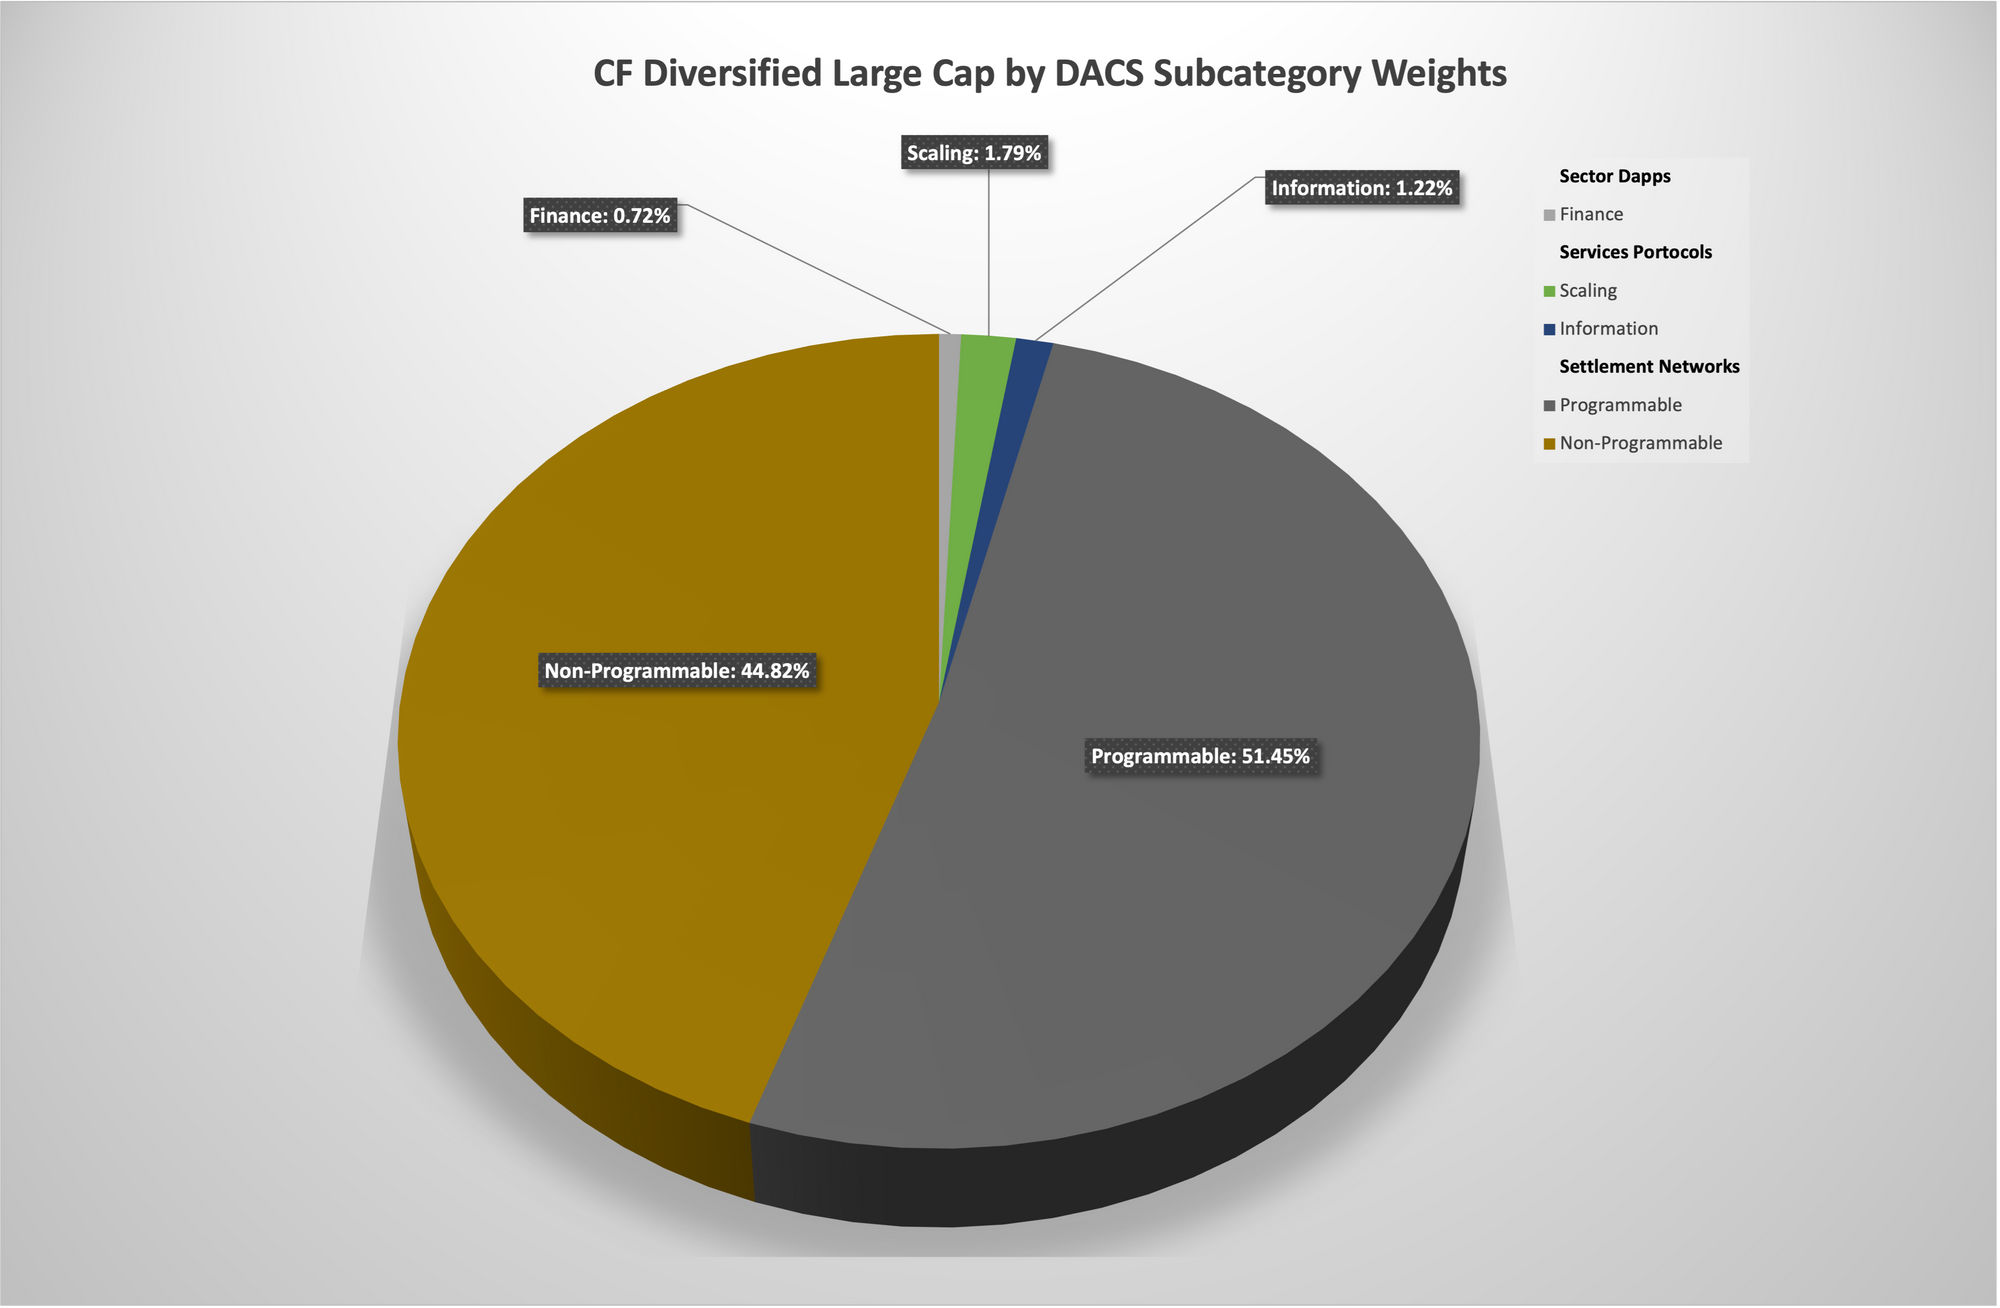
That compared with 68.49% in Non-Programmable and 29.89% in Programmable for NCI, as of March 1st, 2022.
Subcategory weights for both portfolios are summarised below.
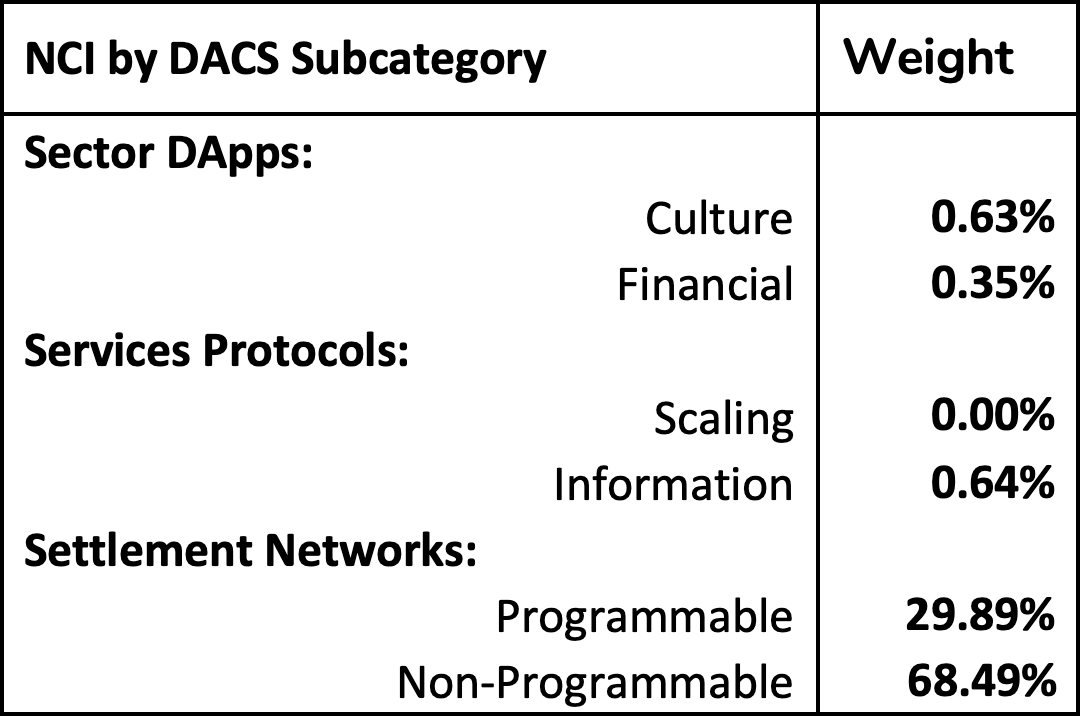
Top-level points:
- The Non-Programmable subcategory (largely Bitcoin) in CF Diversified Large Cap is around 35% lower than in NCI, implying significantly lower exposure to BTC, whilst implied representation of the subcategory remains substantial at around 45%
- There are 6 Programmable constituents in Diversified Large Cap compared with two in NCI, with weights more evenly distributed (see Table 3) than in NCI
- Culture DApps have gained a high public profile—due to NFTs, decentralized video games etc—but their relatively small proportion of the Sector Category results in a 0% weight in Diversified Large Cap vs. 0.63% in NCI
- Finance DApps (mostly DeFi) are still a modest fraction of the total digital asset market capitalisation, helping account for Diversified Large Cap’s 0.72% weight in the subcategory – still almost double NCI’s
Conclusion
CF Diversified Large Cap Index and NCI aren’t properly comparable, but the utility of the structure is clear even from the above surface level examination.
Whilst both portfolios purport to be broadly representative of the crypto market, CF DACS reveals and quantifies the precise exposure of their constituents to standardized classification categories and subcategories.
In this way, the structure is an impartial gauge of the extent to which any digital asset portfolio ‘does what it says on the tin’ – i.e., meets its investment objectives.
This functionality paves the way for the granular fine tuning—including rebalancing and reconstitution—required to ensure that a digital asset portfolio remains aligned with its objectives.
Watch below to understand CF Digital Asset Classification Structure in 3 mins
Read the complete introduction:
Introducing the CF Digital Asset Classification Structure
The information contained within is for educational and informational purposes ONLY. It is not intended nor should it be considered an invitation or inducement to buy or sell any of the underlying instruments cited including but not limited to cryptoassets, financial instruments or any instruments that reference any index provided by CF Benchmarks Ltd. This communication is not intended to persuade or incite you to buy or sell security or securities noted within. Any commentary provided is the opinion of the author and should not be considered a personalised recommendation. Please contact your financial adviser or professional before making an investment decision.
Note: Some of the underlying instruments cited within this material may be restricted to certain customer categories in certain jurisdictions.
Bitcoin Implied Volatility Holds Steady Despite Hawkish Fed
Digital assets gave back ground this past week as a hawkish first meeting under the new Fed chair repriced rates and the dollar, pulling the complex lower. The move was broad rather than rotational, growth and value led the factor tape, and implied volatility held flat as realized rose to meet it.

Gabriel Selby
Factor Friday - June 19, 2026
The drawdown stalled this week: the Market factor fell just 0.40% after last week's 7.77% drop, and leadership rotated out of defensives back into fundamentals. Growth led at +2.54% and Value at +2.15%, while Size held the year-to-date top spot. Momentum stayed the weakest factor.
Mark Pilipczuk
Suspension of Contributed Exchanges from Certain Token Market Price Benchmarks
The Administrator announces the suspension of Contributed Exchanges from Certain Token Market Price Benchmarks detailed below
CF Benchmarks
By clicking Accept, you consent to CF Benchmarks's use of cookies.
Visit Cookie Settings to learn how CF Benchmarks uses cookies and to adjust your preferences.