
Aug 04, 2025
Weekly Index Highlights, August 4, 2025
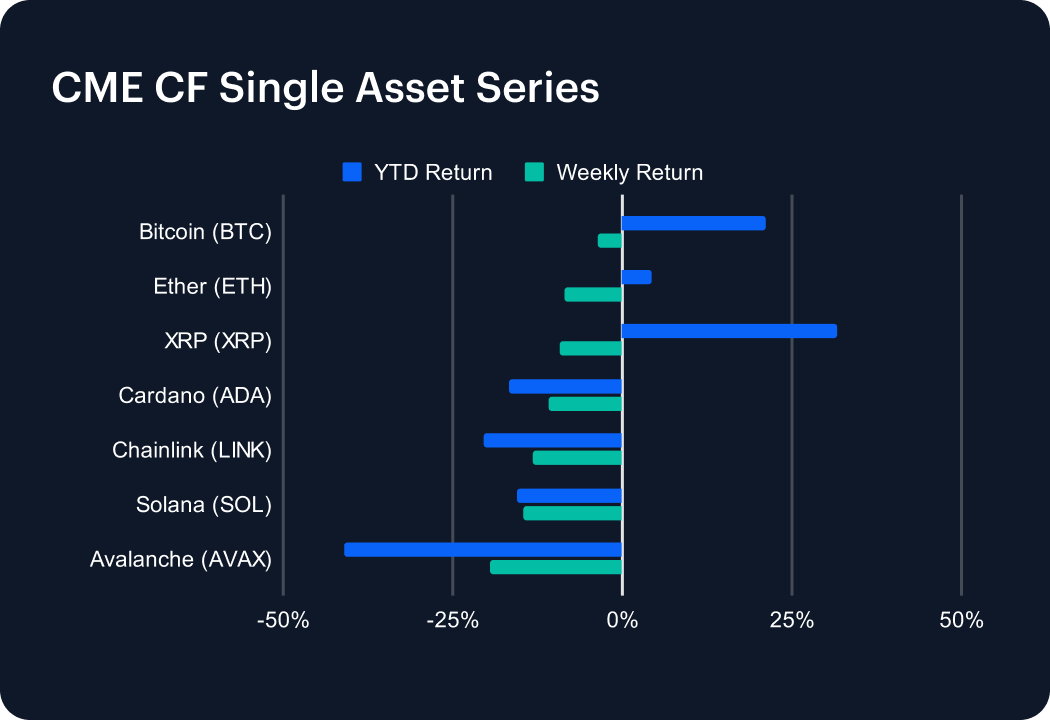
Market Performance Update
Last week saw mean reversion across the major tokens, led by Avalanche’s steep 19.55% drop. Solana underperformed as well, sliding 14.50% and dragging its 2025 return further negative to 15.51%. Chainlink lost 13.09% on the week, extending its YTD slide to 20.42%. While XRP fell 9.26%, it still boasts a 31.74% gain so far this year. Ethereum’s pullback was less pronounced, tumbling 8.62% and trimming its YTD advance to just 4.27%. Bitcoin proved the most resilient, dipping only 3.71% over the week and maintaining a robust 21.12% gain for the year.
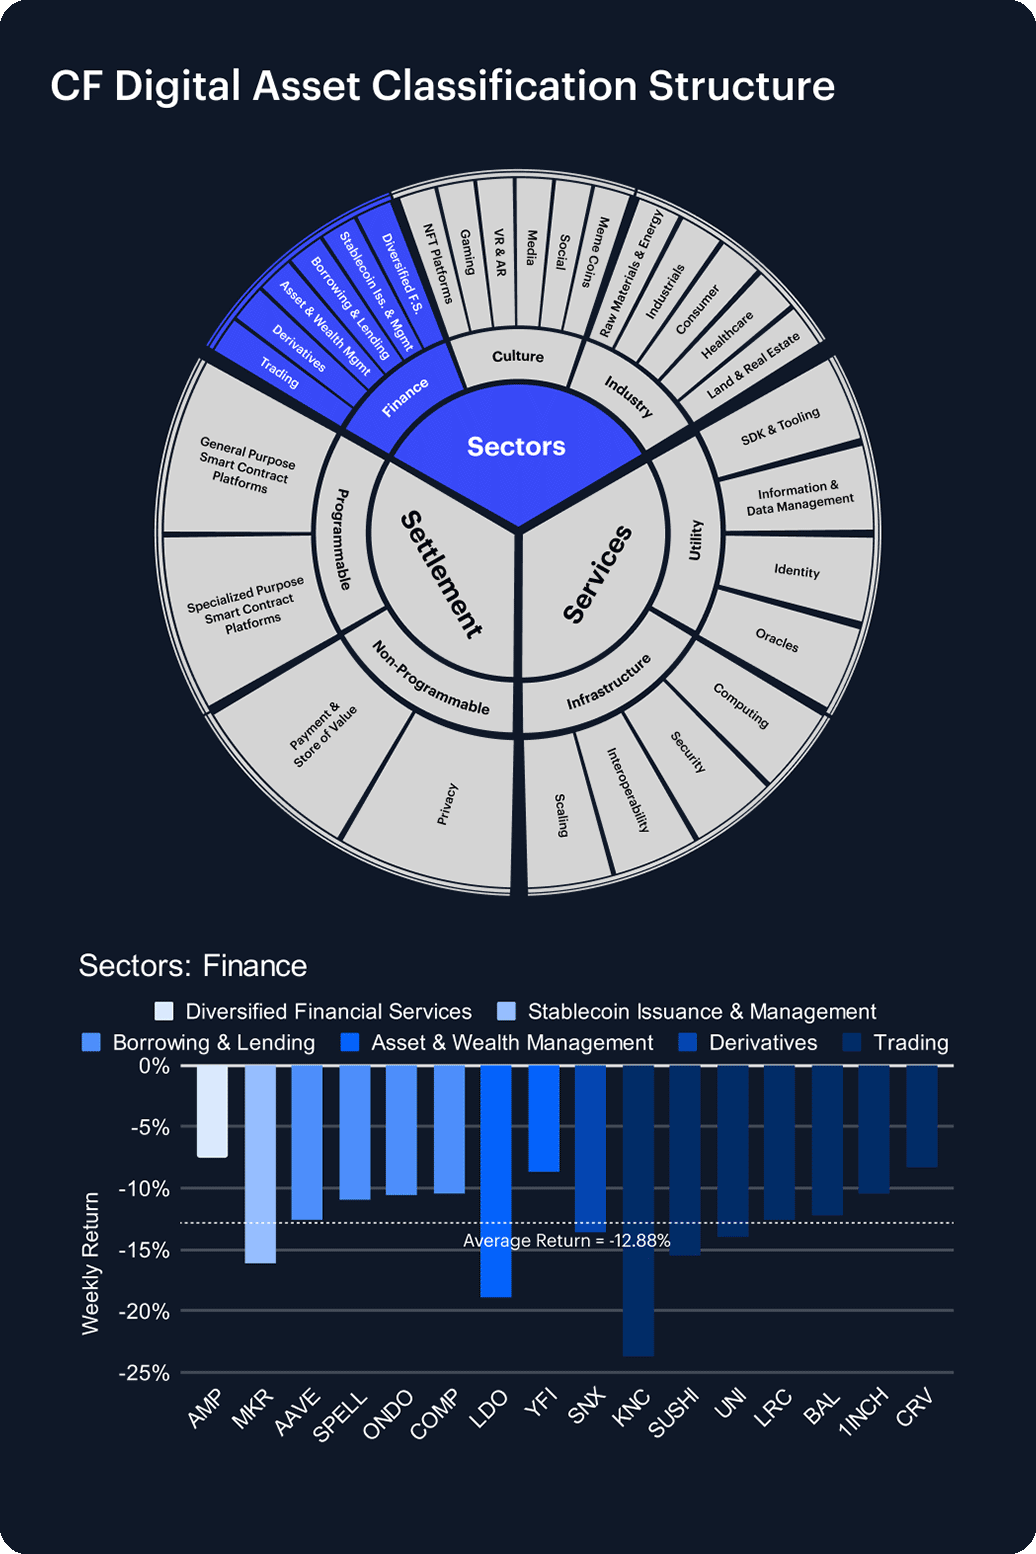
Sector Analysis
The DACS segments saw widespread weakness last week, though a few names bucked the trend. In the finance sub-category, CRV held up the best at –8.31% versus a –12.88% sector average, while KNC plunged 23.70%. The Derivatives and Asset & Wealth Management segments were a weak spot, with SNX down 13.56% and LDO off 18.92%. In the Culture sub-category, PRIME outperformed (–7.67% vs –14.42%), but meme token BONK collapsed 28.98%. Within Services, ANKR topped the Utility sub-category (–13.09% vs –14.61%), while BICO tumbled 20.16%. The Infrastructure sub-category saw ZRO hold up best at –13.04% as TIA fell 17.27%. Among Programmable Settlement tokens, ETH outshone programmable chains (–8.62% vs –13.59%), within non-programmable settlement tokens, LTC was the standout at –1.49.
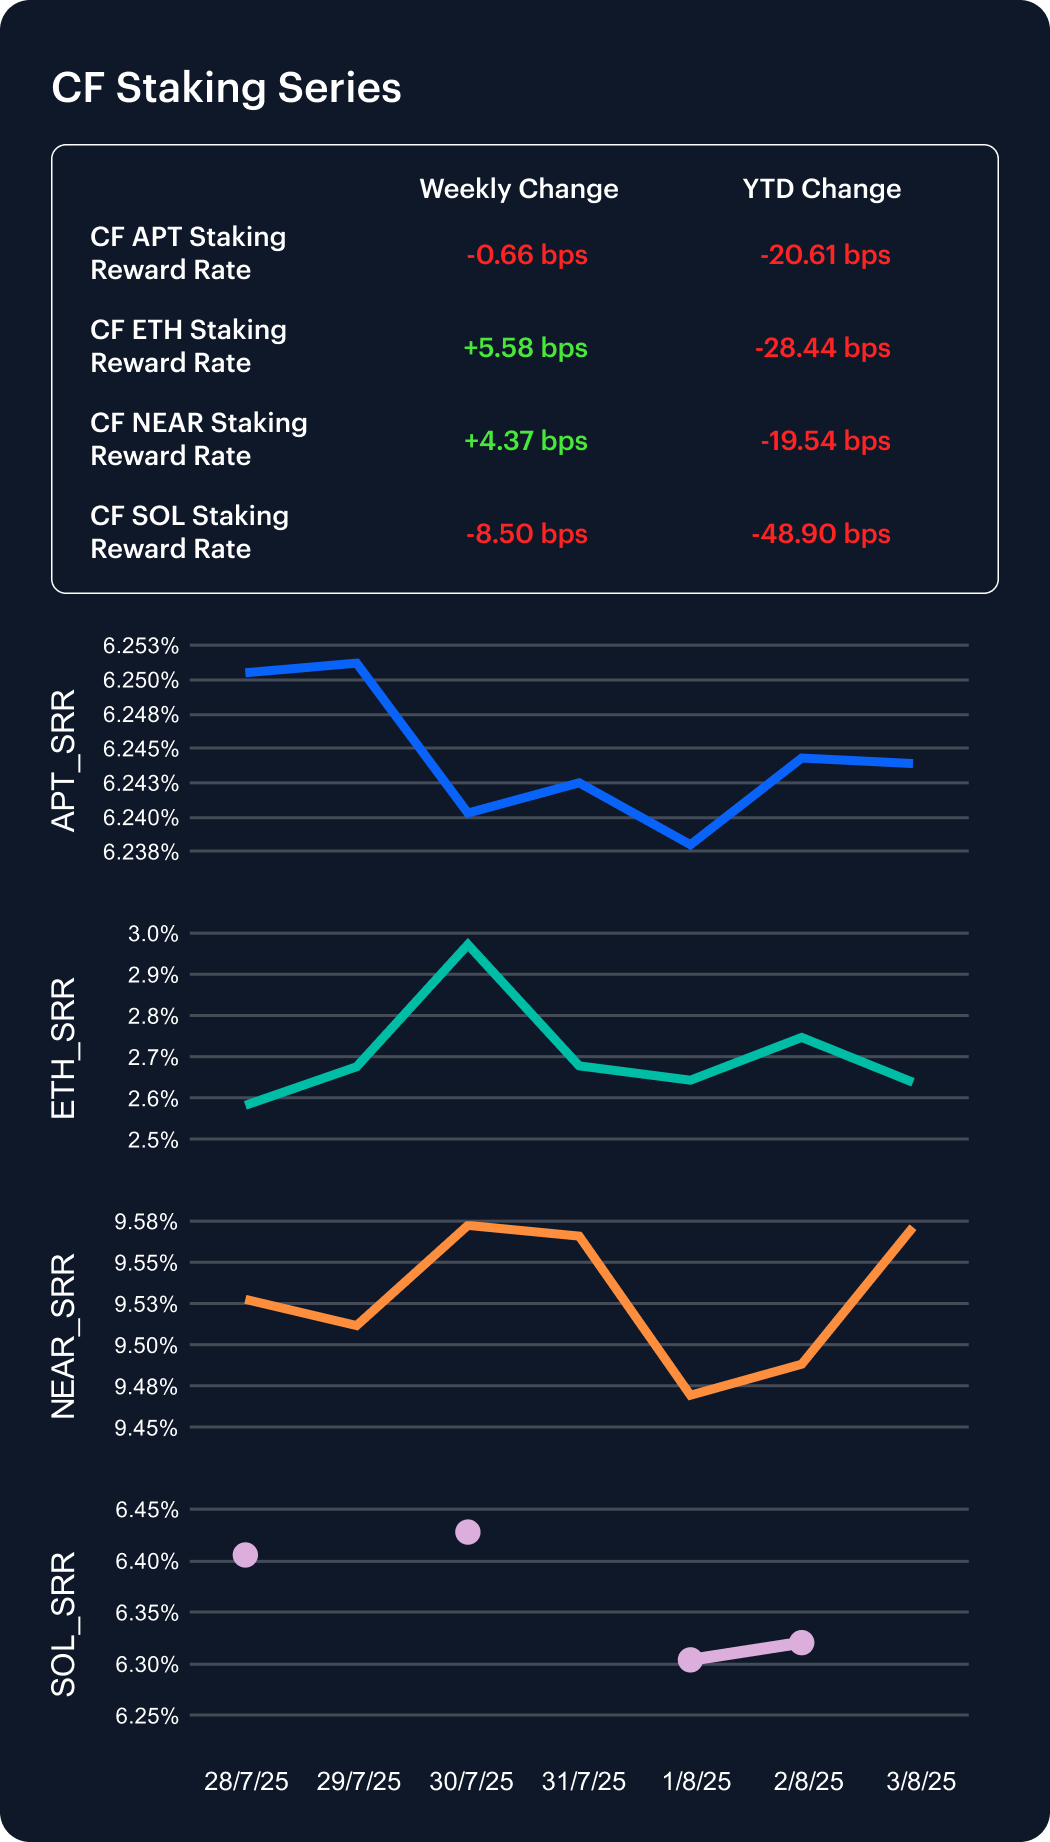
CF Staking Series
Staking yields continued to fluctuate last week, reflecting shifting demand across proof-of-stake ecosystems. Ether’s staking reward rate jumped 2.16% to 2.58%, yet it has fallen the most in 2025, with a year-to-date decline of 9.73%. NEAR climbed 0.46% to 9.53%, narrowing its YTD decrease to 2.00% and retaining its status as the highest-yielding network. Aptos dipped 0.11% to 6.25%, trimming its YTD decrease to 3.20%, while Solana slipped 1.33% to 6.41%, widening its year-to-date decrease to 7.18%. These shifts are the result of divergent staking appetites and inflation dynamics on these networks.
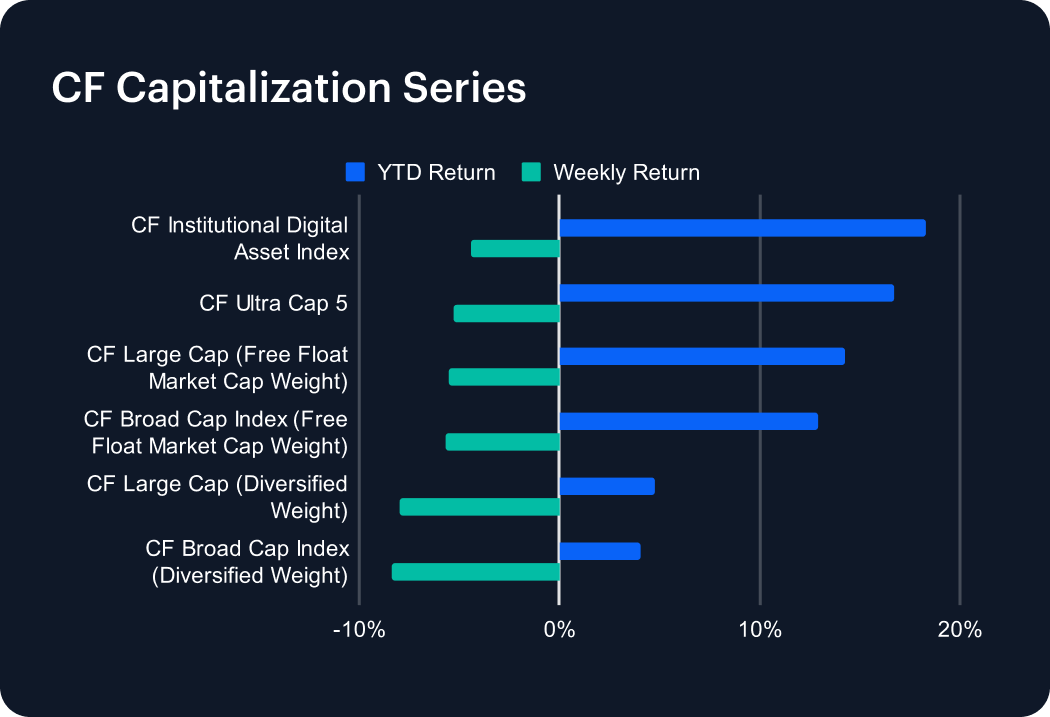
Market Cap Index Performance
The CF Capitalization Series endured a pronounced pullback last week, with every marquee index posting declines. CF Institutional Digital Asset Index proved the most resilient, slipping just 4.45% and holding an 18.26% year-to-date gain. CF Ultra Cap 5 followed, down 5.25% (YTD +16.69%), while its broad-based free-float counterpart retraced 5.72%, trimming its YTD return to 12.92%. Among free-float large caps, the drop was 5.50%, leaving that segment up 14.29% in 2025. The diversified-weight indices underperformed: the Broad Cap fell 8.36% (YTD +4.07%) and Large Cap lost 8.02% (YTD +4.77%). This divergence underscores continued strength in large-cap names as the market experiences downside volatility.
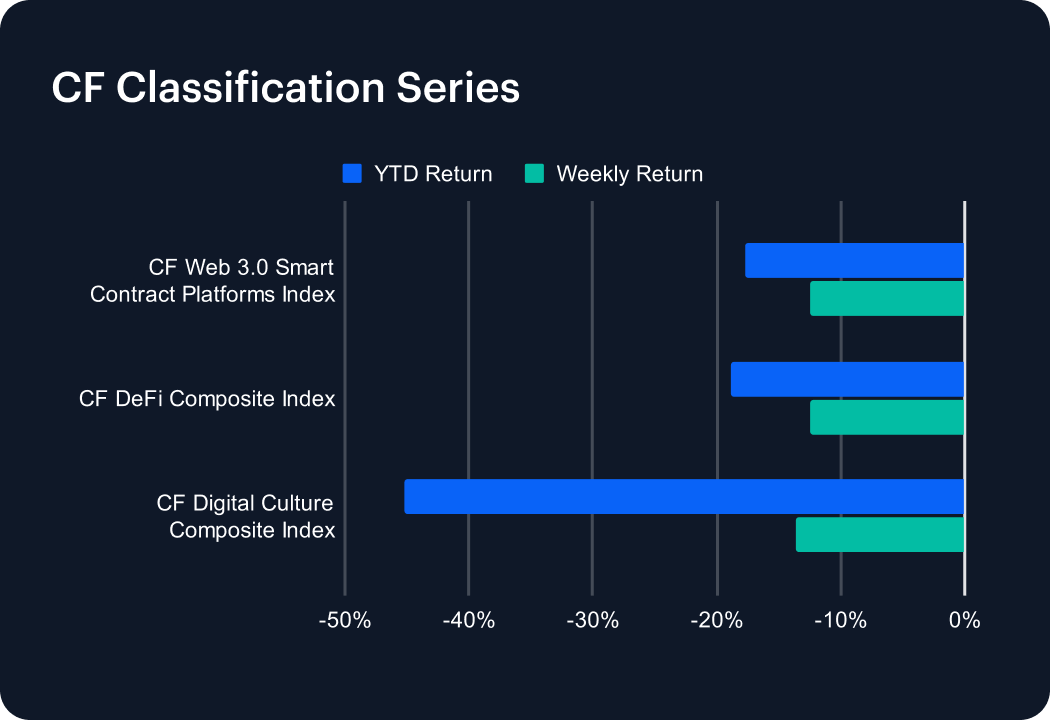
Classification Series Analysis
The CF Classification Series extended its downturn last week as every thematic index posted double-digit losses. The CF Web 3.0 Smart Contract Platforms Index led the pullback, plunging 12.46% and widening its year-to-date deficit to 17.71%. Close behind, the CF DeFi Composite Index slid 12.51%, deepening its YTD decline to 18.86%. The CF Digital Culture Composite Index suffered the steepest drop at 13.58%, pushing its cumulative loss to 45.23% in 2025. With high-beta segments bearing the brunt of volatility and no safe haven among themes, these benchmarks remain far below their early-January peaks and face a steep climb to recovery.
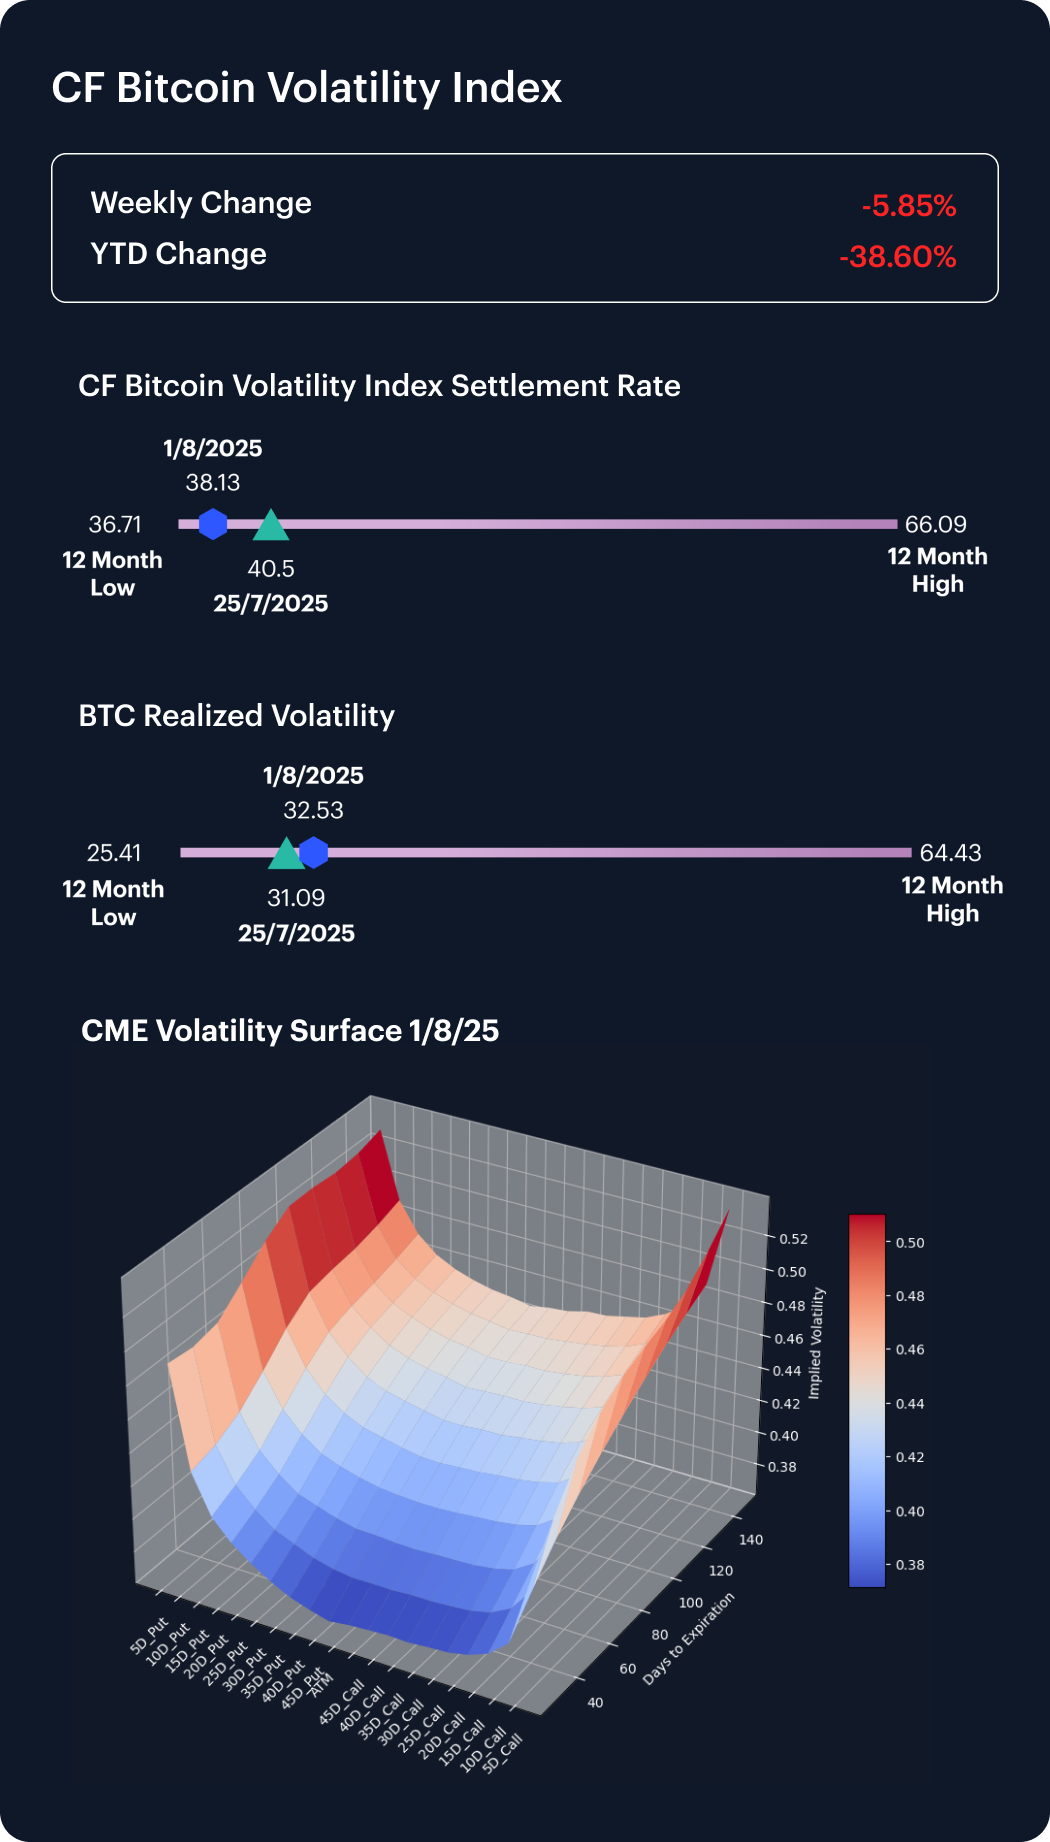
Volatility
The CF Bitcoin Volatility Index Settlement Rate (BVXS) declined 5.85% last week, falling from 40.50 to 38.13 and remaining 38.60% below its January 1 level. Realized volatility rose to 32.53, up from 31.09 a week earlier, reflecting renewed spot swings even as option premia stay muted. On the volatility surface, skew remained positive but relatively flat across all delta buckets, indicating balanced demand for calls and puts. Notably, implied volatility for short-dated 5 delta puts ticked higher, suggesting growing tail-risk hedging in the front end. Short-dated tenors under 60 days continue to trade as the softest segment, whereas longer maturities command a material premium. Overall, softer BVXS prints alongside elevated front-end implied vols point to persistent directional exposure amid a calmer realized backdrop.
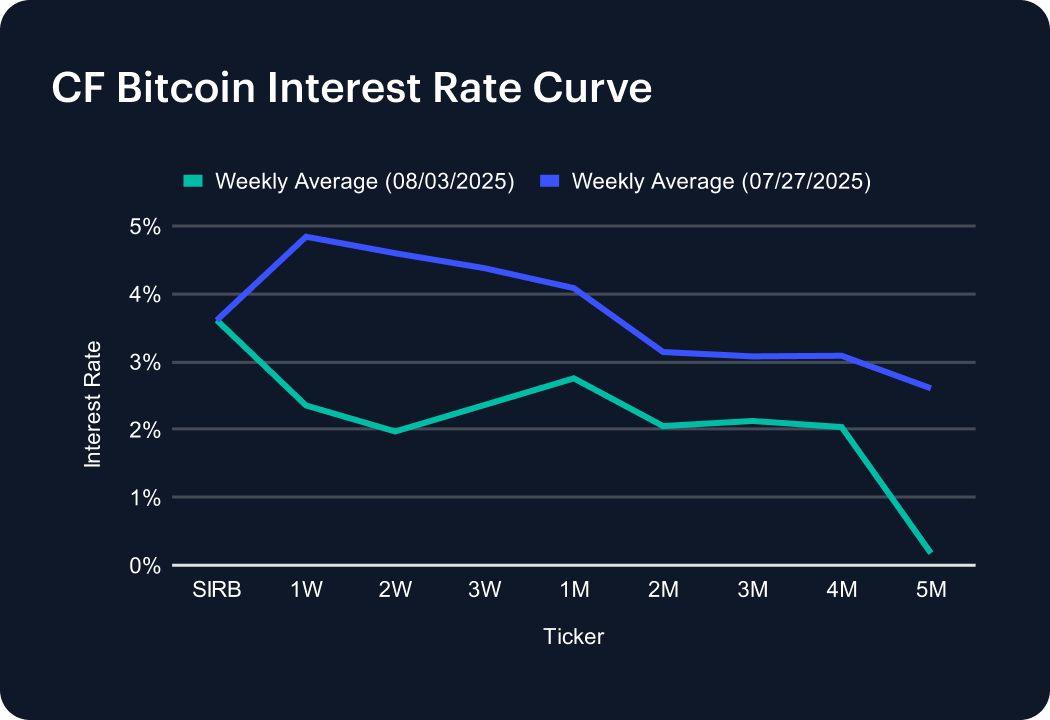
Interest Rate Analysis
The CF Bitcoin Interest Rate Curve flattened significantly last week as funding costs across tenors collapsed. The Short-Term Interest Rate Benchmark held at 3.61%, anchoring the curve. One-week funding plunged 249 bps to 2.35%, while two- and three-week tenors fell 263 bps to 1.97% and 202 bps to 2.36%, respectively. One-month rates declined 133 bps to 2.75%. Mid-curve tenors also saw sharp drops: two-month down 109 bps to 2.05%, three-month off 95 bps to 2.13%, and four-month lower by 105 bps to 2.04%. Even five-month funding collapsed 243 bps to 0.18%. These widespread decreases reflect waning short-term demand and a pronounced curve flattening across the funding spectrum.
The information contained within is for educational and informational purposes ONLY. It is not intended nor should it be considered an invitation or inducement to buy or sell any of the underlying instruments cited including but not limited to cryptoassets, financial instruments or any instruments that reference any index provided by CF Benchmarks Ltd. This communication is not intended to persuade or incite you to buy or sell security or securities noted within. Any commentary provided is the opinion of the author and should not be considered a personalised recommendation. Please contact your financial adviser or professional before making an investment decision.
Note: Some of the underlying instruments cited within this material may be restricted to certain customer categories in certain jurisdictions.
Changes to the Token Market Price Benchmarks Series - Market Prices – 21 July 2026
The Administrator has confirmed changes to the Token Market Price Family for the period 14 July 2026 to 21 July 2026.

CF Benchmarks
Softer CPI Reprices July Hike Risk & Lifts Digital Assets
Digital assets extended their recovery over the past week as cooler US inflation prints repriced Fed expectations; the bid was broad across the large cap indices, growth factor leadership returned, stablecoin funding repriced lower, and stress stayed isolated in names hit by token-specific news.
Mark Pilipczuk
Notice of the Demising of CF Dai-Dollar Settlement Price and Spot Rate
The Administrator announces that it will demise the CF Dai-Dollar Settlement Price (DAIUSD_RR) and CF Dai-Dollar Spot Rate (DAIUSD_RTI) which are members of the CF Digital Asset Index Family.
CF Benchmarks
By clicking Accept, you consent to CF Benchmarks's use of cookies.
Visit Cookie Settings to learn how CF Benchmarks uses cookies and to adjust your preferences.