
Dec 22, 2025
Weekly Index Highlights, December 22, 2025
Market Performance Update
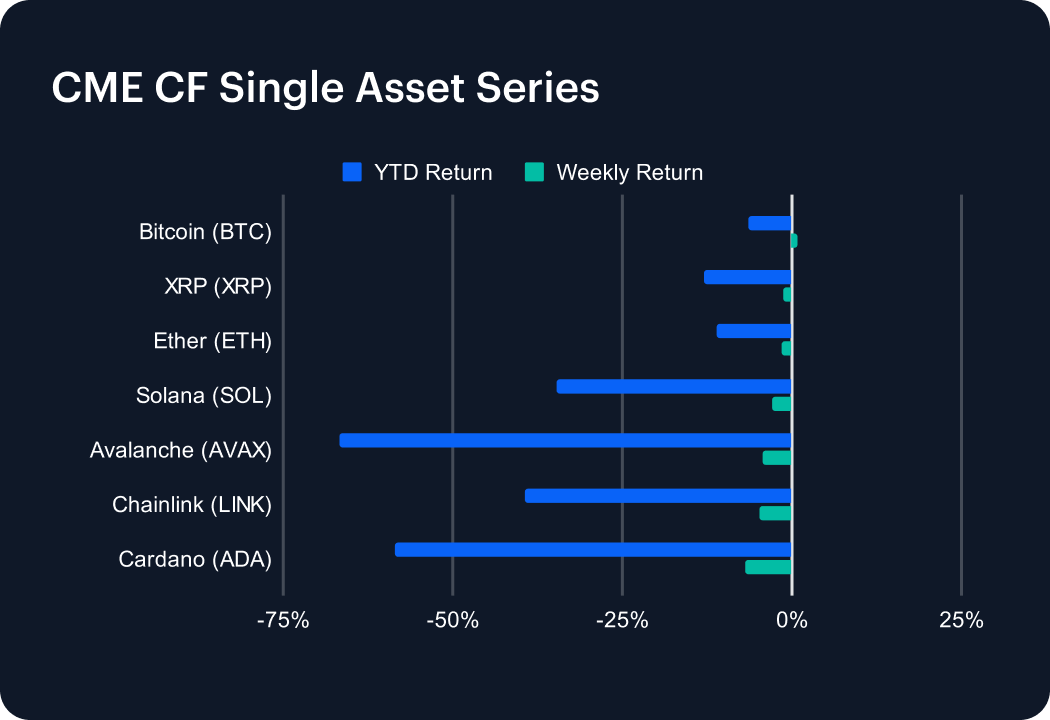
Year-end positioning kept digital asset market leadership narrow and dispersion high in the last full week before the holiday season. BTC held modestly positive while higher-beta majors and alts retraced, leaving the week defined more by relative returns than outright direction. Bitcoin gained 0.9% week-on-week (w/w), trimming its year-to-date (YTD) decline to -6.4%, while Ether fell -1.5% (YTD -11.0%). XRP declined -1.3% w/w, leaving it down -12.9% YTD, and Chainlink (LINK) was down -4.8% w/w and YTD -39.4%. Across other large liquid names, SOL dipped -2.9% w/w, extending its YTD loss to -34.8%, while Avalanche (AVAX) fell -4.3% w/w for -66.6% YTD. Cardano (ADA) was the week’s laggard at -7.0%, and -58.4% YTD. With 6 of 7 single-asset indices negative on the week, and a best–to-worst spread of 7.9 percentage points (from 0.9% to -7.0%), price action suggests no material return to risk seeking as yet, with beta compression more evident. BTC’s measly gain outperformed ETH by 2.4 pp, and outperformed SOL and AVAX by 3.8 pp and 5.2 pp respectively. These performance gaps set the tone.
Sector Analysis
Sector performance diverged across the CF DACS buckets, with Non-Programmable in the relative leading position at -0.3% on average w/w, and Infrastructure lagging at -10.4% w/w. Within the leading bucket, BCH returned 6.0% w/w and BTC 0.9% w/w, offsetting declines in XLM (-4.0%) and LTC (-3.1%). By contrast, the lagging bucket was pulled lower by STRK (-23.2%) and TAO (-19.5%), despite QNT managing to scratch out a 1.1% gain w/w. Finance printed -4.0% w/w, characterized by a large positive outlier in UNI (which spiked +19.4%) alongside deep drawdowns in COMP (-15.4%). Culture was weaker at -8.3% w/w, with CHZ up +15.8% but RARI down -27.8%. Taken together, the pattern — a near-flat Non-Programmable bucket at -0.3% versus a -10.4% print in Infrastructure — points to a defensive rotation, with idiosyncratic winners coexisting with double-digit weekly drawdowns.
CF Staking Series
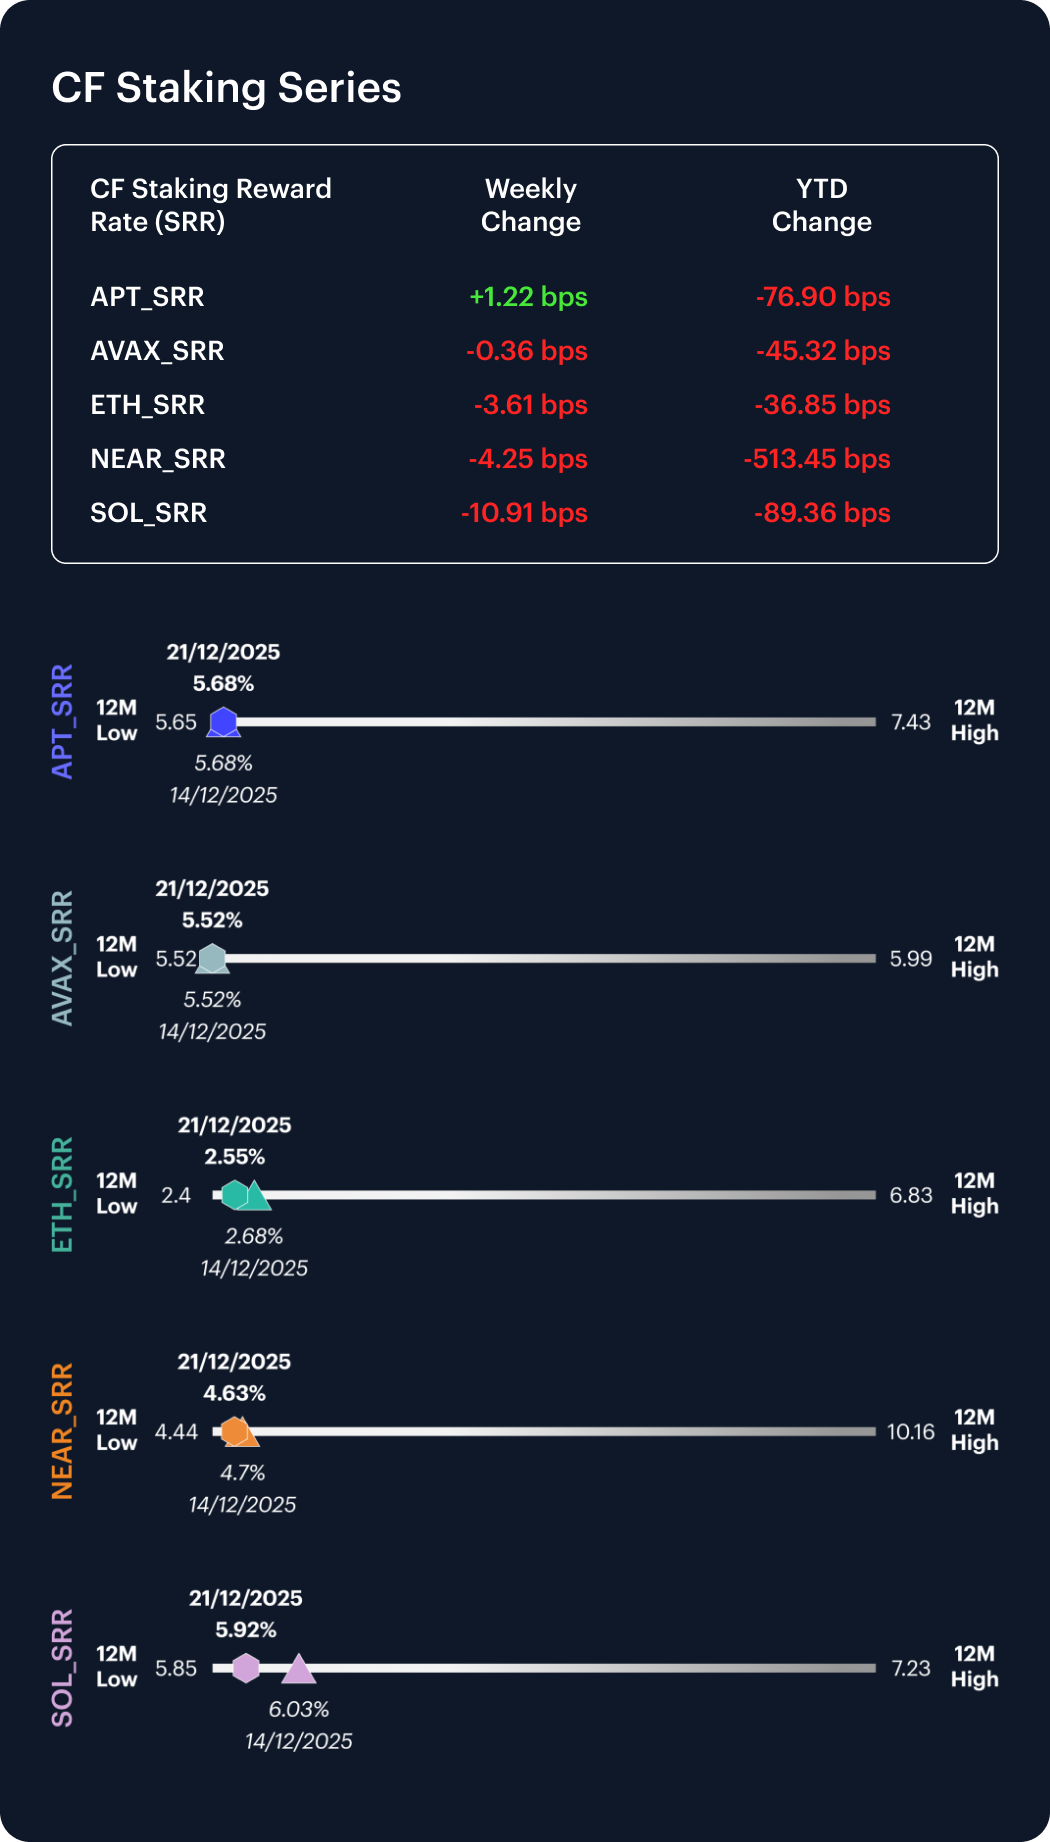
Within the CF Staking Series, APT returned 0.2% w/w, with its reward rate moving 1.22 bps between the beginning and end of the most recently completed week, while AVAX was -0.1% w/w with a -0.36 bps shift. ETH fell -1.4% w/w, reading as a -3.61 bps intra-week reward rate move, and NEAR and SOL returned -0.9% and -1.8% w/w respectively, equating to their reward-rate changes of -4.25 and -10.91 bps respectively, over the same window. In aggregate, intra-week reward-rate moves ranged from -10.91 to 1.22 bps, with their corresponding weekly percentage returns ranging from -1.8% to 0.2%. The combination of negative performance in ETH (-1.4%), SOL (-1.8%) and NEAR (-0.9%) with modest reward-rate drift overall (single-digit bps for four of five assets) points to a subtle repricing in risk appetite at most, with no discrete shift in staking economics for now.
Market Cap Index Performance
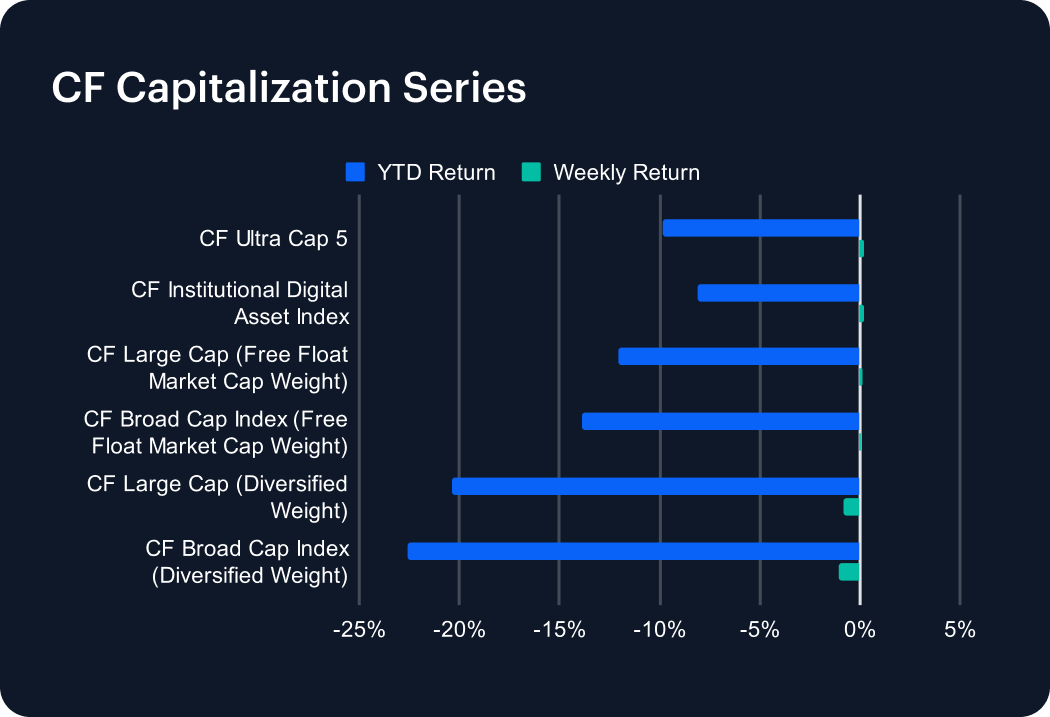
The CF Capitalization indices were tightly clustered at the large-cap end, with CF Ultra Cap 5 up 0.2% w/w (YTD -9.8%), CF Institutional Digital Asset Index up 0.2% w/w (YTD -8.1%) and CF Large Cap (Free Float Market Cap Weight) up 0.2% w/w (YTD -12.1%). CF Broad Cap Index (Free Float Market Cap Weight) added less than 0.1% w/w (YTD -13.8%). Even compared to these lackluster showings, Diversified-weight tiers relatively underperformed, with CF Large Cap (Diversified Weight) down -0.8% w/w (YTD -20.4%) and CF Broad Cap Index (Diversified Weight) down -1.0% w/w (YTD -22.6%). Weekly returns therefore spanned -1.0% to 0.2% — a 1.25 pp range — with the ultra-cap tier beating the broad diversified cohort by 1.25 pp. The cross-tier profile hints at large-cap defensiveness, with downside concentrated in broader, more diversified baskets.
Classification Series Analysis
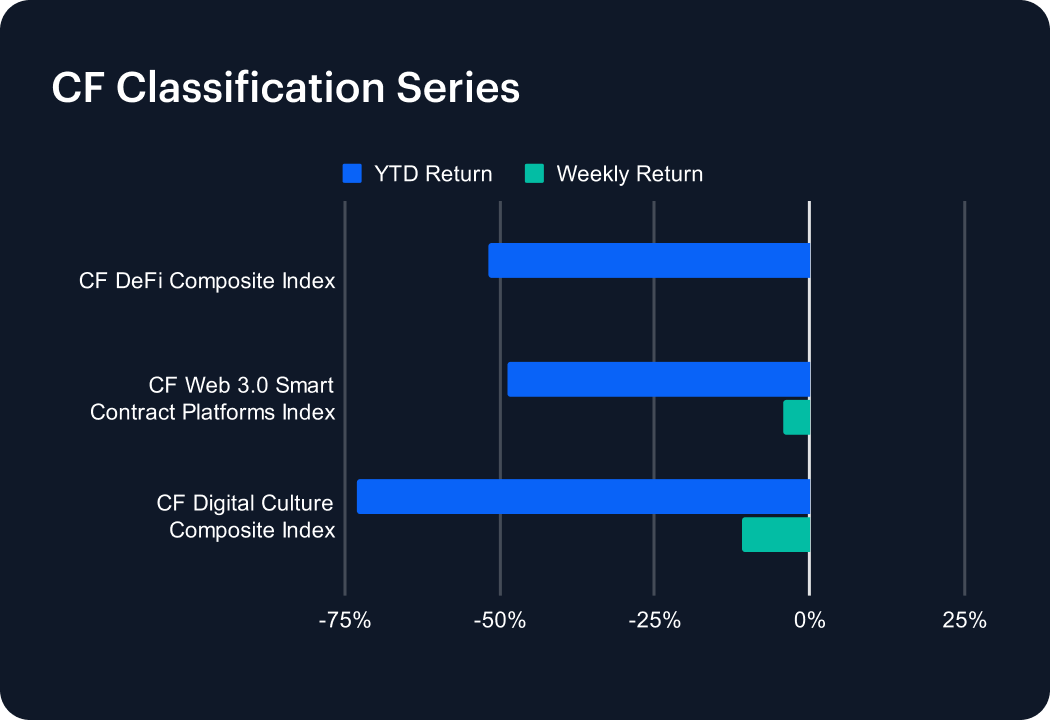
Within the thematically oriented CF Classification Series, the DeFi Composite Index essentially posted a flat return for the week, leaving its YTD result quite static at -51.8%. This compared with the Web 3.0 Smart Contract Platforms Index at -4.2% w/w (YTD -48.8%) and the Digital Culture Composite at -10.9% w/w (YTD -73.1%). DeFi therefore outperformed Culture by 10.9 pp on the week, and outperformed Web 3.0 by 4.2 pp. With Culture down 10.9% w/w and Web 3.0 down 4.2% w/w, the breadth of underperformance in higher-beta themes was decisive, while DeFi held unchanged. On a year-to-date basis, the dispersion is wider still, with Culture at -73.1% versus DeFi at -51.8%, a 21.4 pp gap. In context, BTC’s 0.9% w/w gain alongside Culture’s -10.9% w/w decline reinforces the view that returns were concentrated in the most liquid exposures, with thematic beta losing out.
Volatility Analysis
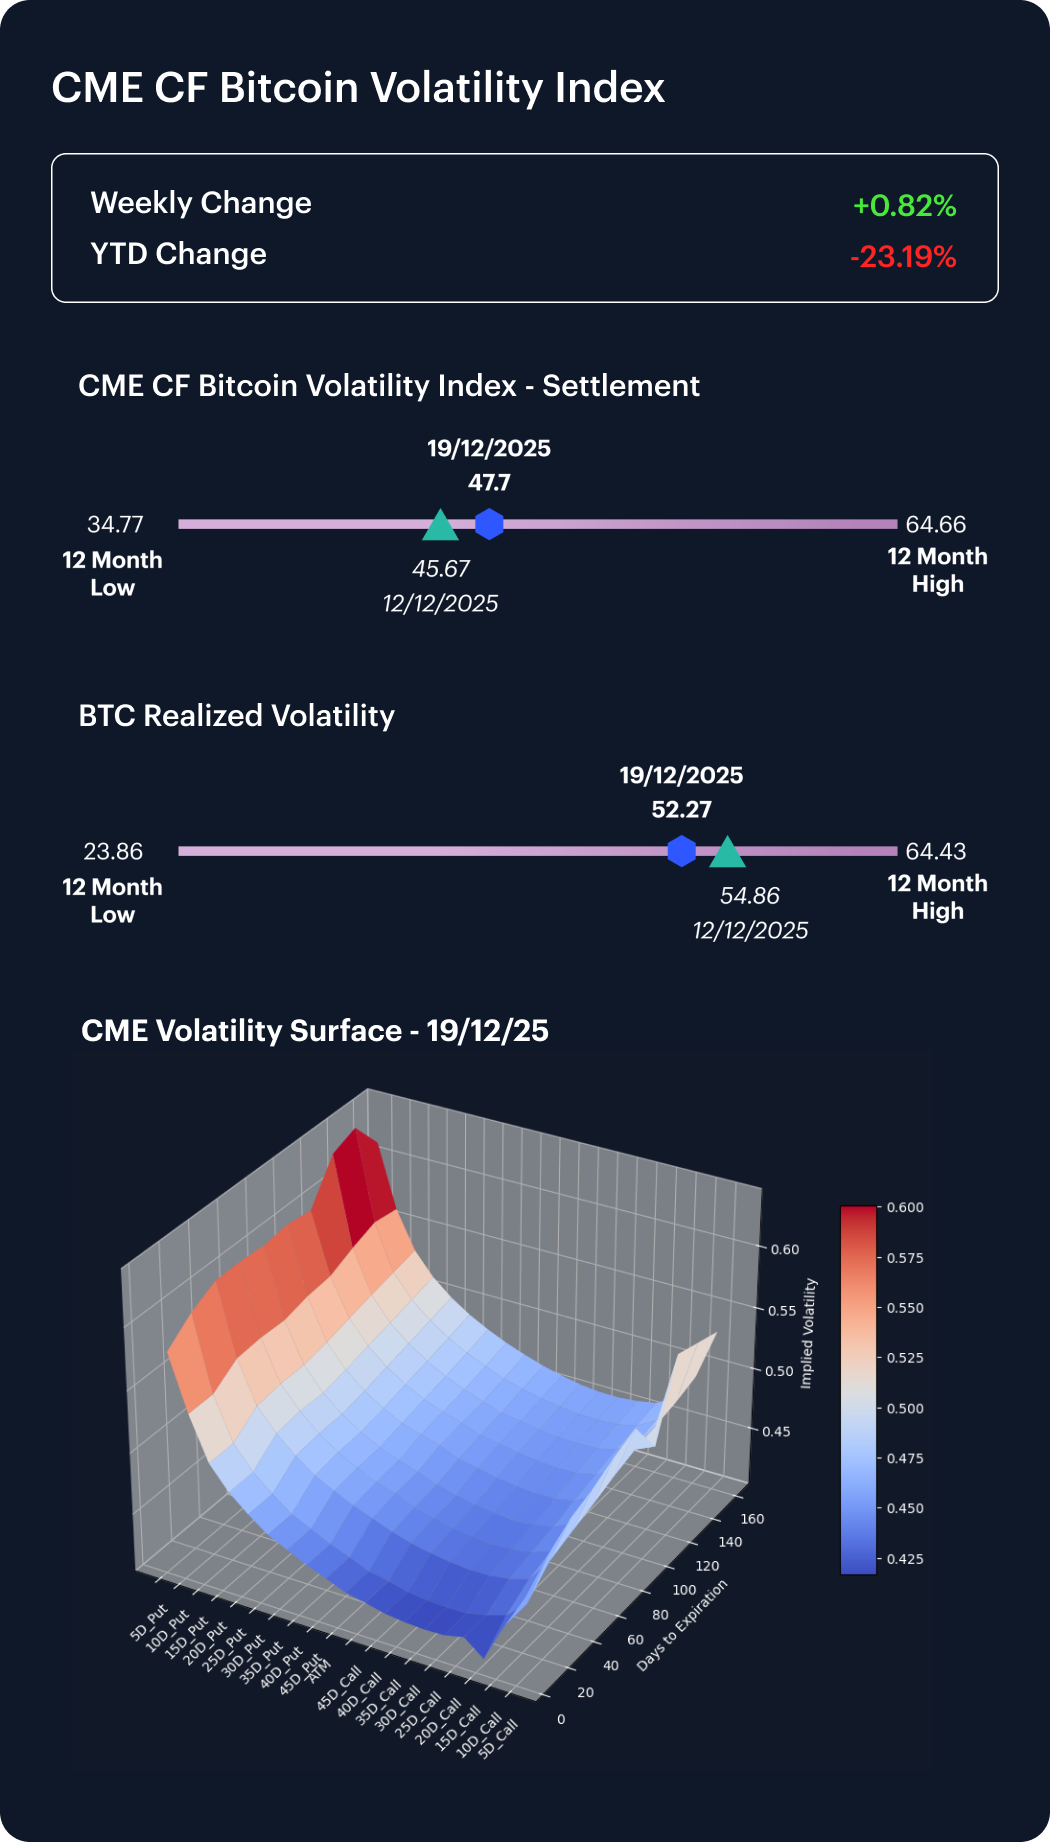
Bitcoin volatility was defined by a divergence between implied and realized measures. Our CME CF Bitcoin Volatility Index - Settlement (BVX) rose from 45.67 on December 12th, to 47.70 on December 19th (+2.03 vol. points), while BTC realized volatility fell from 54.86 to 52.27 (-2.59 vol points). At the end of the week, realized vol. at 52.27, sat 4.57 vol. points above implied at 47.70. That realized premium narrowed materially versus the prior week benchmark, moving from 9.19 vol. points (an implied–to-realized gap -9.19) to 4.57 vol points. The combination of higher implied (+2.03) and lower realized (-2.59) is consistent with a market that opted to pay up for forward protection, even as spot-level realized volatility compressed by 2.59 points. In level terms, BVX at 47.70 remains 12.93 points above the 12‑month low (34.77) and 16.96 points below the 12‑month high (64.66), while realized at 52.27 is 28.41 points above its 12‑month low (23.86).
Interest Rate Analysis
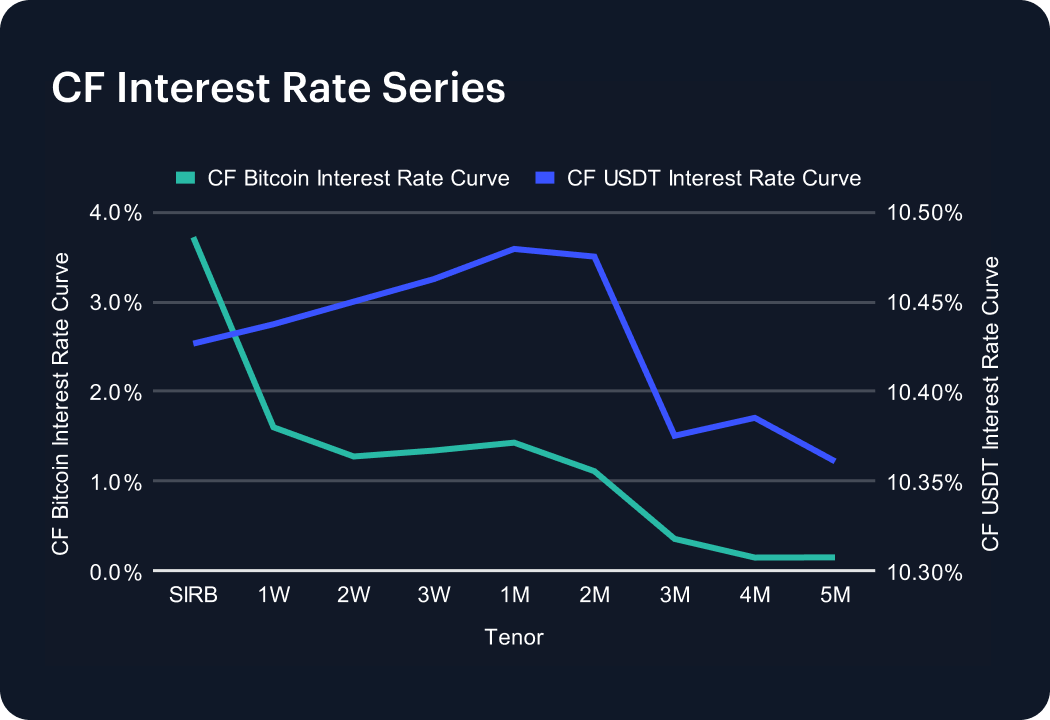
Funding conditions across the CF BIRC curves repriced sharply in USDT and more selectively in BTC. BTC’s session interest rate (SIRB) eased from 3.81% to 3.72% (-9.1 bps), while the 1W and 1M tenors moved from 0.55% and 0.94%, to 1.60% and 1.43% respectively (+105.2 and +49.2 bps). The BTC curve therefore remained inverted, with SIRB at 3.72% sitting 212.2 bps above 1W and 229.3 bps above 1M. In USDT, SIRB jumped from 6.59% to 10.43% (+383.8 bps), while 1W and 1M shifted from 6.58% and 6.57% respectively to 10.44% and 10.48% (+385.3 and +391.3 bps). Across BTC and USDT tenors, w/w changes spanned -48.5 to 393.6 bps, leaving USDT rates roughly 884 bps above BTC at 1W (10.44% versus 1.60%). This widening cross-currency spread is the dominant rates signal for the past week.
Factors Analysis
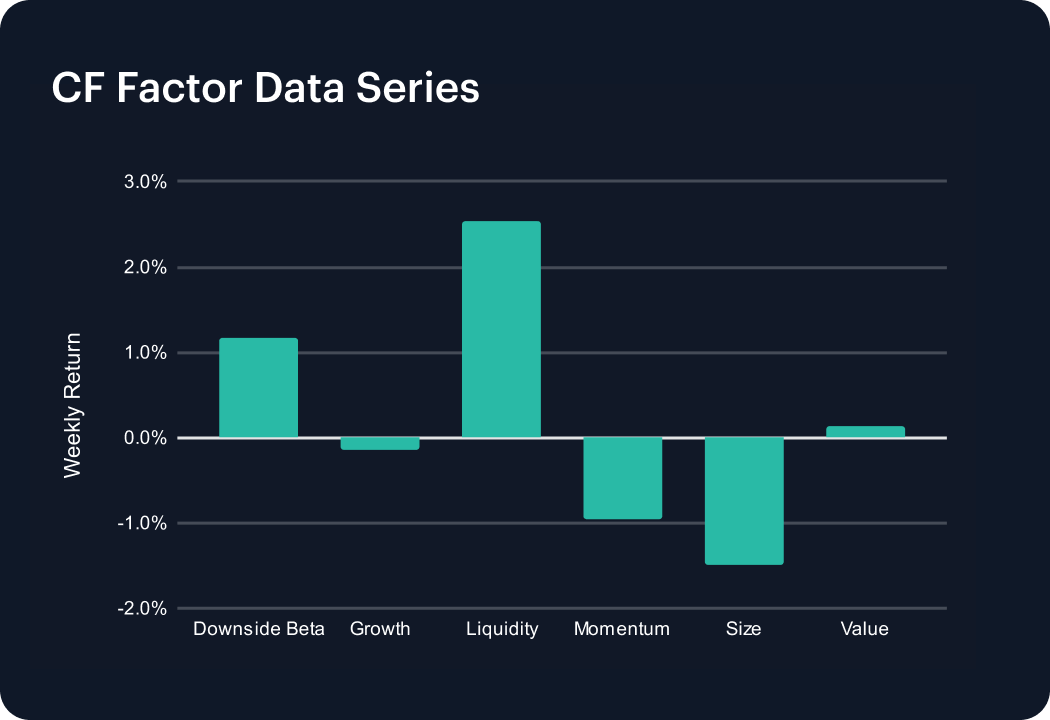
Factor returns rotated meaningfully, with Liquidity leading at 2.5% this week versus -0.6% in the prior week, a 3.16 pp swing. Downside Beta also improved, printing 1.2% versus 0.1% previously (1.05 pp). Momentum moved from 0.8% to -1.0% (-1.74 pp), while Growth remained mildly negative at -0.1% after -0.2%. Size stayed weak at -1.5% (prior -1.3%), and Value held at 0.1% (prior 0.1%). Across our factor set then, weekly returns ranged from -1.5% to 2.5%, a 4.03 pp span. The combination of positive Liquidity (+2.5%) and negative Size (-1.5%) is consistent with flow concentrating in larger, more liquid exposures eschewing, for now, smaller, higher-volatility constituents. The read-through matches the cap-tier split, where Ultra Cap 5 was up 0.2% w/w and Broad Cap (Diversified) was down -1.0% w/w. That was an equity-like 1.25 pp gap that mirrors the 1.5% Size headwind.
Due to seasonal holidays, the next Weekly Index Highlights edition will be published on Monday, January 12th, 2026.
The information contained within is for educational and informational purposes ONLY. It is not intended nor should it be considered an invitation or inducement to buy or sell any of the underlying instruments cited including but not limited to cryptoassets, financial instruments or any instruments that reference any index provided by CF Benchmarks Ltd. This communication is not intended to persuade or incite you to buy or sell security or securities noted within. Any commentary provided is the opinion of the author and should not be considered a personalised recommendation. Please contact your financial adviser or professional before making an investment decision.
Note: Some of the underlying instruments cited within this material may be restricted to certain customer categories in certain jurisdictions.
Changes to the Token Market Price Benchmarks Series - Market Prices – 21 July 2026
The Administrator has confirmed changes to the Token Market Price Family for the period 14 July 2026 to 21 July 2026.

CF Benchmarks
Softer CPI Reprices July Hike Risk & Lifts Digital Assets
Digital assets extended their recovery over the past week as cooler US inflation prints repriced Fed expectations; the bid was broad across the large cap indices, growth factor leadership returned, stablecoin funding repriced lower, and stress stayed isolated in names hit by token-specific news.
Mark Pilipczuk
Notice of the Demising of CF Dai-Dollar Settlement Price and Spot Rate
The Administrator announces that it will demise the CF Dai-Dollar Settlement Price (DAIUSD_RR) and CF Dai-Dollar Spot Rate (DAIUSD_RTI) which are members of the CF Digital Asset Index Family.
CF Benchmarks
By clicking Accept, you consent to CF Benchmarks's use of cookies.
Visit Cookie Settings to learn how CF Benchmarks uses cookies and to adjust your preferences.