
Aug 11, 2025
Weekly Index Highlights, August 11, 2025
Market Performance Update
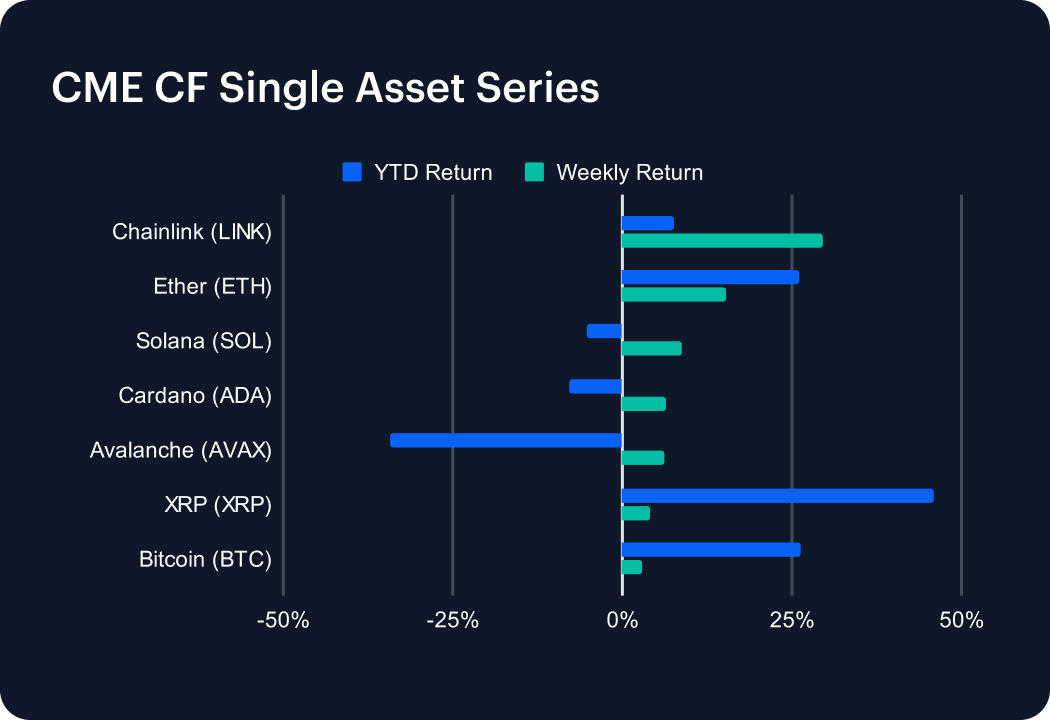
In a dramatic turnaround from the recent pullback, last week saw a broad rally across major tokens, led by Chainlink’s blistering 29.55% surge. Ethereum followed with a strong 15.35% advance, lifting its year-to-date return to 26.10%. Solana rose 8.70%, narrowing its 2025 loss to 5.24%, while Cardano climbed 6.34%, trimming its YTD slide to 7.86%. Avalanche notched a 6.27% gain but still lags with a 34.23% decline YTD. XRP added 4.20%, boosting its 2025 return to an impressive 46.01%. Bitcoin continued to show strength, advancing 3.03% and nudging its year-to-date gain to 26.29%. Altcoins’ outperformance indicates that investor appetite for risk remains strong in the second half of the year .
Sector Analysis
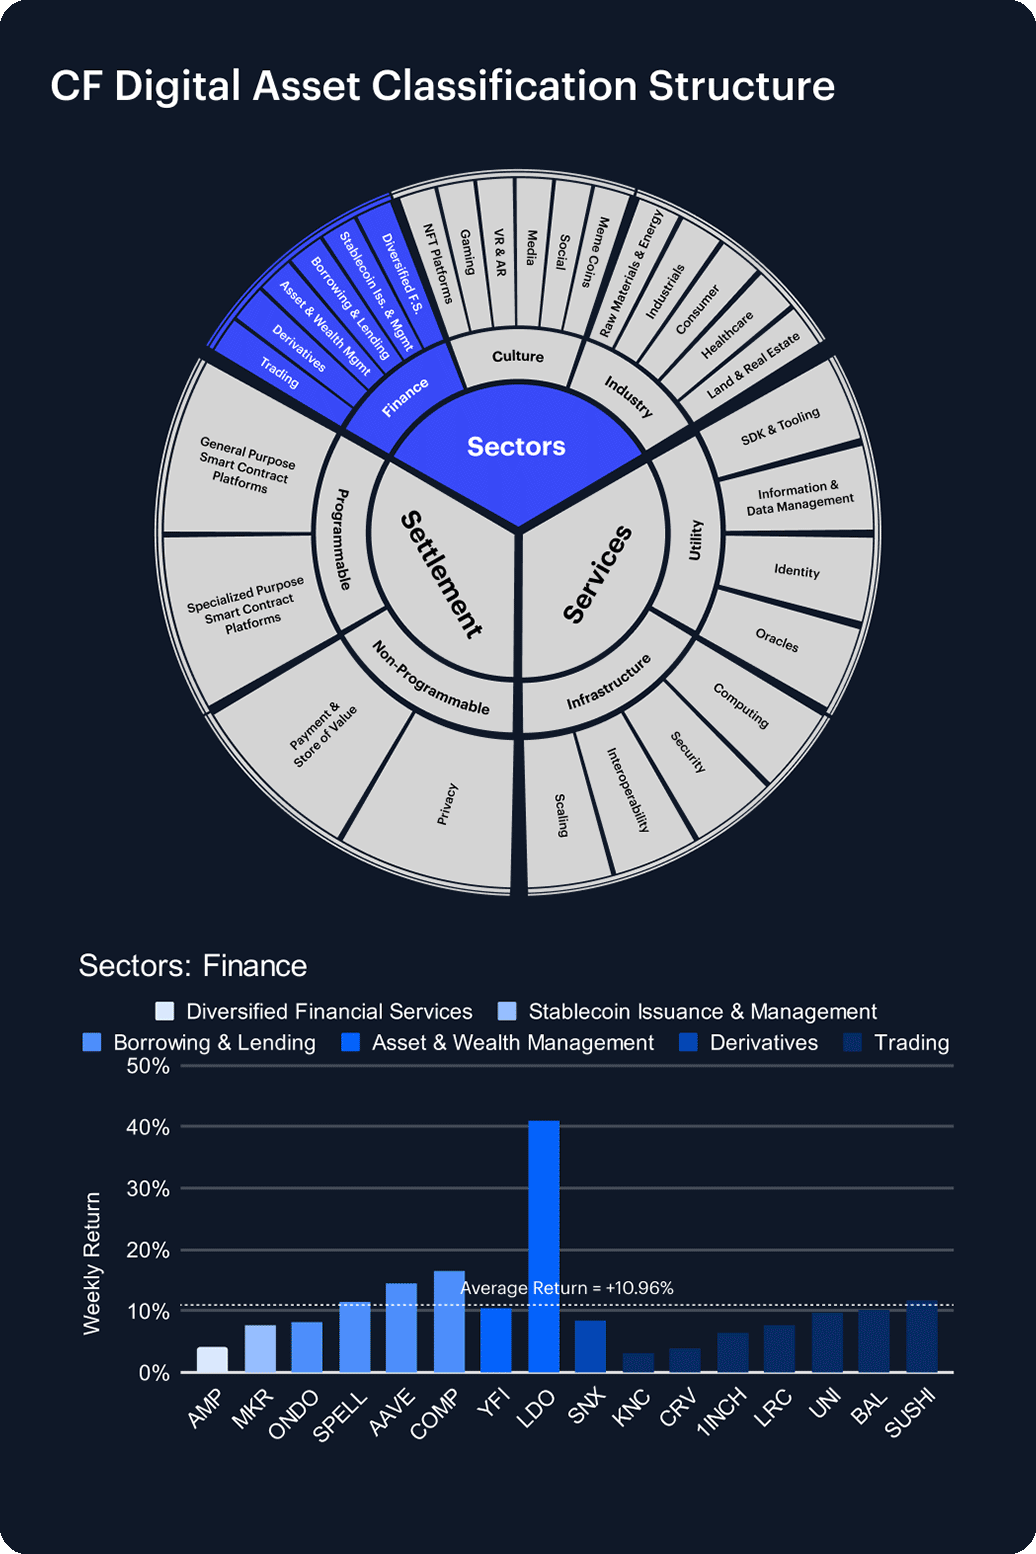
The DACS segments pivoted decisively into the green, powered by eye-catching moves in Asset & Wealth Management and Utility. Lido DAO (LDO) rocketed 41.05%, quadrupling the 10.96% average in the Finance sub-category and topping the weekly leaderboard, while oracle bellwether Chainlink (LINK) vaulted 29.55%, more than doubling the Services average of 11.80%. In Programmable Settlement, Ethereum’s 15.35% jump outpaced its platform cohort (8.29%), and scaling token POL led Infrastructure with a 17.34% gain. Culture also participated, as gaming token Immutable X (IMX) surged 13.96% versus a 7.82% peer average. Laggards were few: meme coins RARI (-0.65%) and BONK (-0.43%) slipped, while non-programmable stalwart BCH (+0.16%) barely inched higher.
CF Staking Series
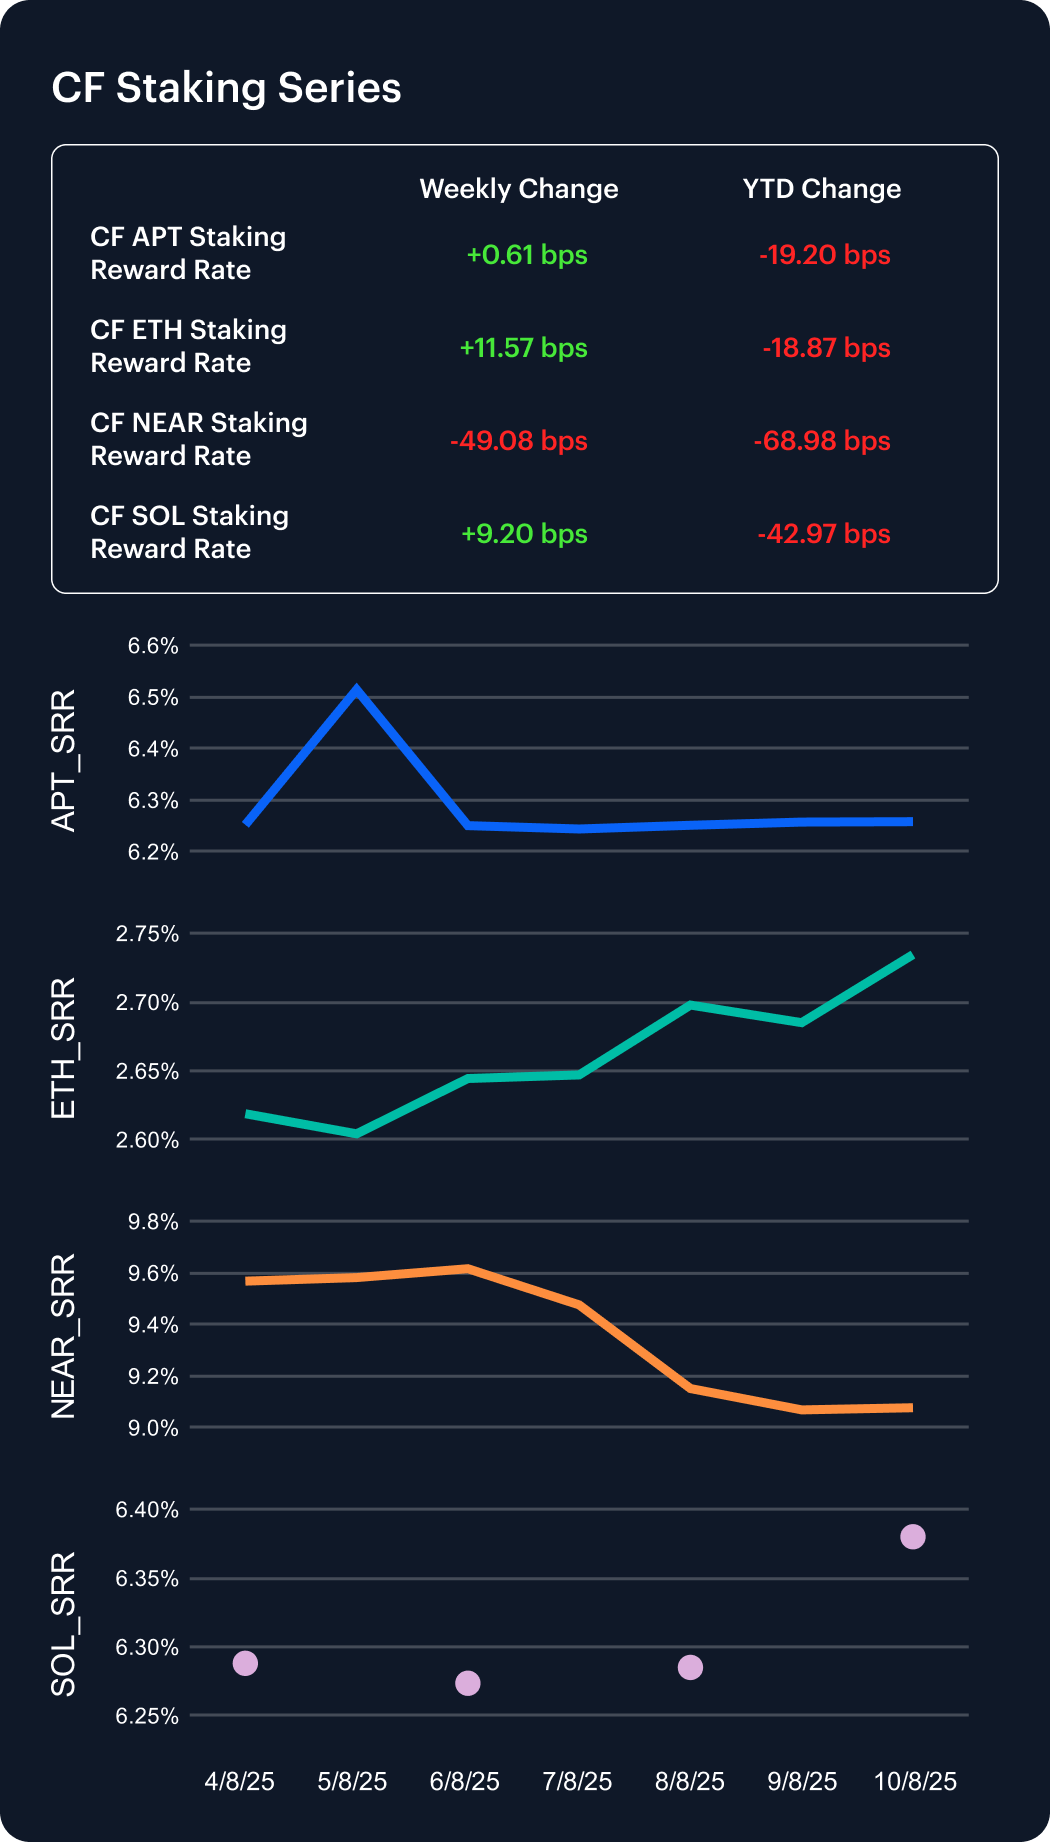
Staking rewards continued to fluctuate last week, as price action influenced demand for blockspace. Ether led the pack, with its annualized reward rate jumping 4.42% to 2.73%, narrowing its 2025 decline to 6.46%. Solana followed with a 1.46% uptick to 6.38%, shaving its YTD drop to 6.31%. Aptos inched up 0.10% to 6.26%, making it the most resilient on a year-to-date basis (–2.98%). In stark contrast, NEAR’s yield plunged 5.13% to 9.08%, widening its YTD loss to 7.06% despite remaining the highest-yielding chain. These divergent moves underscore shifting staking appetites, network inflation dynamics, and investor confidence differentials across the ecosystem.
Market Cap Index Performance
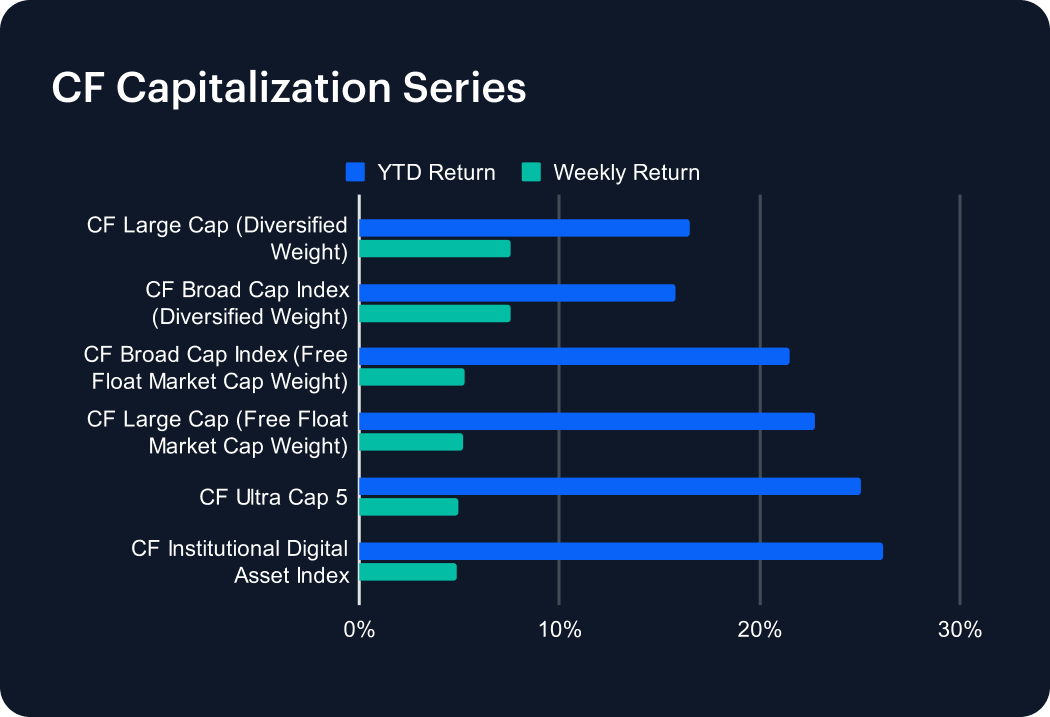
Last week marked a continuation in this year’s rally for the CF Capitalization Series, led by the diversified-weight cohorts. The CF Large Cap (Diversified Weight) index surged 7.58%, pushing its year-to-date return to 16.52%, with the CF Broad Cap (Diversified Weight) close behind at +7.57% (YTD 15.82%). Free-float strategies also enjoyed gains: the CF Broad Cap Index climbed 5.24%, lifting its YTD performance to 21.47%, while the CF Large Cap (Free Float) rose 5.17%, taking its 2025 advance to 22.79%. Among the marquee benchmarks, CF Ultra Cap 5 added 4.97%, bringing its YTD return to 25.07%, and the CF Institutional Digital Asset Index rallied 4.86%, extending its gain to 26.15% year to date. This rally underscores renewed strength in large-cap tokens as risk appetite remains strong.
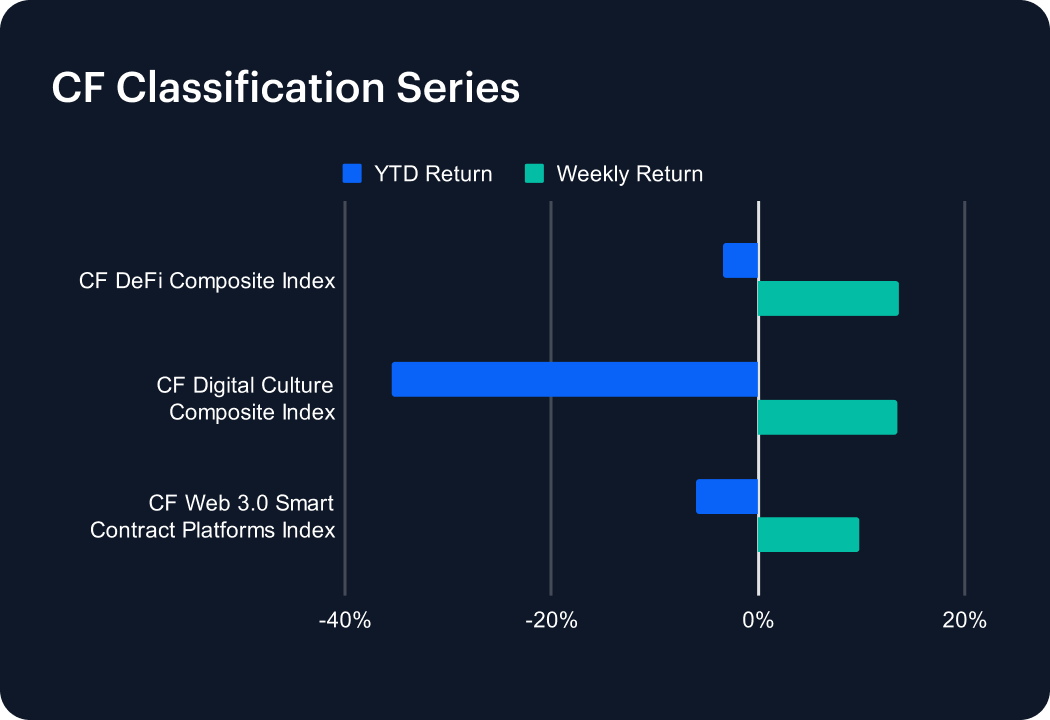
Classification Series Analysis
Last week brought a strong rebound across the CF Classification Series, with two of the thematic indicies posting double-digit gains. The CF DeFi Composite Index led the charge, jumping 13.64% and narrowing its year-to-date deficit to 3.40%. The CF Digital Culture Composite Index followed closely, surging 13.51% but still down 35.55% in 2025. Meanwhile, the CF Web 3.0 Smart Contract Platforms Index climbed 9.79%, trimming its YTD loss to 6.05%. Although this snapback underscores renewed investor interest in high-beta themes, all three remain well below their early-January highs, setting the stage for a challenging path back to previous peaks.
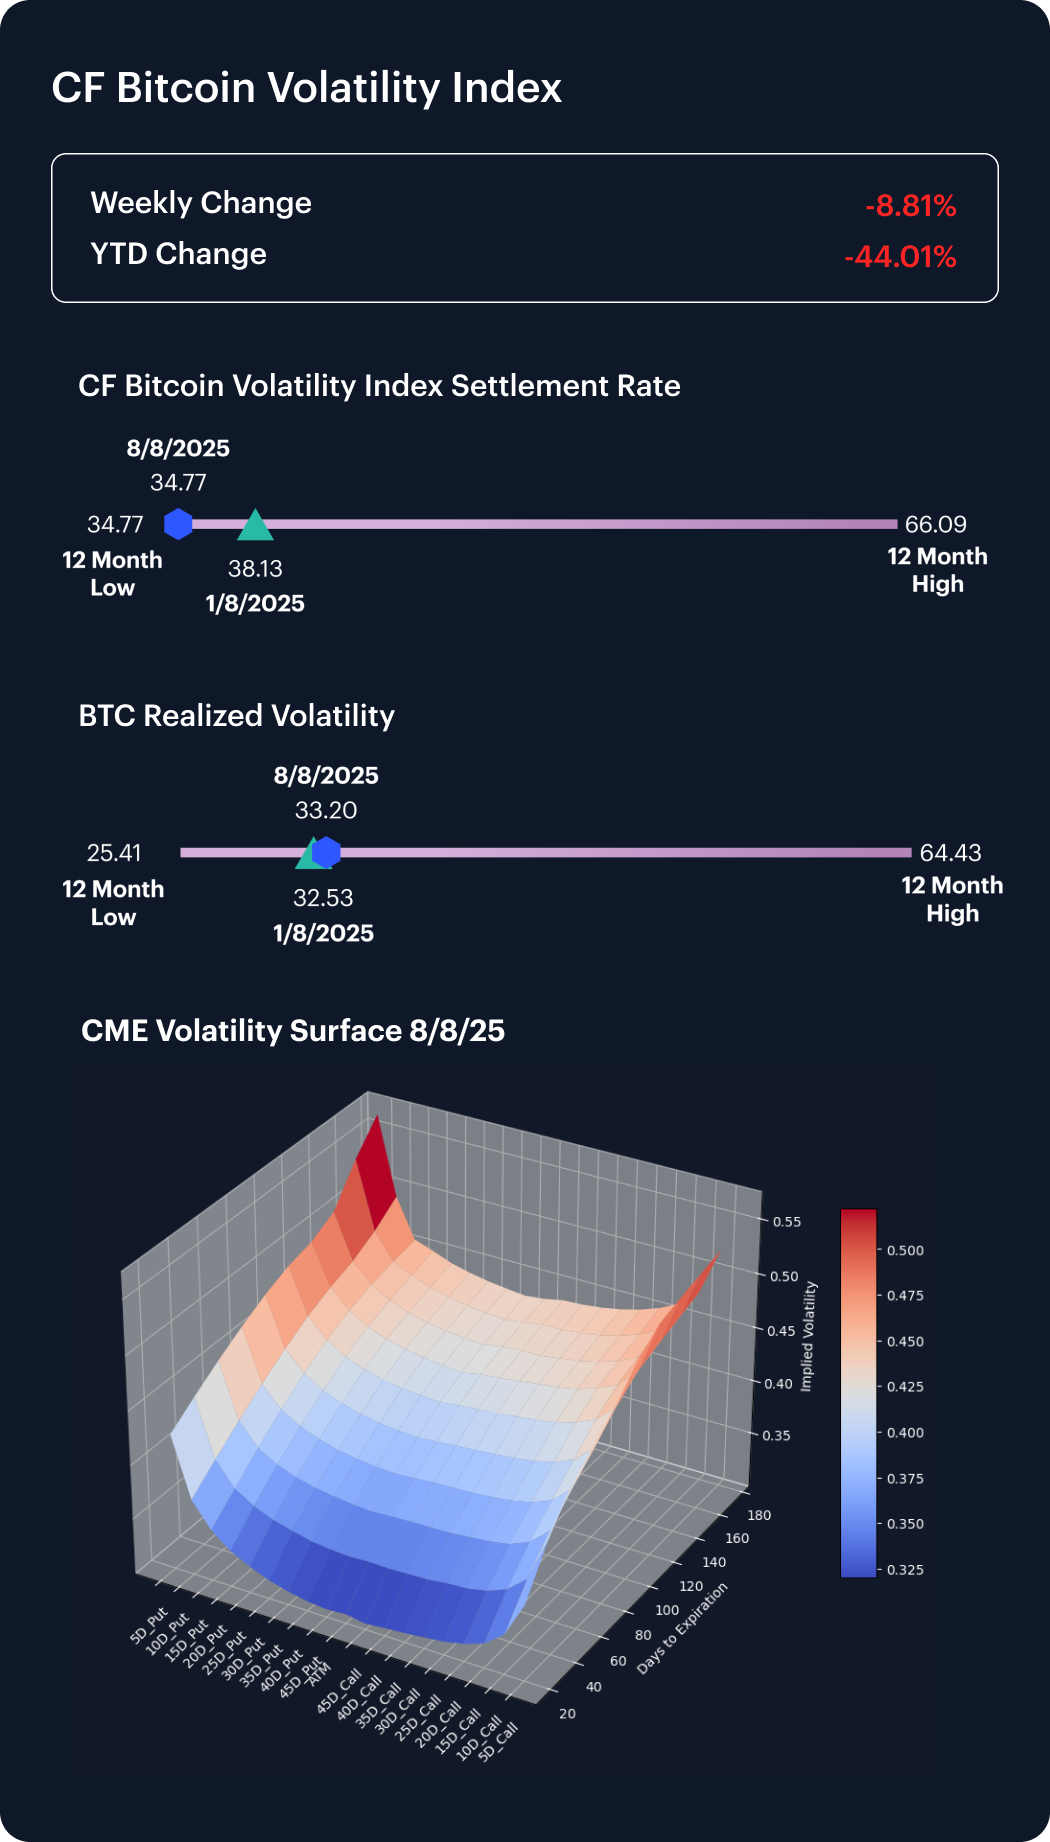
Volatility
Last week saw the CF Bitcoin Volatility Index Settlement Rate (BVXS) plunge 8.81%, sliding from 38.13 to a 12-month low of 34.77 and now sitting 44.01% below its January 1 level. Realized volatility climbed to 33.20 from 32.53 a week earlier, underscoring persistent spot-driven swings despite muted option premia. On the volatility surface, skew remained modestly positive and flat across delta buckets, indicating balanced demand for calls and puts. Strikingly, long-dated options have seen implied volatility rise this week—both calls and puts now exhibit the highest levels on the curve—while short-dated tenors (under 60 days) remain the softest. This divergence highlights growing tail-risk hedging in longer maturities alongside elevated directional exposure.
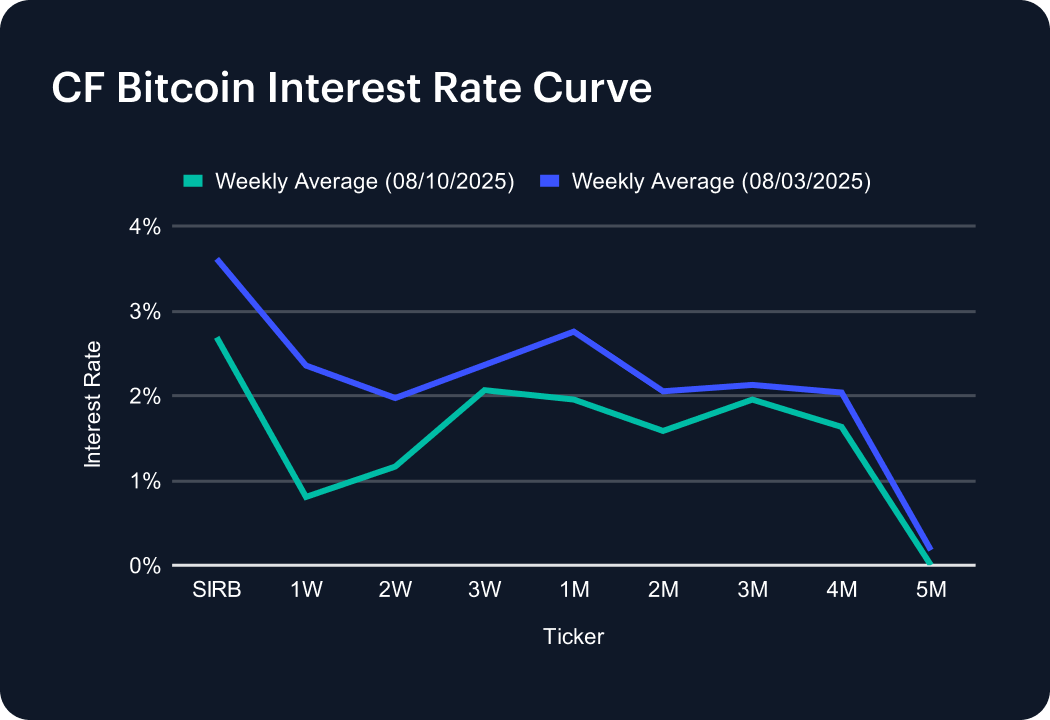
Interest Rate Analysis
The CF Bitcoin Interest Rate Curve flattened sharply last week as funding across all tenors plunged. The Short-Term Interest Rate Benchmark eased to 2.69% from 3.61%, anchoring the move lower. One-week funding collapsed to 0.81% (–154 bps), with two- and three-week rates sliding to 1.16% (–81 bps) and 2.06% (–30 bps), respectively. One-month dipped to 1.95% (–80 bps). Mid-curve tenors saw two-month at 1.58% (–47 bps), three-month at 1.95% (–18 bps), and four-month at 1.63% (–41 bps). Even five-month funding fell to 0.00% (–18 bps). These across-the-board declines underscore waning short-term demand and a pronounced curve flattening.
The information contained within is for educational and informational purposes ONLY. It is not intended nor should it be considered an invitation or inducement to buy or sell any of the underlying instruments cited including but not limited to cryptoassets, financial instruments or any instruments that reference any index provided by CF Benchmarks Ltd. This communication is not intended to persuade or incite you to buy or sell security or securities noted within. Any commentary provided is the opinion of the author and should not be considered a personalised recommendation. Please contact your financial adviser or professional before making an investment decision.
Note: Some of the underlying instruments cited within this material may be restricted to certain customer categories in certain jurisdictions.
Changes to the Token Market Price Benchmarks Series - Market Prices – 21 July 2026
The Administrator has confirmed changes to the Token Market Price Family for the period 14 July 2026 to 21 July 2026.

CF Benchmarks
Softer CPI Reprices July Hike Risk & Lifts Digital Assets
Digital assets extended their recovery over the past week as cooler US inflation prints repriced Fed expectations; the bid was broad across the large cap indices, growth factor leadership returned, stablecoin funding repriced lower, and stress stayed isolated in names hit by token-specific news.
Mark Pilipczuk
Notice of the Demising of CF Dai-Dollar Settlement Price and Spot Rate
The Administrator announces that it will demise the CF Dai-Dollar Settlement Price (DAIUSD_RR) and CF Dai-Dollar Spot Rate (DAIUSD_RTI) which are members of the CF Digital Asset Index Family.
CF Benchmarks
By clicking Accept, you consent to CF Benchmarks's use of cookies.
Visit Cookie Settings to learn how CF Benchmarks uses cookies and to adjust your preferences.