
Aug 10, 2025
CF Benchmarks Newsletter Issue 88
- SEC's In-Kind approval is as pivotal as it seems, and then some
- ETH/BTC ratio back in focus as Ether eyes record highs
- CME Group's Aye Soe, CFA, on ETH/BTC Ratio futures
Kindled
The SEC's approval of in-kind creation and redemption for a broad swathe of crypto ETFs is as pivotal as it seems ... and more far-reaching than it's possible to estimate.
Given how fast U.S. Bitcoin ETFs collectively became the most successful set of ETF debuts in the history of those products, before last week’s SEC approval of in-kind creation and redemption, some observers have suggested the now-lapsed prohibition had little-to-no bearing on demand.
The breakneck pace of asset-gathering by iShares Bitcoin ETF Trust (IBIT) helps make the case in point.
IBIT hit its $50 billion milestone in December 2024, 227 trading days after launch; the fastest ETF to reach that milestone in the 32-year history of ETFs.
The fund subsequently exceeded $70 billion in assets under management (AuM) in 341 trading days, more than 5× faster than SPDR Gold Shares (GLD), and compared to the 1,691 days (more than 4½ years) SPDR S&P 500 ETF Trust (SPY) took to get there.
IBIT and the rest
Simultaneously though, IBIT is also where the claim that crypto ETFs don’t truly need in-kind to thrive, falls flat - because IBIT is a clear outlier.
IBIT’s share of total U.S. spot Bitcoin AuM is currently close to 60%. It was the sole spot BTC ETF with AuM above $50bn by mid-2025.
Both Fidelity’s FBTC and Grayscale’s ‘mini’ ETF (ticker: BTC) (a partial conversion, seed funded with 10% of GBTC holdings) trail in the $18bn-$20bn range. The remainder of U.S. BTC ETFs form a long thin tail; each with AuM equating to fractions of the leaders’ net assets.
In fact, most IBIT peers by product class are nowhere close to being peers by size, liquidity or broader investor recognition.
In-Kind sharpens IBIT's edge further
In other words, while the spot Bitcoin ETF category as a whole has delivered unprecedented growth—faster than gold or equity ETF launches—its success is highly concentrated, chiefly in IBIT.
BlackRock’s iShares Bitcoin Trust ETF has enjoyed obvious advantages related to key strengths of the iShares franchise that outweighed concerns about cash creation and redemption.
These strengths include the market’s longstanding and deep trust of the brand, the scale of its distribution network, and more; increasing the probability that it is IBIT that is selected for model-portfolio inclusion as Bitcoin allocations increase.
Now, IBIT’s headline advantages will soon be bolstered by the newly granted permission to create/redeem in-kind.
This means that despite the same approval implicitly having been granted to all existing Bitcoin and Ether spot ETFs (as we outline lower down) IBIT’s edge will persist.
In-Kind ticks a critical box
So, in itself, the newly approved permission to create/redeem crypto ETF shares in-kind will not necessarily help fix the uneven distribution of BTC ETF assets among issuers.
But it can help level the playing field, somewhat.
Mandates that unconditionally filter funds redeeming in cash now have a wider range of vehicles available to choose from – including the more crypto-aligned, or crypto native issuers, whose specialist expertise and track record may appeal to certain investors.
As well, in-kind permission helps the case for ETFs investing in assets without the broadly recognized and widely disseminated narratives of Bitcoin, Ether and other large caps, where the impediment of having to convert into cash might conceivably have been an important decider for some investors weighing whether to allocate or not.
SEC's In-Kind Crypto Approvals - key details

What and Who were approved?
- The SEC structured the approval with a coordinated, class-wide approach, authorizing in-kind creations and redemptions for all spot Bitcoin and Ethereum ETFs with pending rule-change applications.
- Filings by individual Self Regulating Organizations were bundled under a single Order Granting Accelerated Approval (34‑103571), and each applicant’s file (e.g., SR‑CboeBZX‑2025‑010, SR‑NYSEArca‑2025‑38, etc.) was amended and approved under the same framework
- Every issuer for whom an in-kind proposed rule change was filed, received approval—including BlackRock, Bitwise, Franklin Templeton, ARK 21Shares, WisdomTree, Fidelity, and Invesco
- However, there is no indication the SEC issued in-kind authority to issuers that had not filed proposed rule-change applications
- As a result, approval is only explicitly effective for the specific issuers approved. Issuers who did not file must still do so, in order to transition to in-kind
- Still, it's likely new applications will be rubber-stamped as a formality, given precedent
Benefits
Below, we outline the typical efficiencies and optimizations stemming from in-kind creation and redemption, plus longer-term positive implications for crypto ETFs.
For institutions: investors and authorized participants (APs)
- Operational efficiency: Removing the need to liquidate into fiat means reduced transaction costs; less scope for slippage
- Tax optimization: Capital gains can be deferred at redemption; marginal impact of pass-through taxation avoided
- Tighter spreads/tracking: Both are already tight across most funds, but in-kind implies improved robustness to market conditions; increased arbitrage precision; more efficient order management
- Institutional alignment: Alignment with physical commodity funds provides familiarity and optimized operational rails
For the broader crypto market
- Deeper liquidity: Authorized Participants can add/remove BTC or ETH directly from ETF custody, enhancing on-chain liquidity buffers
- Precedent for altcoin ETFs: When additional altcoins ETFs are approved (e.g., those investing in XRP, Solana, and Cardano) they are now expected to launch with in-kind mechanisms from day one
- Regulatory signal: By approving In-Kind, SEC chair Paul Atkins, Commissioner Uyeda, and SEC staff have confirmed a more market-aligned, merit-based stance on crypto regulation, with implications for reviews of other critical matters on which decisions are near-imminent
Ethereum revival spotlights ETH/BTC ratio
The factors fueling Ether's price revival that we outlined in the prior edition continue to propel the second-largest digital asset on the upward trajectory it's been on for several weeks. Institutional practitioners even suggest Ether may now have sufficient impetus to take ETH/USD to new record peaks.
ETHBTC Update, an ETH/USD ATH is very much in play in the coming weeks. pic.twitter.com/OlLRC23KZe
— Mark Pilipczuk (@MarkPilipczuk) August 8, 2025
This momentum is reflected by ETH's most institutional proxy, front-month CME Ether futures, which settle to our regulated CME CF Ether Dollar Reference Rate, closing on Friday August 8th at $4,087.5; their strongest level since December 2024.
ETH/BTC back in focus
Meanwhile, Ethereum's recently bolstered investment case has returned the spotlight to crypto's most closely watched ratio, Ether vs. Bitcoin, the simplest parametric gauge of sentiment on Ethereum's value relative to Bitcoin's.
The ratio can provide a finer nuance of prevailing sentiment, and, potentially, can serve as a near-term indicator of relative valuation, when both assets are trending in the same direction.
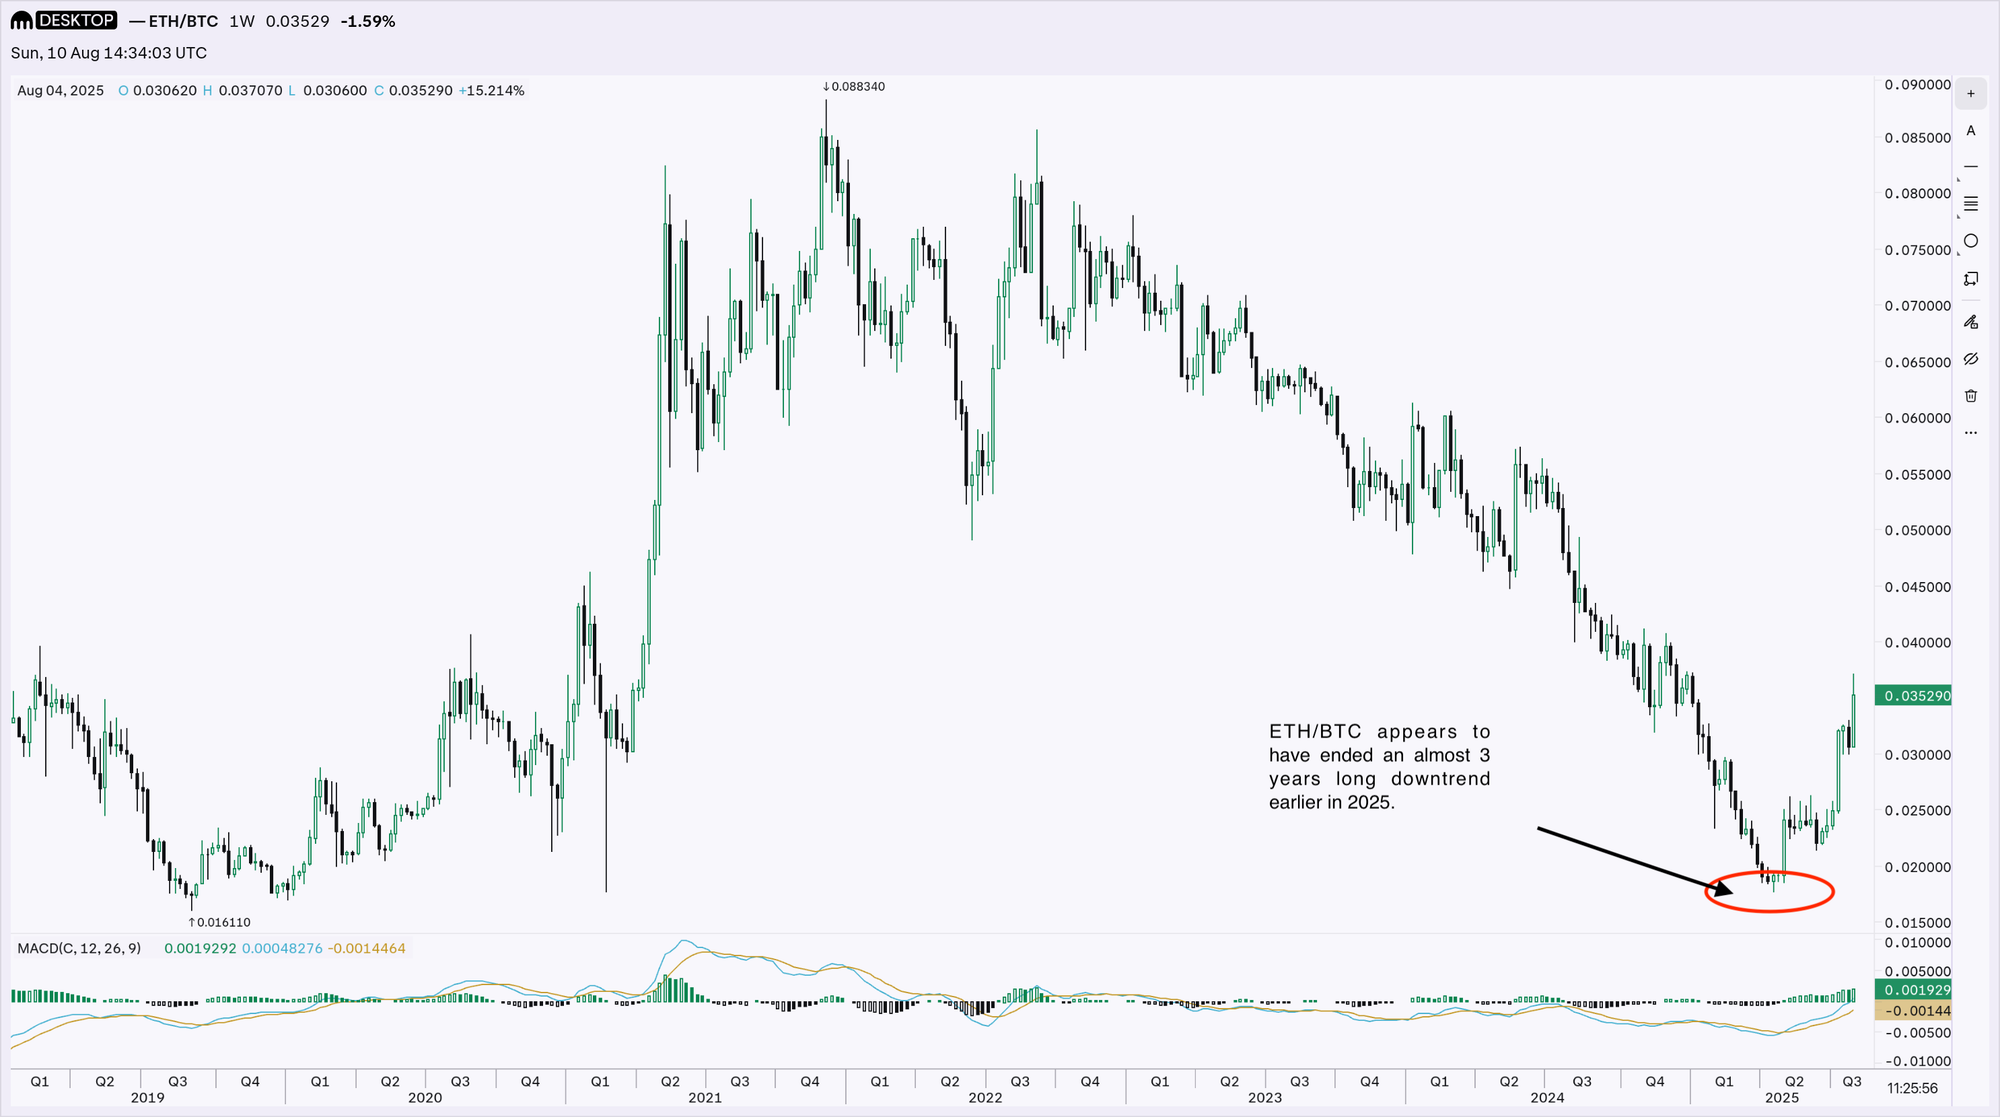
Additionally, because crypto participants have traditionally expressed the price of altcoins in terms of Bitcoin, Ethereum, as the leading altcoin, remains quite a reliable indicator of sentiment on the broader altcoin market and layer 2 protocols, as well as more specifically, on DeFi.
ETH/BTC ratio - Relative Value and Opportunity
Below, we summarize a perspective on the ETH/BTC ratio, by Aye Soe, CFA, Senior Director of Financial Research and Product Development at CME Group

With the ETH/BTC ratio, like Ether itself, staying buoyed near multi-month highs for several weeks, there's a timely opportunity to explore its institutional ramifications.
To that end, CF Benchmarks is delighted to spotlight a recent article by Aye Soe, CFA, Senior Director of Financial Research and Product Development at our largest and longest-standing partner, CME Group.
Titled "Relative Value and Momentum Investment Opportunities in Ether/Bitcoin Pair", the article summarizes and assesses key ETH/BTC phases in the context of CME Group's Ether/Bitcoin Ratio futures contract, a product that provides institutional participants with a streamlined and efficient means of expressing views on the ETH/BTC relationship.
These futures are cash-settled, based on a daily ratio derived from our CME CF Ether-Dollar Reference Rate (ETHUSD_RR) divided by our CME CF Bitcoin Reference Rate (BRR). Both rates are regulated benchmarks, under the UK Benchmarks Regulation framework, assuring institutions of the highest possible standards of market integrity, replicability and representatives, as the basis of participation at scale.
Soe notes that over time, the ETH/BTC ratio has shown significant variability, capturing the different cycles of market leadership between the two assets.
As an illustration of this variability over time, the graphic below, based on data compiled by Soe, and published in her article, highlights some key snapshots of the ratio since inception.
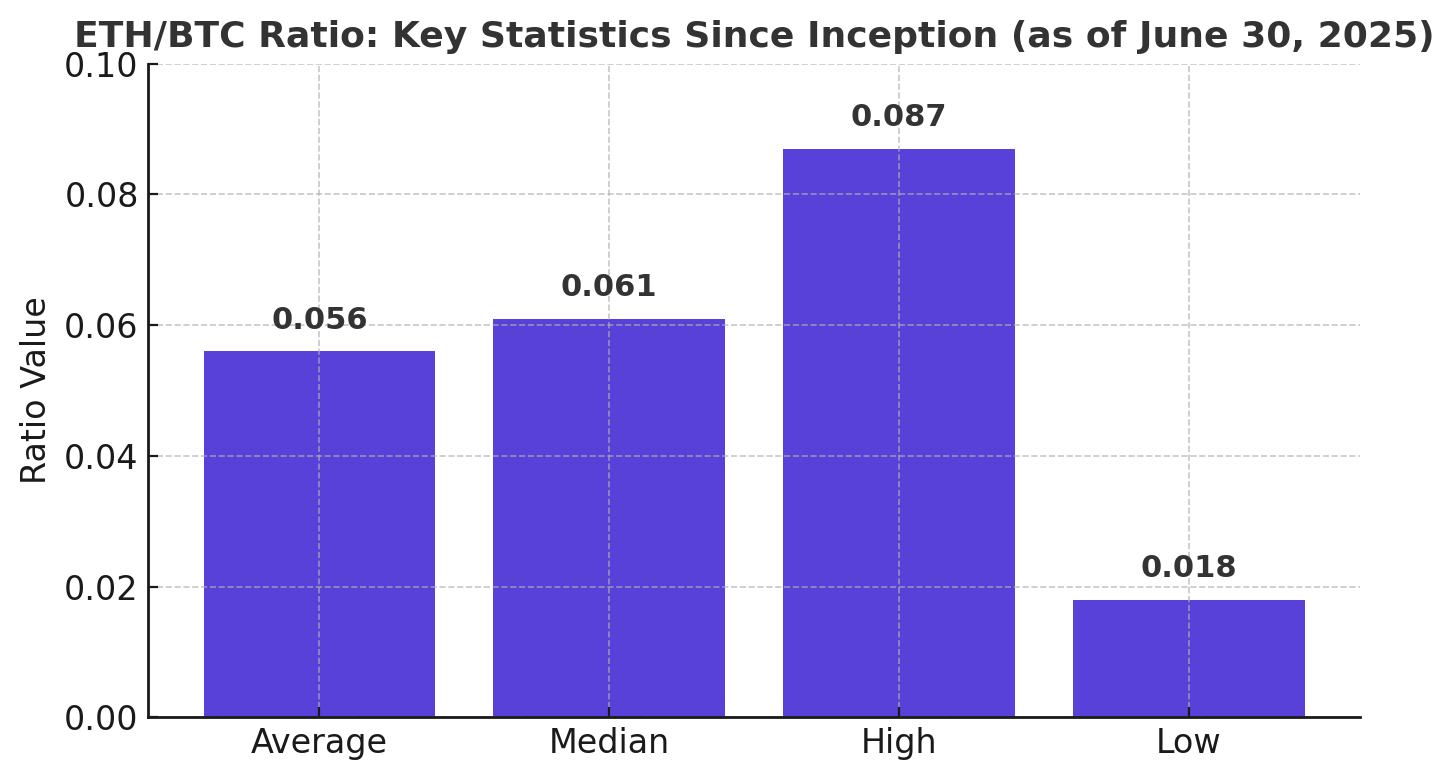
Notably, after reaching new lows earlier in 2025 (as low as 0.018), the ratio has recently rebounded and risen above its 60-day moving average.
Such a recovery is typically interpreted as a sign that Ether could be primed for further appreciation, especially after an extended period of underperformance relative to Bitcoin.
Trading the Ether/Bitcoin Ratio
Soe goes on to suggest that CME's Ether/Bitcoin futures offer a streamlined, cost-effective and precise way for institutions to take directional or non-directional positions in support of investment or trading objectives, based on their current assessment of the relative strength of Ether and Bitcoin.
“Rather than executing two separate trades to realize the spread, the ratio is a package solution that captures both relative value and momentum opportunities embedded in the currency pair”.
Aye Soe, CFA, in "Relative Value and Momentum Investment Opportunities in Ether/Bitcoin Pair"
Timely opportunities
With the Ether/Bitcoin narrative currently central once again, as markets reassess the risk/reward balance between the two dominant cryptocurrencies, current conditions offer a timely opportunity for institutions seeking exposure or hedging strategies in this pair, to explore the ratio in the context of CME Group's ETH/BTC Ratio futures, and their underlying settlement rates, administered by CF Benchmarks.
Click the button below for the full analysis.
Head to the CME Ether/Bitcoin Ratio futures product page to explore its key features, contract specs, FAQs, and more.
Explore CF Benchmarks' CME CF Ether-Bitcoin Reference Rate (ETHBTC_USDRR)
The information contained within is for educational and informational purposes ONLY. It is not intended nor should it be considered an invitation or inducement to buy or sell any of the underlying instruments cited including but not limited to cryptoassets, financial instruments or any instruments that reference any index provided by CF Benchmarks Ltd. This communication is not intended to persuade or incite you to buy or sell security or securities noted within. Any commentary provided is the opinion of the author and should not be considered a personalised recommendation. Please contact your financial adviser or professional before making an investment decision.
Note: Some of the underlying instruments cited within this material may be restricted to certain customer categories in certain jurisdictions.
Changes to the Token Market Price Benchmarks Series - Market Prices – 21 July 2026
The Administrator has confirmed changes to the Token Market Price Family for the period 14 July 2026 to 21 July 2026.

CF Benchmarks
Softer CPI Reprices July Hike Risk & Lifts Digital Assets
Digital assets extended their recovery over the past week as cooler US inflation prints repriced Fed expectations; the bid was broad across the large cap indices, growth factor leadership returned, stablecoin funding repriced lower, and stress stayed isolated in names hit by token-specific news.
Mark Pilipczuk
Notice of the Demising of CF Dai-Dollar Settlement Price and Spot Rate
The Administrator announces that it will demise the CF Dai-Dollar Settlement Price (DAIUSD_RR) and CF Dai-Dollar Spot Rate (DAIUSD_RTI) which are members of the CF Digital Asset Index Family.
CF Benchmarks
By clicking Accept, you consent to CF Benchmarks's use of cookies.
Visit Cookie Settings to learn how CF Benchmarks uses cookies and to adjust your preferences.