
Dec 30, 2025
Risk-On Reloaded: Monetary Easing, Catch-up Trades, and the Tokenization Buildout
Executive Summary
We believe crypto markets are entering a transformative phase in 2026, where regulatory clarity and monetary easing increasingly outweigh lingering macro uncertainty. Amid a softening U.S. economy, with growth moderating below trend due to consumer retrenchment, depleted savings, and labor market slack, we expect the Fed to deliver a dovish pivot that runs counter to current consensus expectations, including 125–150 basis points of rate cuts and balance sheet expansion. This shift will foster lower real yields and fiat debasement risks. We believe this environment will be constructive for digital assets. The CLARITY Act, alongside SEC and CFTC guidance on tokenization, will act as a growth tailwind for tokenized real-world assets, driving expansion from $16 billion to over $30 billion and benefiting platforms like Ethereum and Solana through enhanced on-chain issuance and settlement. Altcoins are poised to catch up, supported by ETF approvals and regulatory clarity likely to improve market breadth, while Bitcoin is positioned for a potential catch-up trade with gold. Prediction markets are expected to see growth beyond sports and politics, with traders seeking exposure to macroeconomic events and crypto-market developments.
Market Recap: Product Progress, Policy Noise, and a Defensive Turn
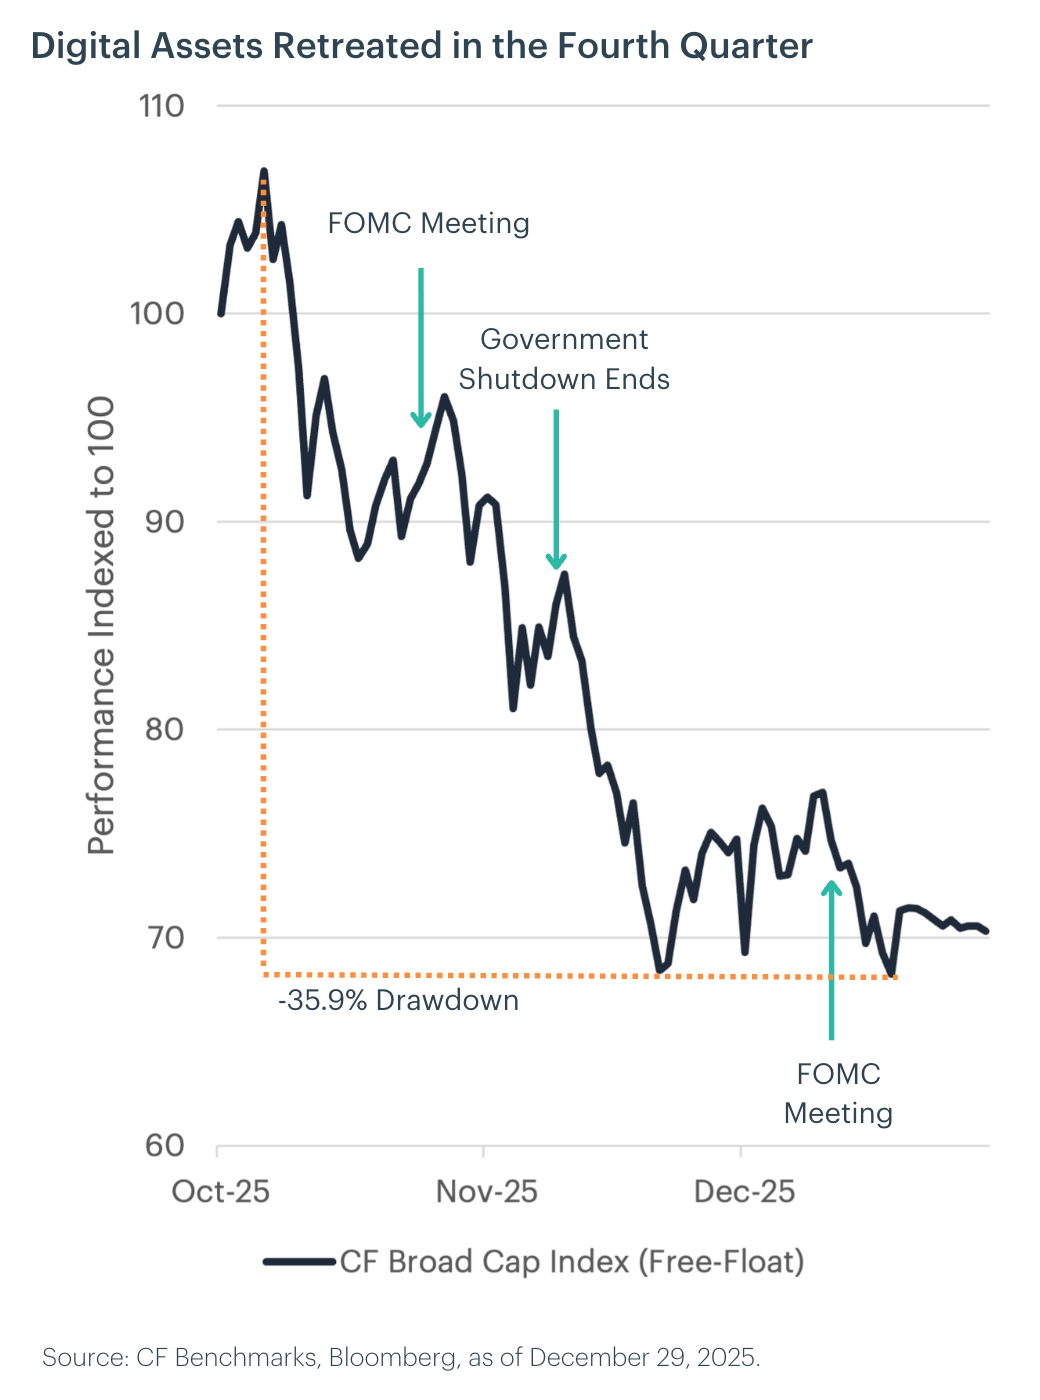
Digital assets entered Q4 with a mix of expanding market access and incremental monetary easing, and October put both themes on display. The SEC's new generic listing standards effectively cleared the way for U.S. spot ETFs beyond Bitcoin and Ether, including the launch of a Solana staking ETF that drew more than $400 million in its first five days. CME reinforced the institutional toolkit by launching options on Solana and XRP futures. The FOMC delivered a 25-basis-point cut to 3.75–4.00% and signaled a gradual tapering of quantitative tightening, modestly easing financial conditions.
October also showed how quickly product momentum can be overshadowed by policy tone. Post-meeting remarks from the Fed Chair weighed on sentiment, volatility increased, and digital assets drifted lower as investors shifted defensively. Market structure continued to improve, but confidence remained fragile and highly sensitive to communication from policymakers.
November extended the risk-off turn into a more decisive phase of the correction. As expectations for a December cut faded, risk appetite deteriorated further and macro concerns took precedence over improving access. Bitcoin slid into the lower $80,000 range, crypto ETPs recorded some of their heaviest weekly outflows of the year, and volatility rose sharply as positioning was reduced. In that context, the launch of the CME CF Bitcoin Volatility Indices proved timely, giving allocators a standardized gauge for implied volatility as demand for hedging intensified. Even with the second wave of U.S. spot ETFs continuing to broaden exposure beyond Bitcoin and Ether, policy signals and macro uncertainty dominated trading.
December kept the focus on monetary policy and macro conditions. The Fed delivered another 25-basis-point cut on December 10, but it failed to stabilize sentiment as Bitcoin remained weak and labor market data softened. By year-end, the digital asset market, as measured by the CF Broad Cap Index (free-float), remained in correction territory, down approximately 35% from its highs. Q3 GDP surprised at 4.3% annualized growth, though investors looked past the headline as trade-war distortions clouded the underlying data.
Measuring Growth: Resilience Gives Way to Retrenchment as Labor Market Softening Tests the Expansion
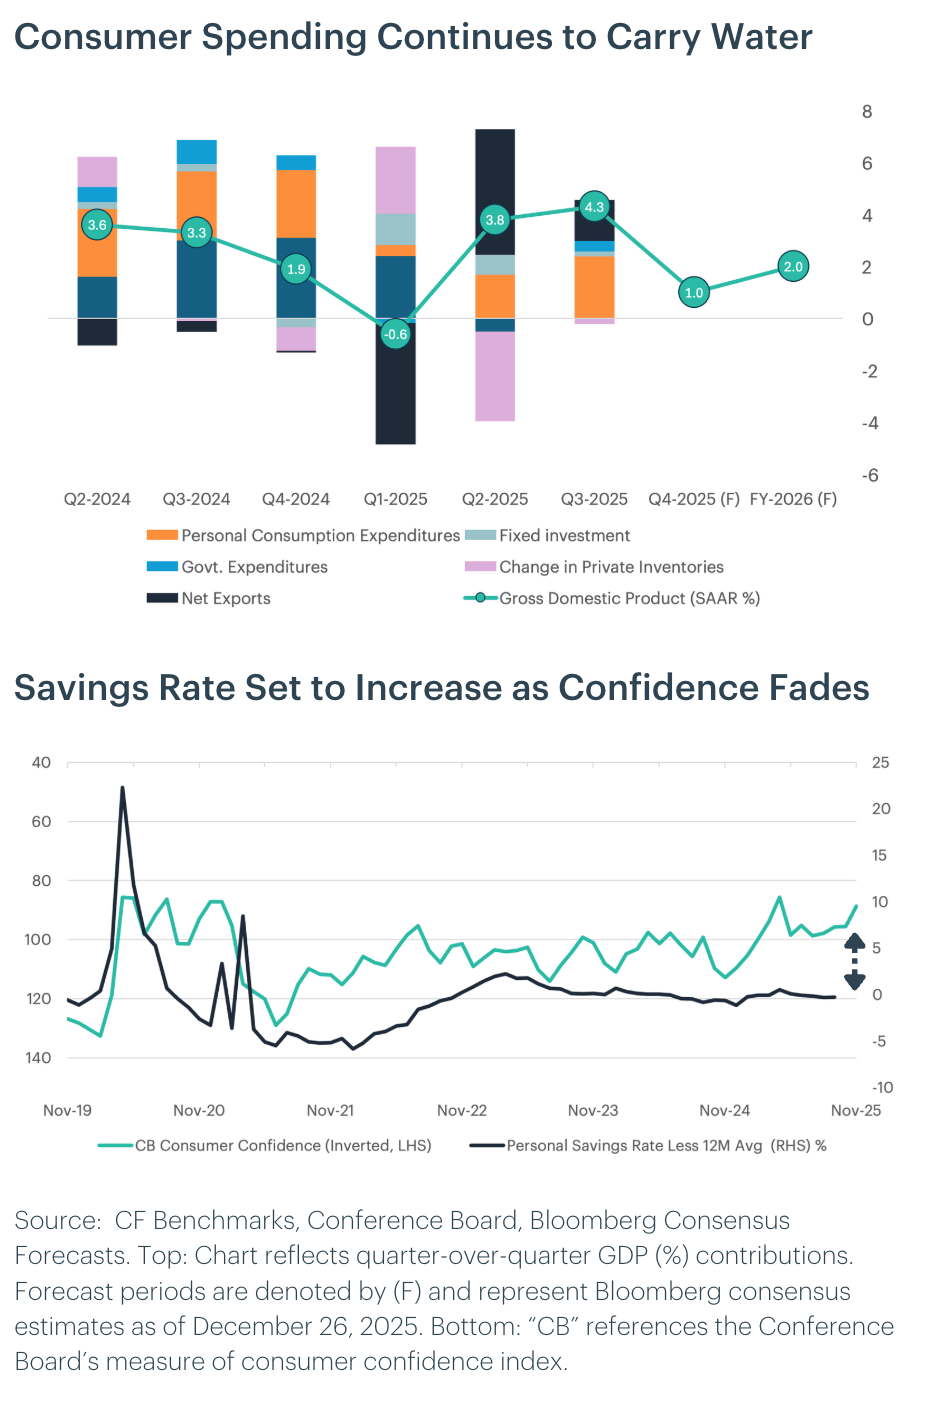
U.S. growth carried more momentum into late 2025 than expected, supported by resilient services demand and fiscal support, but that impulse is now moderating as the economy transitions into 2026. Consumer spending is slowing, particularly across discretionary categories, as households contend with higher costs, depleted savings buffers, and rising caution. Job creation has cooled to a pace only just sufficient to stabilize unemployment, signaling a gradual loss of traction rather than an abrupt downturn. While tariff-related price pressures have largely passed, their secondary effects are becoming clearer. Firms in impacted industries are absorbing higher input costs, compressing margins and restraining non-AI investment, while households rebuild savings and defer big-ticket purchases. These dynamics are likely to cap real consumption growth near 1% in early 2026, keeping GDP expansion below recent trends even as other areeas of ecnomic activity rebounds modestly from late-2025 disruptions.
At the same time, labor-market softening is reshaping the growth outlook. Wage growth is decelerating as hiring intentions ease, job postings decline, and the quits rate falls, strengthening employers’ wage-setting power. While this supports faster disinflation, it also constrains labor income growth and limits a broader reacceleration in demand. Monetary policy transmission remains weak, with rate cuts providing limited relief to housing and little spillover beyond circular AI-related investment so far. Against this backdrop, the Federal Reserve is increasingly managing downside risks to the labor market rather than responding to inflation pressures, reinforcing a policy bias toward further easing in 2026. As a result, growth is increasingly reliant on a narrow set of growth pockets, notably AI-driven capital expenditure and modest fiscal tailwinds, leaving domestic demand fragile and the expansion dependent on continued policy accommodation to contain downside risks and eventually restart labor market growth.
Portfolio Perspective: We maintain a cautiously constructive stance on U.S. growth over the next 12 months. While activity is unlikely to deteriorate sharply, the expansion is increasingly reliant on policy support as households retrench, labor income growth slows, and non-AI investment remains constrained. Real GDP growth is likely to settle below trend, even as monetary easing helps limit downside risks. In this environment, broad cyclical exposure offers diminishing returns, and portfolios should prioritize areas where liquidity, policy accommodation, and structural demand intersect. Digital assets, artificial intelligence, and related infrastructure stand out as beneficiaries of falling real yields, continued capital deployment, and regulatory normalization.
Measuring Inflation: Disinflation Anchored by Core Goods, Shelter, and Wages.
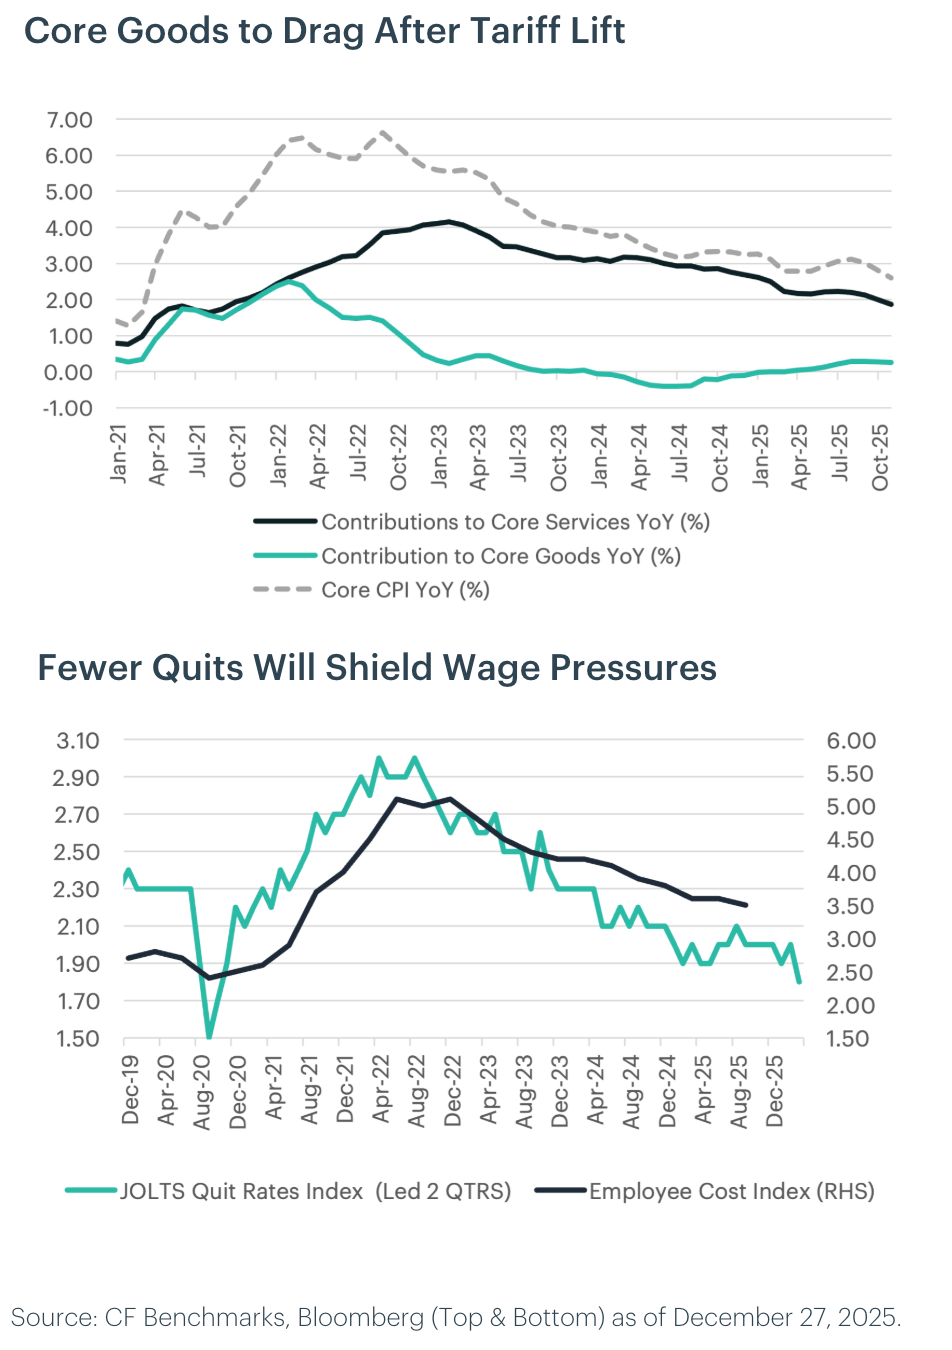
The inflation landscape heading into early 2026 is increasingly shaped by measurement noise rather than a renewed acceleration in underlying price pressures. Recent CPI prints were affected by disruptions to data collection and timing effects that skewed month-to-month readings toward late-period discounting, temporarily suppressing select categories such as airline fares and core goods. As these distortions unwind, inflation readings may rebound modestly in the near term, particularly in components that experienced outsized declines. However, such moves should be interpreted cautiously and not mistaken for a shift in the broader inflation regime. The near-term path is therefore likely to remain choppy, even as the medium-term direction continues to point lower.
Beyond these technical effects, the forward inflation impulse is weakening. Tariff-related price pressures in core goods are now peaking and likely to become a modest drag as competitive dynamics force firms to absorb higher input costs rather than pass them through to consumers. At the same time, shelter inflation is showing more durable signs of deceleration, as slower growth in new lease rents feeds into official measures of primary rent and owners' equivalent rent with a lag. While services inflation outside of housing remains sticky in certain categories, the combination of slowing wage growth, easing labor-market tightness, and moderating demand should gradually dampen price pressures through 2026. Taken together, these dynamics suggest that inflation risks are skewed toward undershooting current policy projections over the medium term rather than re-accelerating meaningfully.
Portfolio Perspective: Near-term volatility in inflation data should be treated as transitory rather than indicative of a regime shift. With goods disinflation advancing, shelter pressures easing, and wage growth slowing, the balance of risks supports a continued decline in underlying inflation over the medium term, though ultra-accommodative fiscal and monetary impulse in the second half could complicate this trajectory. As policy increasingly prioritizes downside risks to the labor market, real yields are likely to drift lower, improving the backdrop for duration-sensitive assets and alternative stores of value. In this environment, assets with limited sensitivity to fiat debasement and strong adoption dynamics, including Bitcoin, may benefit as markets adjust to a prolonged period of disinflation, accommodative policy, and elevated macro uncertainty.
Measuring the Fed: Shadow Leadership and the Dovish Turn
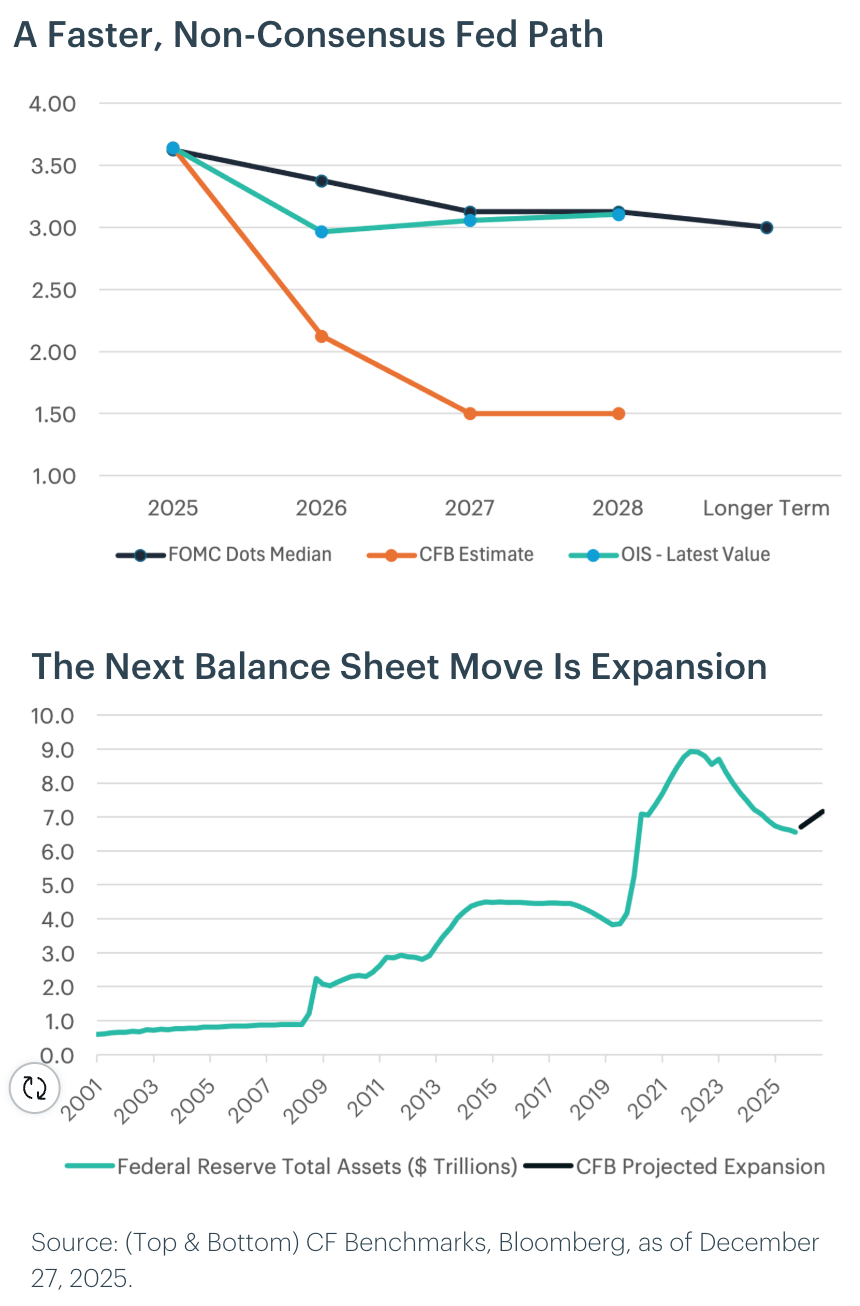
The December FOMC decision exposed deepening divisions, with three formal dissents and six "silent" dissenters opposing the 25bp cut. While near-term policy appears constrained by hawkish regional presidents joining the voting roster in 2026, a more decisive dovish trajectory is taking shape over the medium term. This view is anchored by accelerating labor market deterioration, the likely appointment of Kevin Hassett as "shadow Fed chair" ahead of Powell's May 2026 term expiry, and growing executive branch influence over the Fed's reaction function. With Trump expected to announce his nominee in early 2026, market expectations are already recalibrating beyond current committee divisions.
We expect a tactical pause in January as newly voting regional presidents assert their hawkish preferences, but anticipate five to six total rate cuts in 2026 (125-150bps), beginning in March and continuing through year-end, driven by undeniable labor market weakness. Powell's acknowledgment that underlying payroll growth is overstated, combined with wage pressures at February 2021 lows, validates our thesis of imminent slack. Markets are pricing this reality, with OIS-implied rates suggesting approximately 75bp of easing by year-end despite the Fed's official projection of just 25bp. The appointment of a Hassett-aligned shadow chair would formalize this dovish shift and accelerate the committee's pivot.
Portfolio Perspective: A Hassett-led Fed, whether formalized in May or shaping expectations through shadow influence, would bring fundamental shifts to monetary frameworks. His confidence in AI-driven productivity gains and deregulation's disinflationary impact suggests a Fed more willing to ease aggressively even with resilient growth. Should growth surprise to the upside while inflation moderates (Hassett's base case), the Fed may deliver deeper cuts than anticipated, potentially reaching 2.00-2.50% by year-end. Complementing rate cuts, the Fed's balance sheet is expected to expand at approximately $50 billion monthly through 2026. While framed as technical operations to maintain "ample reserves," this expansion reverses recent tightening and improves liquidity.
This environment favors assets protecting against monetary debasement and negative real rates. Bitcoin presents compelling opportunities amid deteriorating real yields, fiat erosion, and institutional demand for non-sovereign alternatives. The basis trading ecosystem stands to benefit from persistent contango as regulated futures markets mature and institutional allocation into digital assets expands under supportive policy conditions.
Measuring the Regulatory Environment: CLARITY Act Likely to Become Law as the SEC and CFTC Offer Guidance
The Digital Asset Market Clarity Act of 2025 (H.R. 3633) enters 2026 with the key open question being Senate action. The House-passed bill was received in the Senate and referred to Senate Banking on September 18, 2025, and there have been no officially posted post-referral text changes, so the House language remains the operative baseline. In 2026, the focus will be whether Senate Banking (and potentially Senate Agriculture) advances the bill as-is or via a substitute, with jurisdictional boundaries between the SEC and CFTC central to negotiations. Substantively, the latest House text leans toward quicker compliance pathways via expedited registration concepts, adds international cooperation language, and includes explicit DeFi exclusions that could become a major Senate flashpoint. It also contains stablecoin-adjacent references relevant for tokenized settlement, plus an anti-CBDC title that may shape the political coalition. If enacted, CLARITY would materially clarify market structure and improve regulatory pathways for tokenization.
Even without passage of CLARITY, the SEC has signaled movement toward clearer token classification frameworks and more tailored exemptions designed to reduce uncertainty around when crypto assets are treated as securities. In parallel, public statements and regulatory agendas point to proposed rules addressing crypto trading on alternative trading systems and national securities exchanges, with guidance likely to be issued in early 2026. The SEC's Crypto Task Force has also highlighted tokenization as a strategic priority, suggesting additional staff guidance around tokenized securities, custody standards, transfer agents, and secondary-market infrastructure.
The CFTC entered late 2025 with a digital assets pilot program permitting Bitcoin, Ether, and select stablecoins to be used as collateral, alongside initial guidance on tokenized collateral in regulated derivatives markets. In 2026, follow-on clarification is likely to focus on risk management, including custody and segregation standards, haircut methodologies, and operational resilience. These measures will be critical to scaling tokenized collateral across clearing, margining, and settlement processes, and they position the CFTC as a key enabler of institutional tokenization and on-chain finance adoption over the next year.
Portfolio Perspective: Regulatory progress on market structure and tokenization should accelerate onchain issuance and settlement in 2026. We expect established layer-1s like Ethereum to benefit most, with CF DeFi Composite Index constituents capturing upside as tokenized assets are increasingly used as onchain collateral.
Measuring Market Breadth: Altcoins to Catch up in 2026
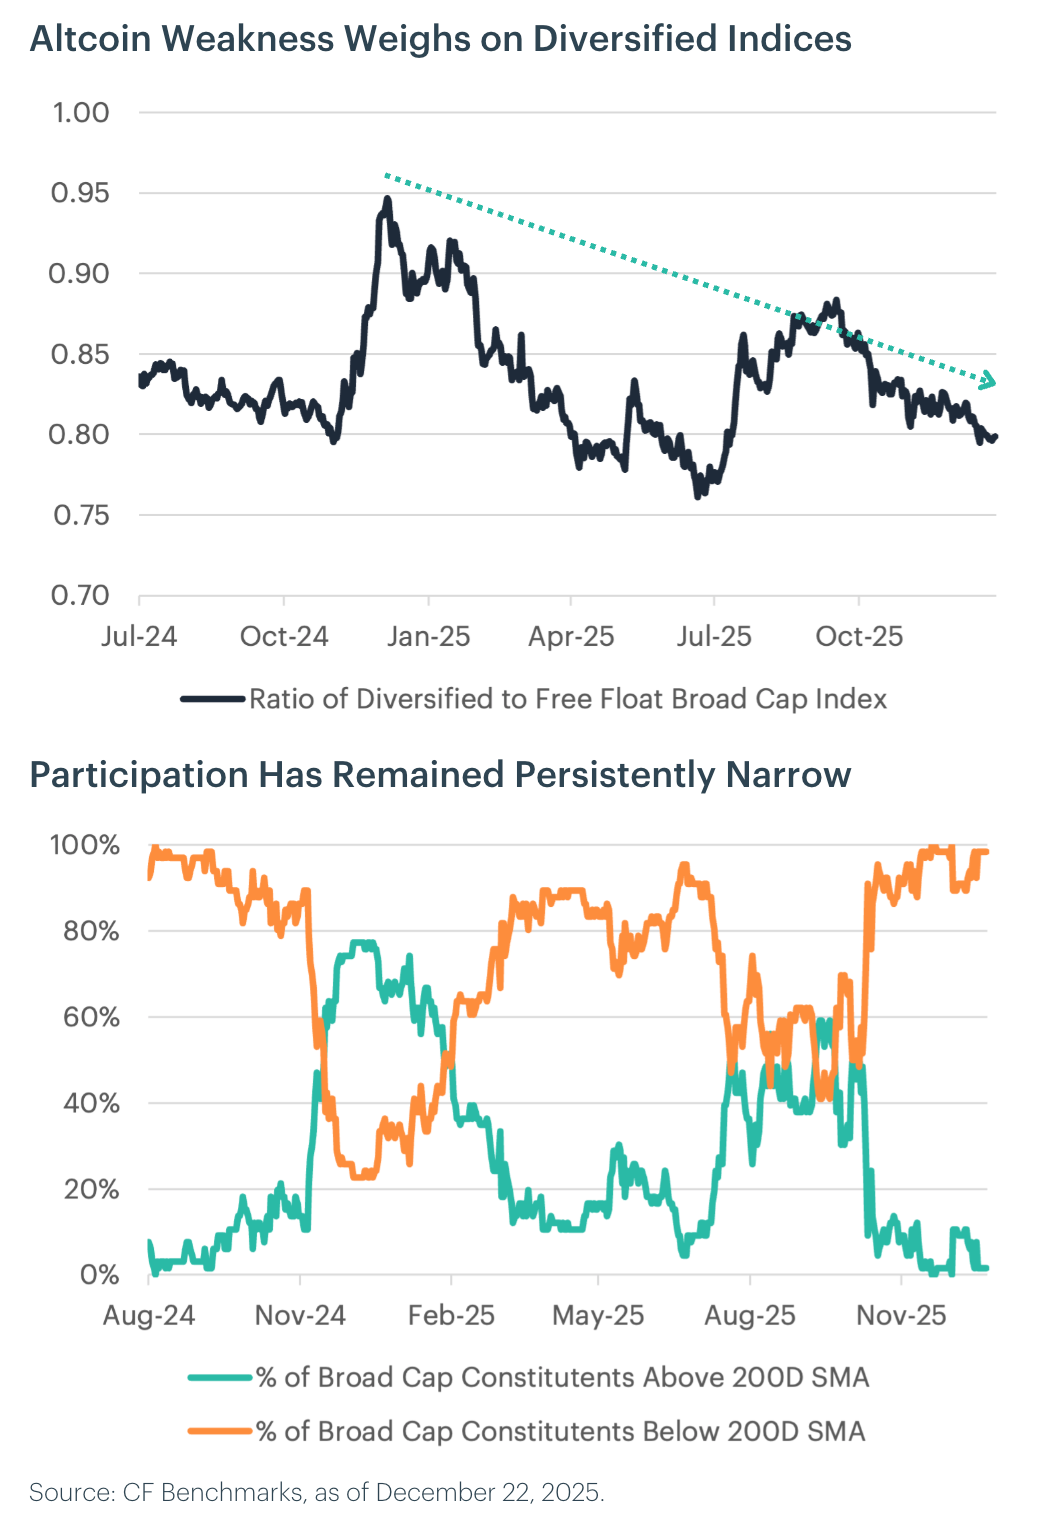
Altcoin performance is likely to improve meaningfully as market breadth expands heading into 2026. Today, performance remains narrowly concentrated, with the ratio of the CF Diversified Weight Broad Cap Index to its free-float market-cap-weighted counterpart at roughly 0.8, below the 0.83 average observed since summer 2024. This gap reflects persistent Bitcoin dominance and limited participation across the long tail of digital assets. Our base case is that this dispersion narrows via mean reversion, first toward the historical average and potentially toward parity, as altcoins begin to outperform Bitcoin on a relative basis.
A key signal to watch will be internal market structure. In particular, we will be monitoring when more than 60% of tokens in the index trade above their 200-day moving averages, a threshold typically associated with healthier, trend-driven markets rather than episodic rallies.
Historically, sustained breadth improvements have coincided with periods when capital rotates from Bitcoin into higher-beta assets as investors move further out the risk curve. Several catalysts could unlock this rotation. Regulatory clarity, particularly from the CLARITY Act, would reduce legal uncertainty around non-Bitcoin tokens and encourage institutional participation beyond Bitcoin and Ether. In parallel, the approval and asset accumulation of altcoin-focused and multi-token ETFs would introduce new, structurally sticky sources of demand, broadening access for allocators constrained from direct token exposure.
Portfolio Perspective: Improved institutional access to broader segments of the digital asset market is likely to support improving market breadth in 2026. As capital rotates beyond Bitcoin and participation broadens across the long tail of tokens, we expect the diversified-weight variants of the CF Broad Cap and CF Large Cap indices to outperform their free-float market-cap-weighted counterparts.
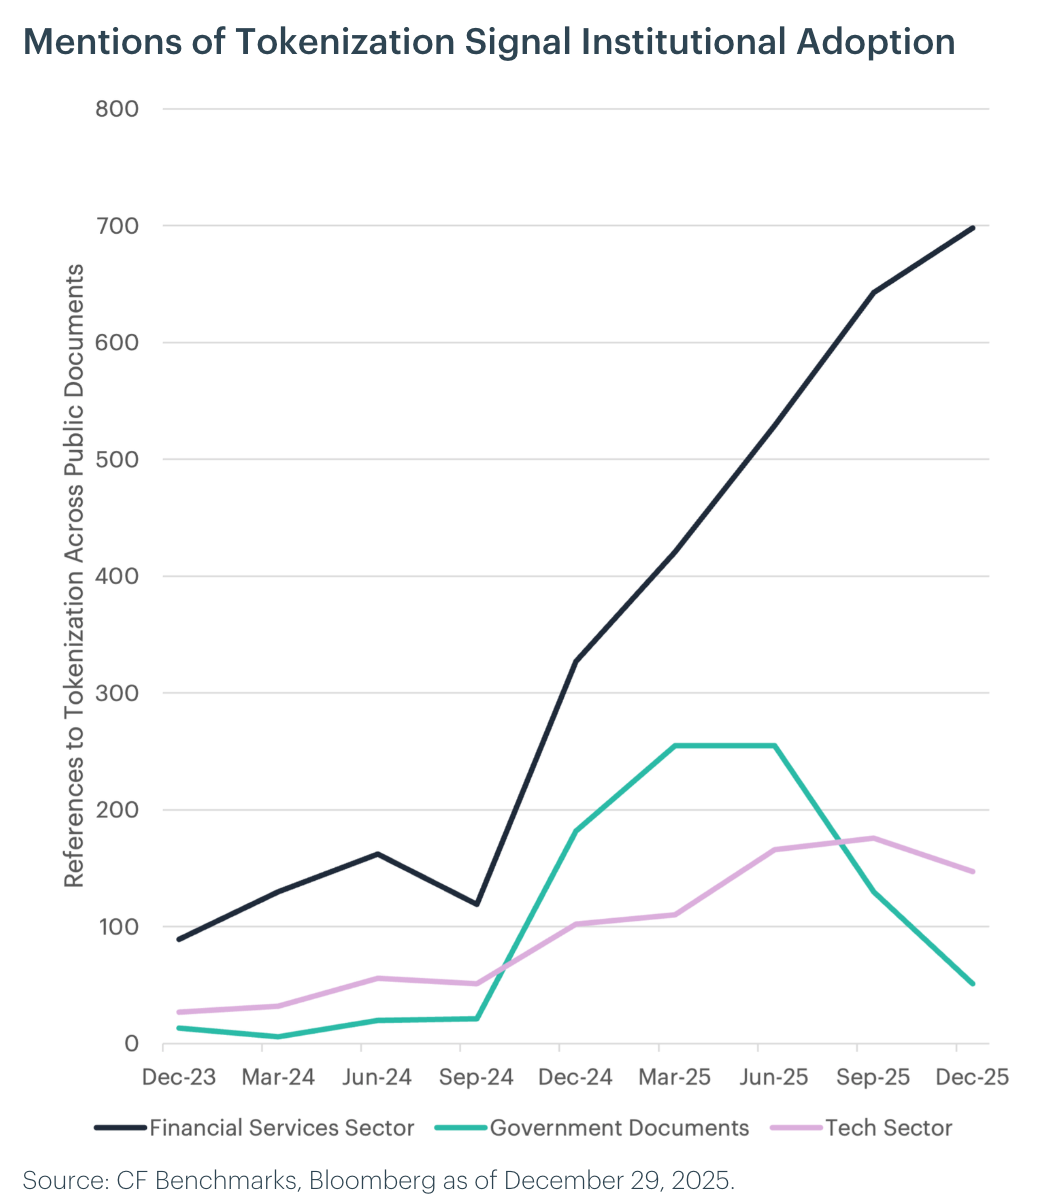
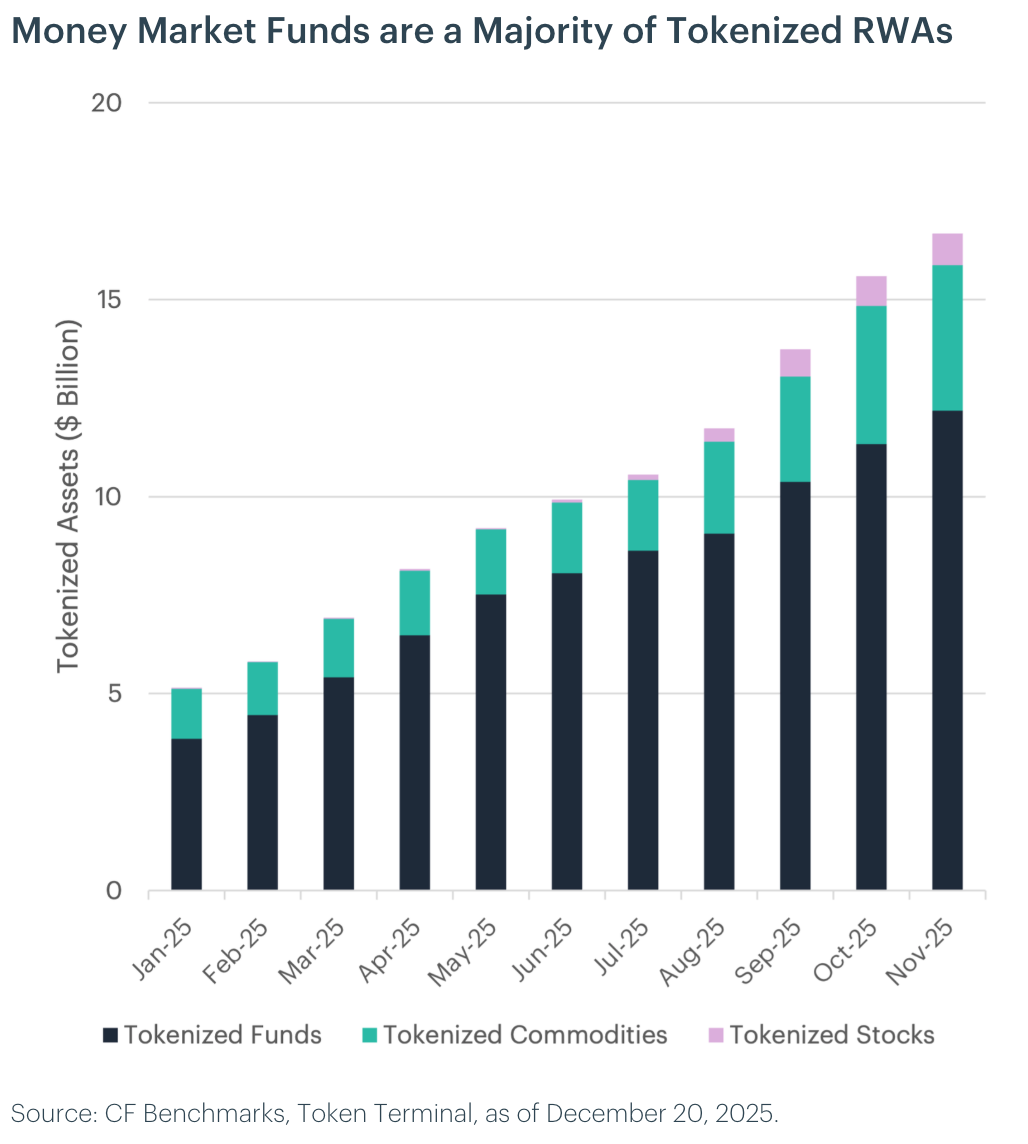
Measuring Tokenization: Stocks to Drive RWA Growth
Tokenized equity products have already shown a "zero-to-one" inflection over the last year: they grew from $0.03 billion (January 2025) to $0.8 billion (November 2025), with the steepest climb occurring in the last six months (from $0.07 billion in June to $0.80 billion in November). Over the same period, tokenized funds expanded from $3.9 billion to $12.2 billion, while tokenized commodities rose from $1.28 billion to $3.69 billion.
Looking into 2026, our base case is that tokenized RWAs grow from roughly $16 billion to over $30 billion by year-end, with tokenized stocks as the primary driver. The catalyst is likely to be market-structure legislation and adjacent rulemaking that clarifies how on-chain equities fit into existing issuance, custody, and trading frameworks.
Traditional financial firms are already building the rails. Asset managers have proven demand for regulated, on-chain wrappers (e.g., BlackRock's BUIDL and Franklin Templeton's BENJI/FOBXX), while banks and market infrastructures are pushing tokenized settlement and issuance, including HSBC Orion for digitally native bond issuance, UBS Tokenize for end-to-end tokenized fund workflows, and industry efforts around tokenized cash and deposits to support delivery-versus-payment settlement. Alongside these incumbents, Kraken's xStocks is demonstrating real product-market fit for tokenized equities. xStocks has surpassed $10 billion in combined CEX and DEX transaction volume, including nearly $2 billion of on-chain activity, achieved in roughly 135 days from public launch.
Regulation remains the gating factor for tokenized stocks in the U.S. The SEC has stressed that "tokenized securities are still securities," implying compliance with the existing securities law stack rather than a new category. A major unlock is the pathway for registered venues and post-trade plumbing. Nasdaq has filed with the SEC to enable trading of securities in tokenized form, which would be a concrete step toward mainstream market access. Meanwhile, the CFTC is advancing a digital assets pilot program focused on tokenized collateral in derivatives markets, which is helpful for capital efficiency and institutional participation.
What we expect to see in 2026 is an operational rulebook. This includes clearer standards for on-chain equity custody and recordkeeping, transfer-agent and settlement-finality expectations, and coordinated SEC and CFTC treatment of margin and cross-market supervision. These conditions would make tokenized stocks the growth engine of the next RWA leg.
Portfolio Perspective: Ethereum and Solana are likely to be the primary beneficiaries of RWA tokenization. Ethereum’s institutional adoption and deep DeFi liquidity support compliant settlement and issuance, while Solana’s performance and improving infrastructure enable scalable, consumer-facing trading of tokenized equities.
Measuring Prediction Markets: Sports and Politics Drove Initial Volume Growth, Crypto and Economics to Lead the Next Phase
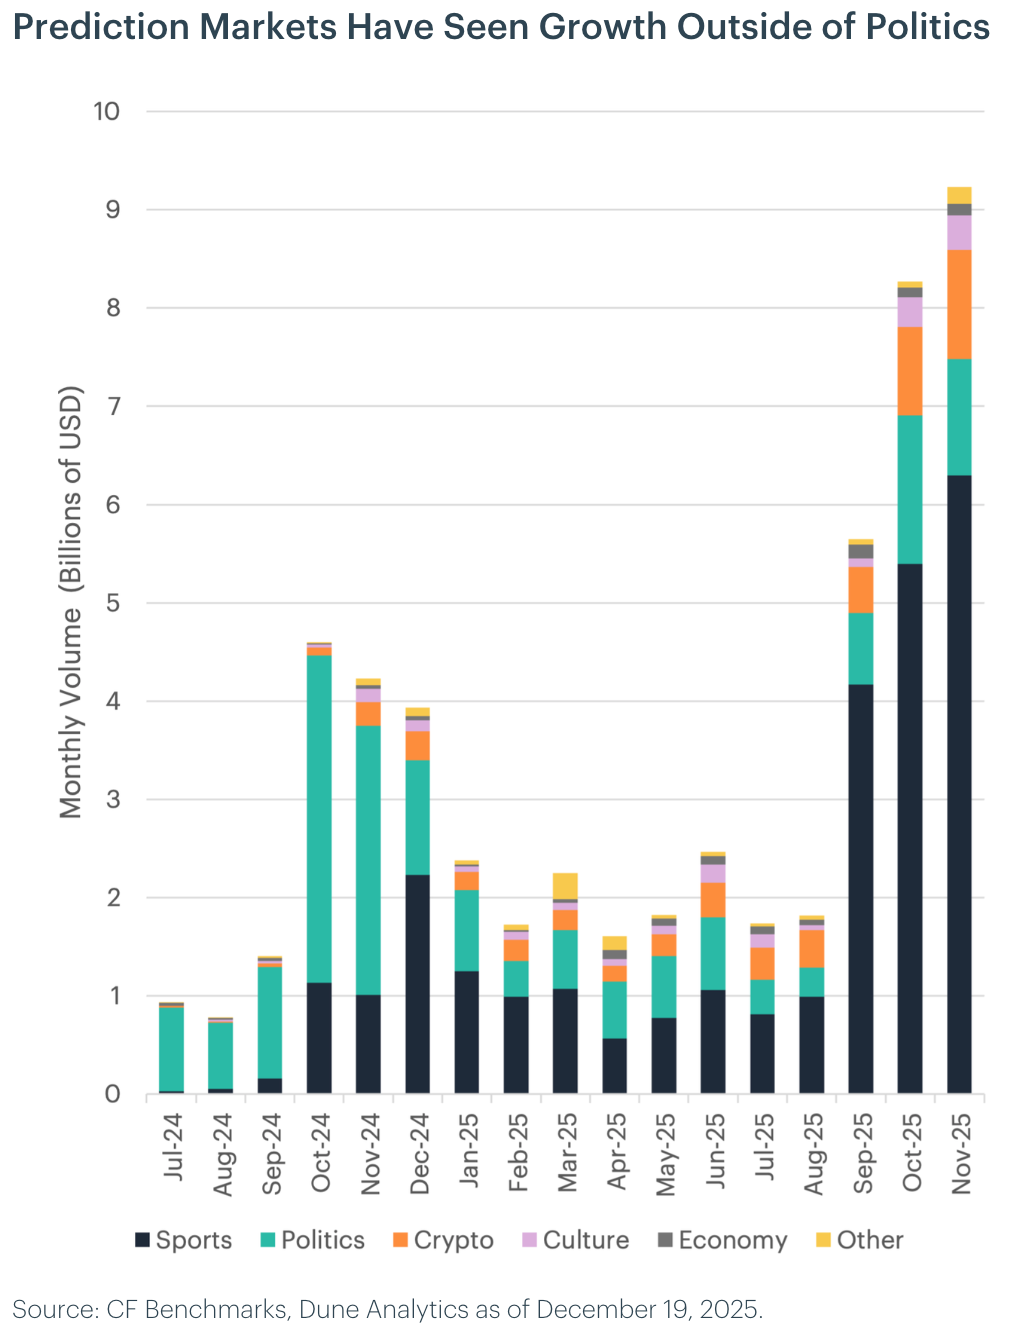
Prediction markets allow participants to trade event contracts whose prices reflect the market-implied probability of a specific outcome, ranging from sports results and election outcomes to economic data releases and crypto-native milestones. Rather than simply offering binary bets, these markets function as real-time forecasting tools, aggregating dispersed information into prices that can be used for speculation, hedging, or information discovery. Their growth in 2025 has been driven by improved user experience, greater regulatory clarity in certain jurisdictions, deeper liquidity, and a rapidly expanding set of tradable events. This year, monthly volumes increased from roughly $2.4 billion to more than $9 billion by November. Sports contracts currently dominate activity, accounting for the majority of volume and serving as the primary on-ramp for new users. However, the data also show a steady broadening of market composition, with non-sports categories growing faster than the overall market.
Looking into 2026, we expect this trend to continue, with incremental growth increasingly concentrated in crypto and economy-linked contracts. Crypto prediction markets are emerging as a vehicle for expressing precise, time-bound views on prices, network upgrades, regulatory outcomes, and other discrete catalysts. A key advantage is that traders can gain exposure to a clearly defined outcome with a known settlement condition, rather than managing Greeks or liquidation risk. When paired with settlement anchored to regulated benchmark providers such as CF Benchmarks, these contracts can offer greater confidence in dispute-resistant resolution. As liquidity deepens, these markets could take share from perpetuals and options for certain strategies, potentially accounting for as much as 25% of total monthly volume in some periods. In parallel, economy-focused contracts should see outsized growth as traders use event markets to speculate on or hedge key macro releases such as inflation, employment, growth, and central bank decisions, with volumes potentially reaching 10% of the total in peak months.
With sports providing a stable base and higher-frequency use cases scaling across crypto and macro, our base case is for continued strong adoption. If the late-2025 growth persists and the category mix continues to broaden, prediction market volumes could exceed $20 billion per month by the end of 2026.
Portfolio Perspective: Growth in prediction markets is likely to increase demand for stablecoin-based funding rails, benefiting layer-1 networks that facilitate fast, low-cost settlement. Tokens in the CF Web 3.0 Smart Contract Platforms Index are well positioned as prediction market activity drives higher on-chain transaction volumes.
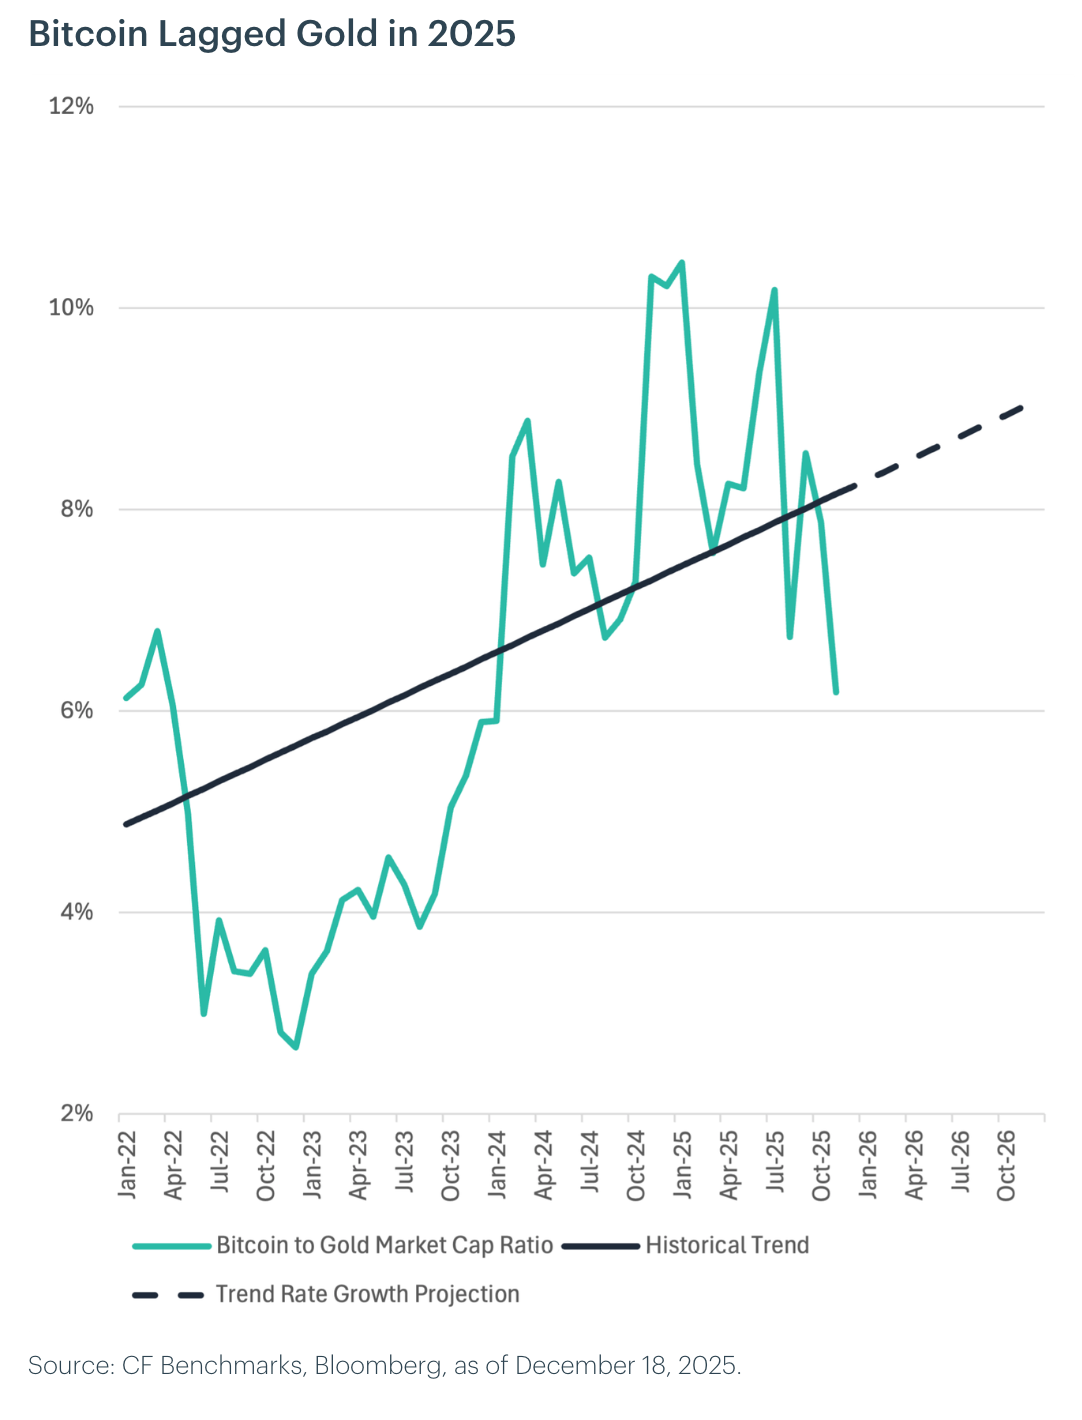
Measuring Bitcoin’s Relative Value: Bitcoin to Catch up to Gold
Looking into 2026, we expect demand for stores of value to remain strong as fiscal imbalances widen and fiat debasement accelerates, reinforcing investor appetite for assets that sit outside the traditional monetary system. In this environment, Bitcoin is well positioned. Its advantages in portability, divisibility, and fixed supply are likely to continue attracting new investors, allowing it to benefit from rising adoption alongside ongoing growth in the global fiat money supply.
In the fourth quarter of 2025, Bitcoin's market capitalization relative to gold fell below its longer-term trend. At the end of November 2025, the Bitcoin-to-gold market cap ratio stood at 6.2% versus a long-term trend of 8.2%, placing Bitcoin roughly 24% below trend on this metric. Extending the current trend-rate growth forward implies that Bitcoin's market capitalization could reach approximately 9.1% of gold's by the end of 2026. In our view, this recent dislocation has created a tactical entry point for allocators seeking Bitcoin exposure, with the balance of risks over the next 12 months skewed toward convergence back to trend.
We can apply this relative valuation framework to quantify the degree to which Bitcoin is undervalued. Assuming gold's market capitalization continues to grow at its trend rate over the next 12 months, a mean reversion in the Bitcoin-to-gold ratio toward its historical trend would imply a materially higher Bitcoin market capitalization. Under this relationship, convergence back to trend is consistent with a Bitcoin price of approximately $138,000 by the end of 2026. This suggests that Bitcoin could see upside of as much as 50% from its current price.
Portfolio Perspective: Widening fiscal imbalances and ongoing fiat debasement should keep demand for stores of value strong into 2026, leaving Bitcoin well supported as an asset outside the traditional monetary system. With the Bitcoin-to-gold market cap ratio below its long-run trend, we view the setup as a favorable tactical entry point for allocators. If the ratio mean-reverts, that framework is consistent with a Bitcoin price around $138,000 by year-end 2026 and implies up to roughly 50% upside from current levels. Even so, volatility and drawdown risk remain elevated, reinforcing the need for prudent sizing and risk controls.
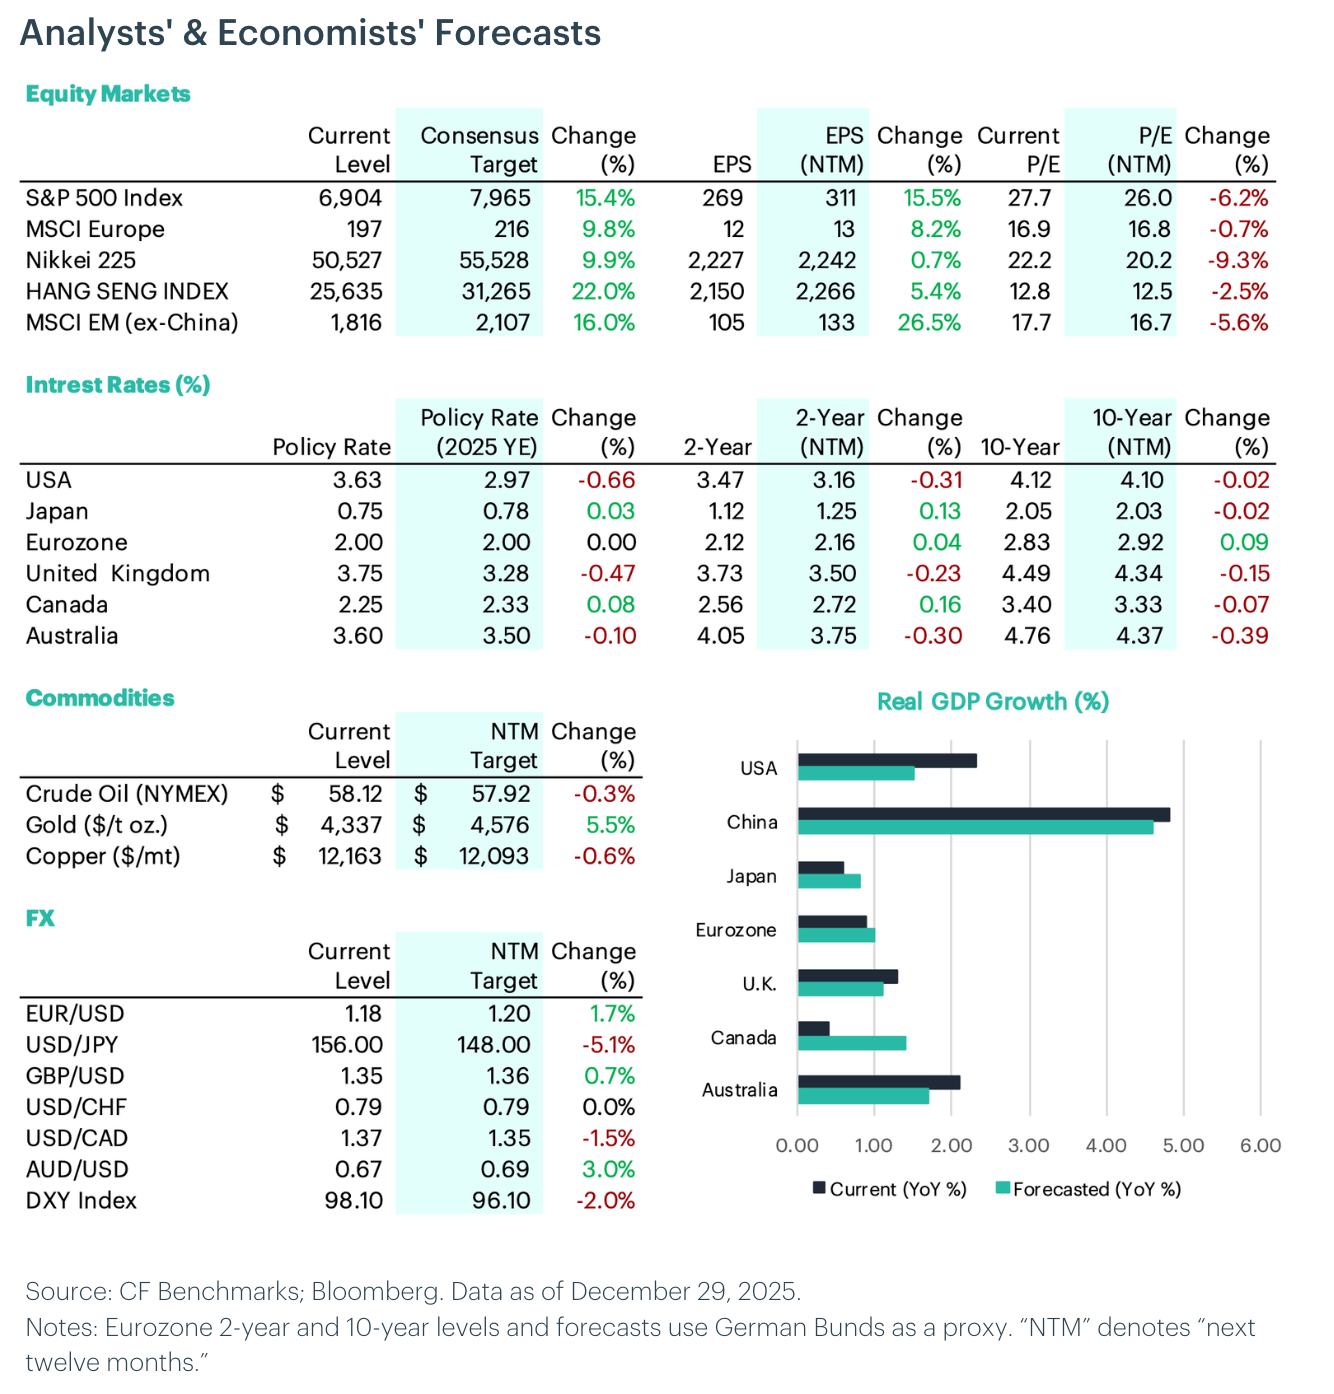
Measuring the Crowd: Consensus Forecasts
Equities: Analysts maintain a broadly positive outlook for equities, with the Hang Seng Index (+22.0%) and emerging markets ex-China (+16.0%) leading major forecasts. European markets (+9.8%) and Japan (+9.9%) are also expected to perform well. U.S. equities are forecast to rise 15.4%, with S&P 500 earnings per share projected to grow by 15.5%. Valuation multiples are expected to contract across major markets, with the S&P 500's P/E falling 6.2%, suggesting price gains are driven entirely by earnings growth rather than multiple expansion.
Interest Rates: Policy rate forecasts show modest changes across developed markets, with the U.S. expected at 2.97% by year-end 2025 (currently 3.63%), the U.K. at 3.28% (from 3.75%), and Australia at 3.50% (from 3.60%). Canada is projected at 2.33% (from 2.25%), while Japan is forecast at 0.78% (from 0.75%). The Eurozone is expected to remain at 2.00%. Changes in 2- and 10-year yields remain modest, suggesting that global inflation concerns are keeping long rates elevated.
Commodities: Gold is forecast to rise 5.5%, reflecting steady investor demand for real assets amid macro uncertainty. Crude oil is expected to decline slightly (-0.3%), pointing to softer demand expectations. Copper is projected to fall 0.6%, suggesting muted momentum in industrial activity.
FX: The U.S. dollar is expected to weaken, with the DXY Index down 2.0%. The yen is projected to appreciate sharply (+5.1%) on policy divergence, while gains are also expected in the euro (+1.7%), pound (+0.7%), and Australian dollar (+3.0%). The Swiss franc is forecast to remain broadly flat, while USD/CAD is expected to decline 1.5%.
GDP Growth: Growth forecasts show continued regional divergence. China is expected to lead with growth of 4.6%, while the U.S. is projected to slow to 1.5%. Canada (1.4%) and the Eurozone (1.0%) are forecast to improve modestly, while Australia is expected to moderate to 1.7%. By contrast, Japan (0.8%) and the U.K. (1.1%) are likely to see slower growth.
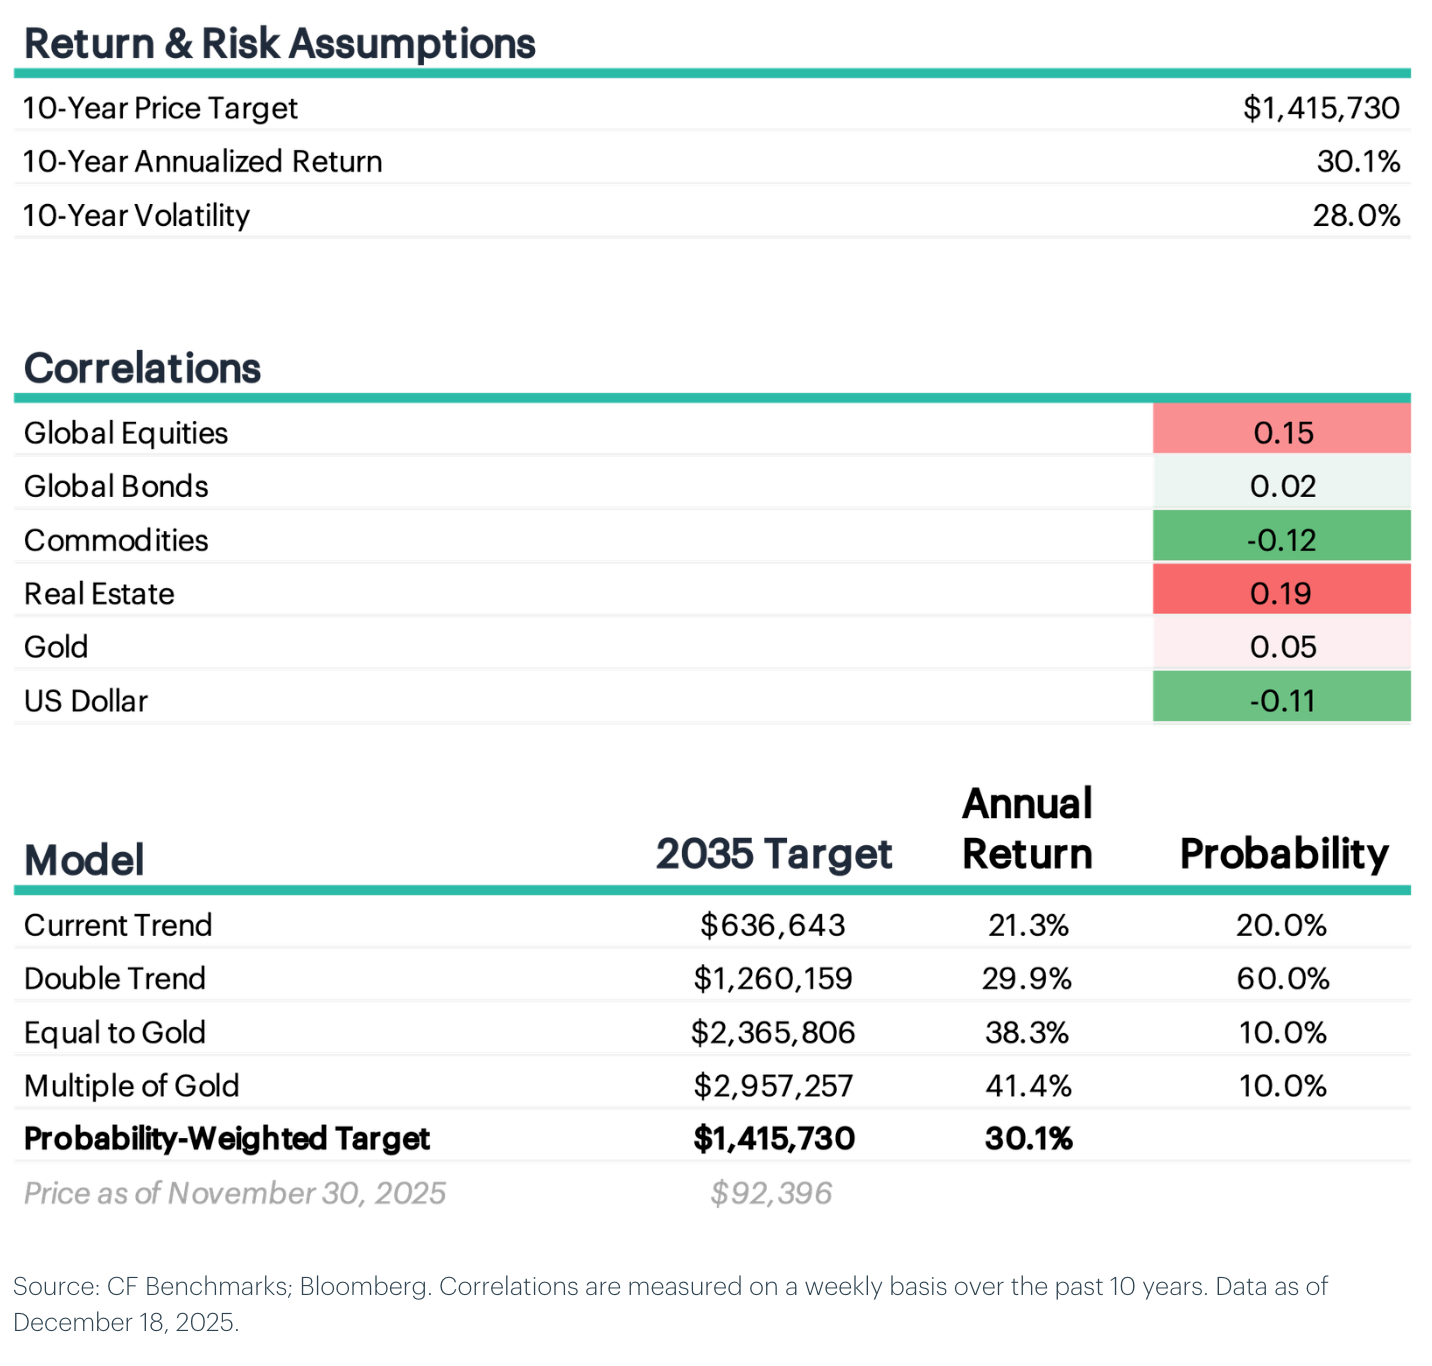
Measuring Return Assumptions: 2026 Bitcoin Capital Market Assumptions
Capital market assumptions provide institutional investors with forward-looking projections of expected returns, volatility, and correlations that guide strategic asset allocation decisions. As Bitcoin matures into an institutional asset class, developing rigorous capital market assumptions becomes essential for allocators evaluating its role within diversified portfolios.
Returns: Our 2026 capital market assumptions project a 10-year annualized return of 30.1% with a probability-weighted 2035 price target of $1,415,730. The price target incorporates probability-weighted scenarios in the store-of-value market, assigning 60% weight to double-trend growth, 20% to current trend continuation, and 10% each to gold parity and gold outperformance.
Volatility: We project long-run volatility using a two-stage decay model that extends the historical compression trend while assuming diminishing marginal declines. The model applies half the historical pace over the next five years (approximately -3.5% annually) reaching 30.6% by 2030, then halves the decay rate (approximately -1.75% annually) to roughly 28.0% by 2035.
Correlations: Our capital market assumptions project Bitcoin's correlations remaining low across asset classes: 0.15 to global equities, 0.02 to global bonds, -0.12 to commodities, 0.19 to real estate, 0.05 to gold, and -0.11 to the US dollar.
To read the our full market outlook report, please click here.
The information contained within is for educational and informational purposes ONLY. It is not intended nor should it be considered an invitation or inducement to buy or sell any of the underlying instruments cited including but not limited to cryptoassets, financial instruments or any instruments that reference any index provided by CF Benchmarks Ltd. This communication is not intended to persuade or incite you to buy or sell security or securities noted within. Any commentary provided is the opinion of the author and should not be considered a personalised recommendation. Please contact your financial adviser or professional before making an investment decision.
Note: Some of the underlying instruments cited within this material may be restricted to certain customer categories in certain jurisdictions.
Changes to the Token Market Price Benchmarks Series - Market Prices – 21 July 2026
The Administrator has confirmed changes to the Token Market Price Family for the period 14 July 2026 to 21 July 2026.

CF Benchmarks
Softer CPI Reprices July Hike Risk & Lifts Digital Assets
Digital assets extended their recovery over the past week as cooler US inflation prints repriced Fed expectations; the bid was broad across the large cap indices, growth factor leadership returned, stablecoin funding repriced lower, and stress stayed isolated in names hit by token-specific news.
Mark Pilipczuk
Notice of the Demising of CF Dai-Dollar Settlement Price and Spot Rate
The Administrator announces that it will demise the CF Dai-Dollar Settlement Price (DAIUSD_RR) and CF Dai-Dollar Spot Rate (DAIUSD_RTI) which are members of the CF Digital Asset Index Family.
CF Benchmarks
By clicking Accept, you consent to CF Benchmarks's use of cookies.
Visit Cookie Settings to learn how CF Benchmarks uses cookies and to adjust your preferences.