
Feb 27, 2026
Factor Friday
February 27, 2025
Defensive Rotation Broadens as Momentum Stages a Rally
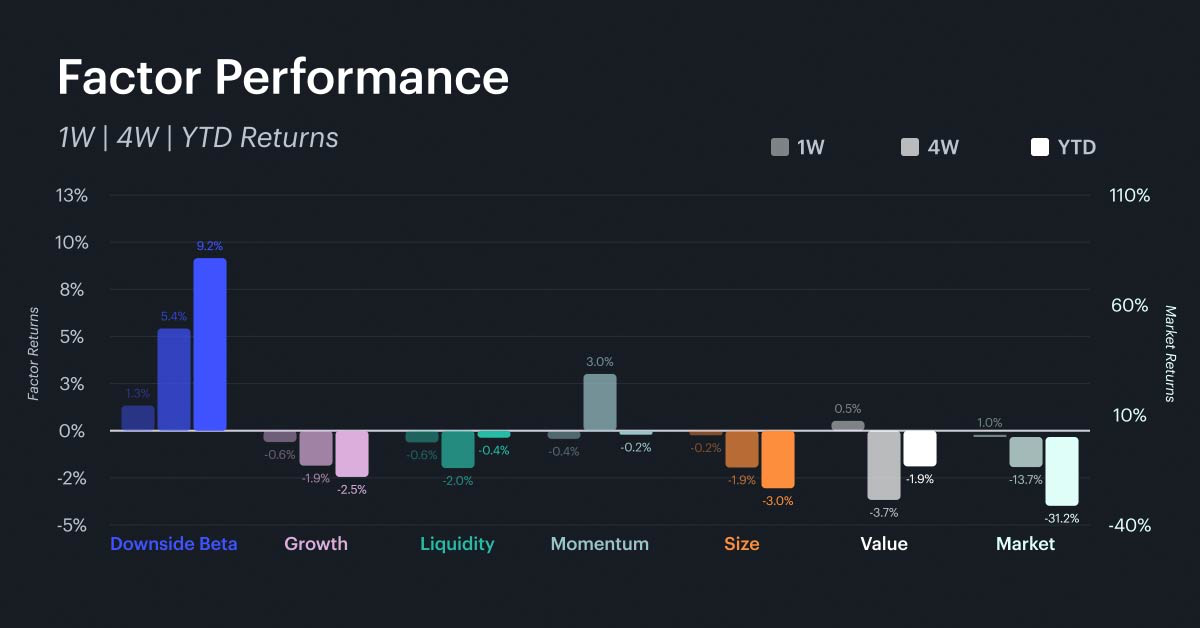
Last week, the market posted a modest rebound, gaining approximately 1.0% on the week. Despite the relief, the CF Free-Float Broad Cap Index remains down 31.2% year to date, reflecting a market that has yet to find a durable floor. Downside beta once again dominated, rising 1.3% on the week and extending its year-to-date gain to +9.2%, making it the only factor in positive territory in 2026. Although it retreated slightly momentum has been a strong performer over the last 4 weeks, surging 3.0%, its strongest showing in months. Though it remains marginally negative year to date at -0.2%. Size and value continued to lag, down 3.0% and 3.7% on the year respectively, while the market itself has shed 13.7% over the past four weeks. The factor landscape remains firmly risk-off, but the emergence of momentum as a short-term out performer warrants close attention.
Rolling Factor Rankings and Rotation
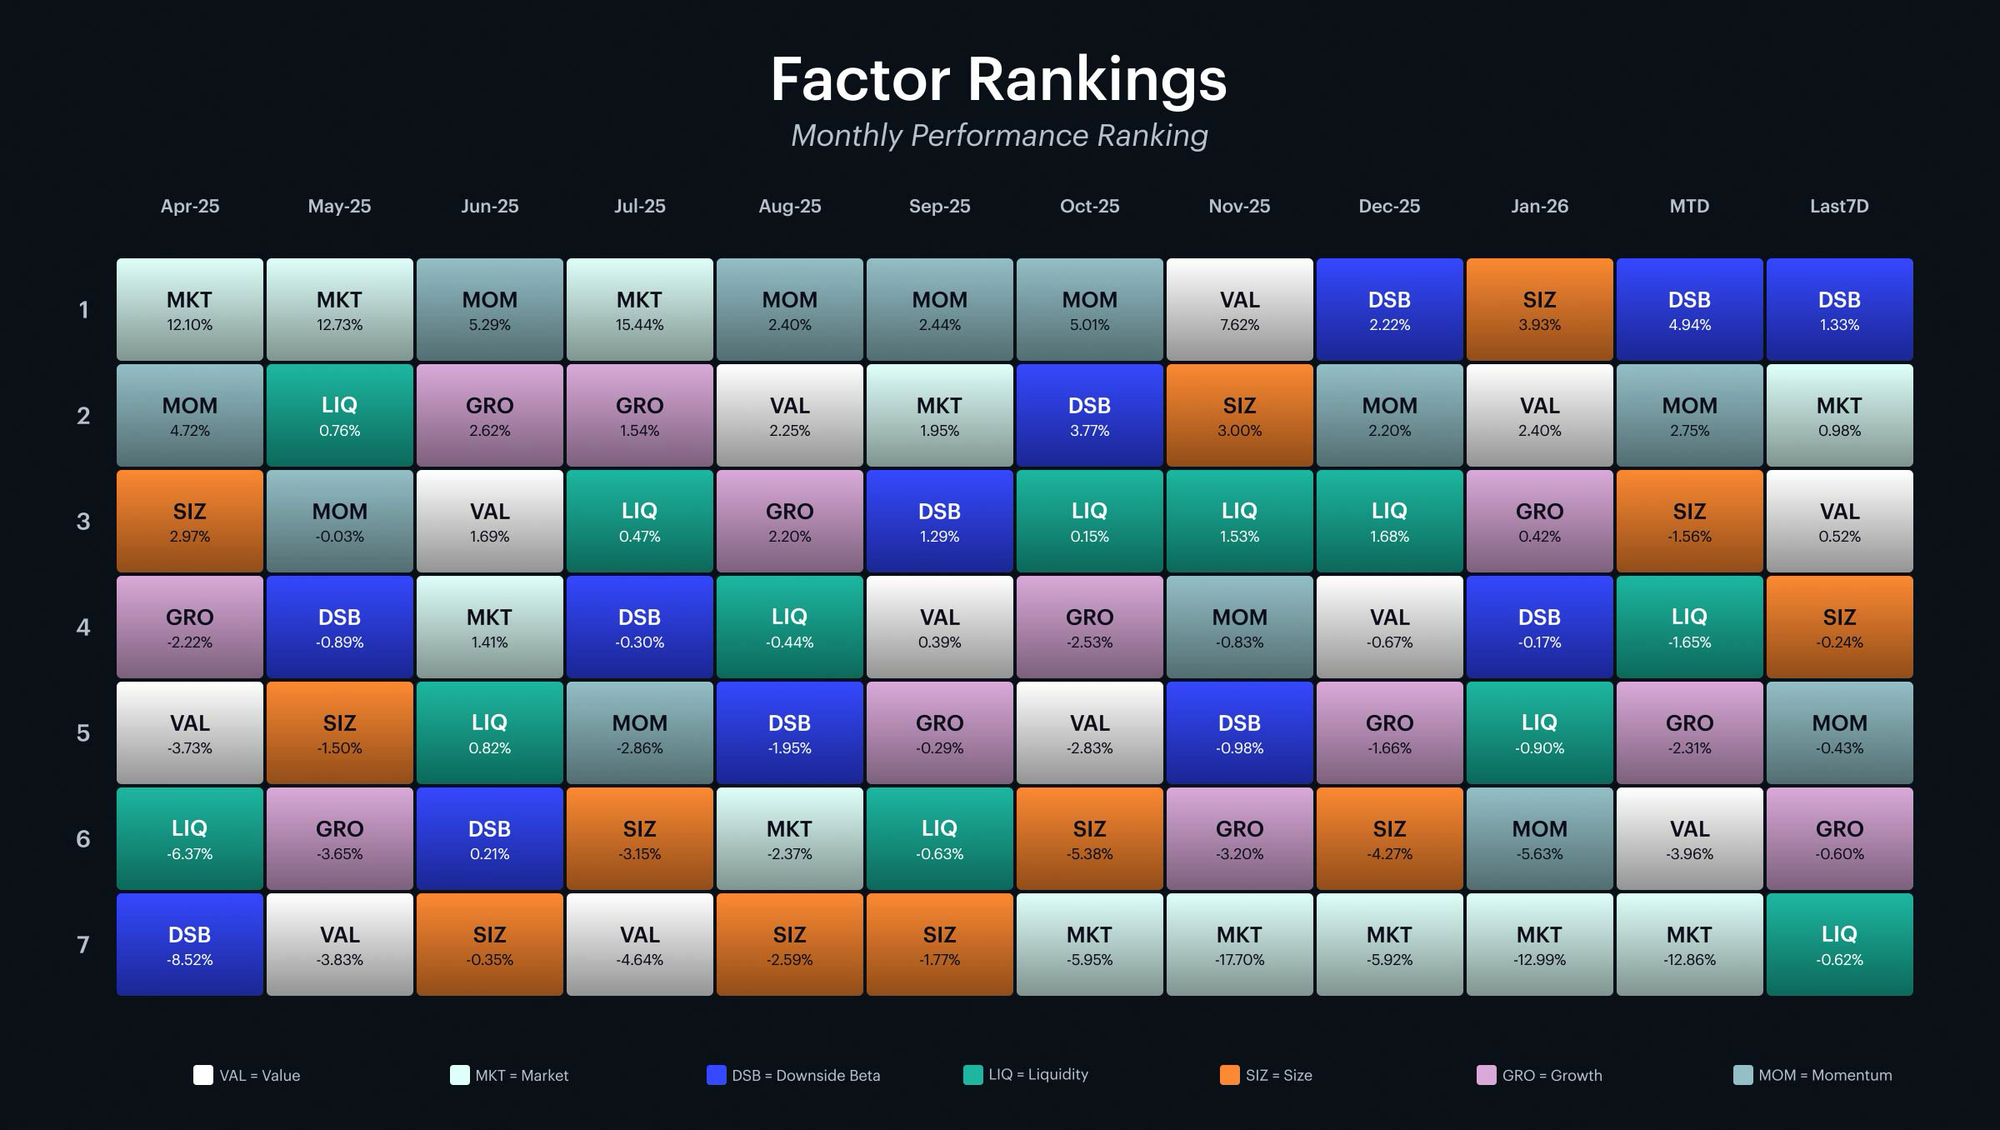
The performance quilt confirms that the post-October defensive regime remains intact, but the latest weekly column offers a subtle shift worth watching. Downside beta continues to hold the top ranking, where it has been anchored since December, and its dominance over the trailing month and year to date is now well-established. However, the market factor itself moved into second place over the last seven days, a function of the broad-based bounce rather than a sign of renewed risk appetite. Size also climbed to third on the week, consistent with a short-covering dynamic in smaller-cap names during relief rallies. The key thing to note is that value and growth remain persistently at the bottom of the rankings across nearly every month since November. Until these factors show sustained improvement, the market remains clearly defensive.
Market and Key Factor Betas
Market Beta
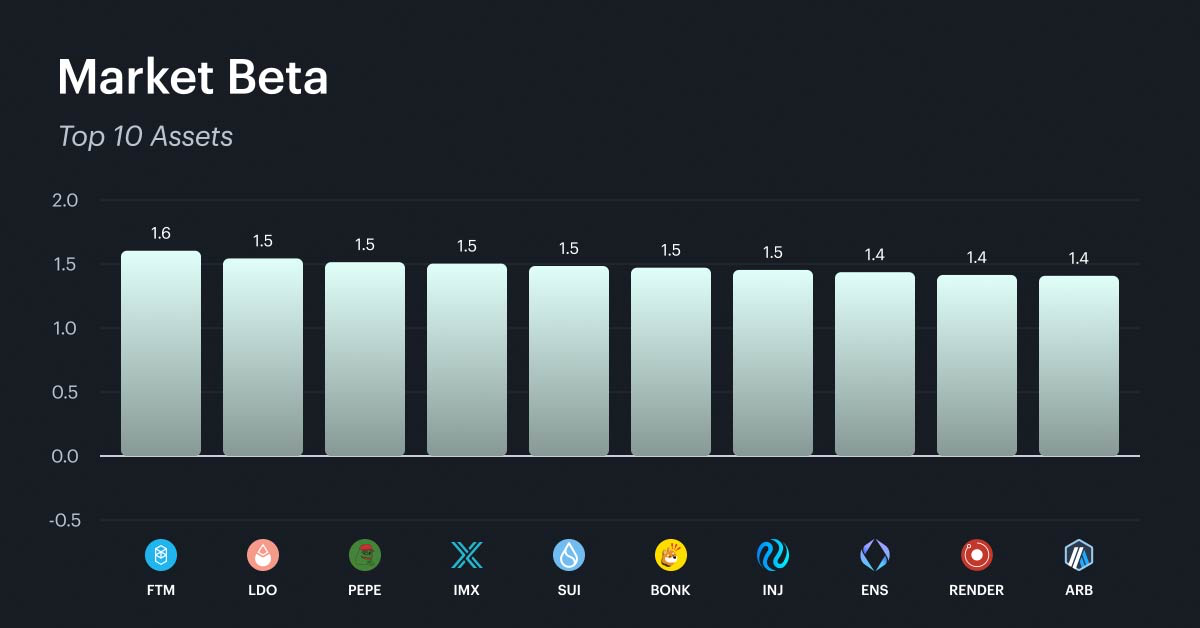
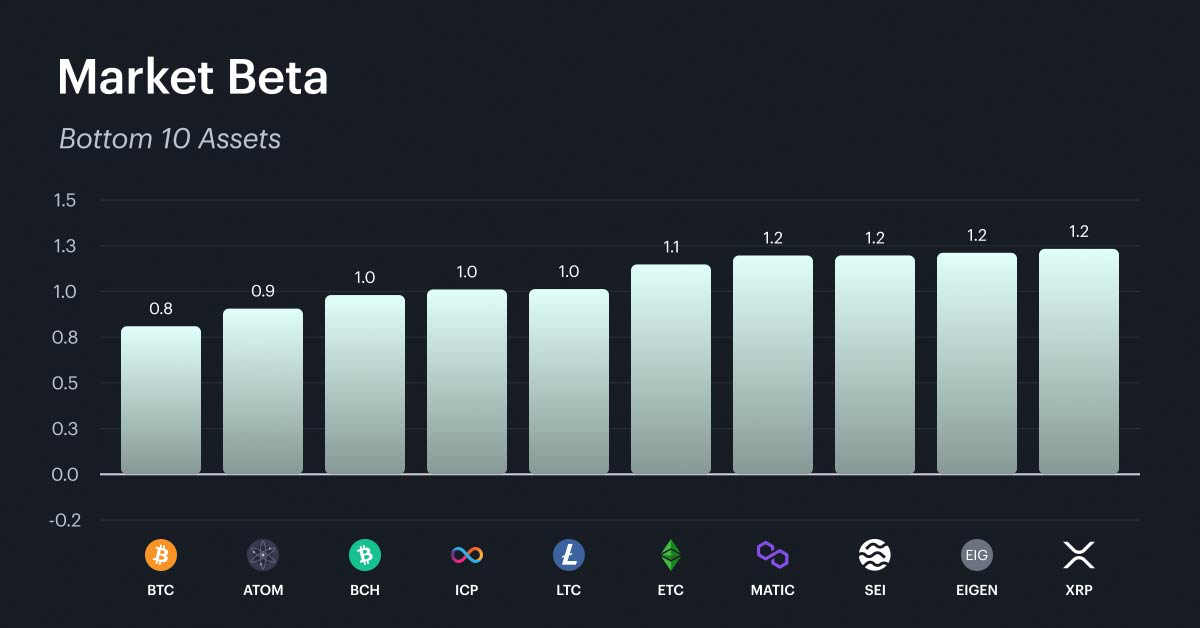
Market beta dispersion remains elevated, with the highest-beta names concentrated among meme coins (PEPE, BONK), newer layer-1 and layer-2 platforms (FTM, SUI, ARB), and infrastructure tokens (LDO, RENDER). These assets amplify directional moves in both directions, and in a market still down over 31% year to date, holding outsized positions in high-beta names amounts to leveraged downside exposure. At the lower end of the spectrum, BTC stands out with the lowest beta in the index at just 0.8, followed by ATOM (0.9) and a cluster of established layer-1s and store-of-value tokens. BTC's position at the bottom of the beta rankings underscores its role as the least volatile asset in the digital asset universe. For investors looking to maintain market exposure while dampening portfolio volatility, rotating toward these lower-beta names offers a more measured risk profile without requiring a full exit from the asset class.
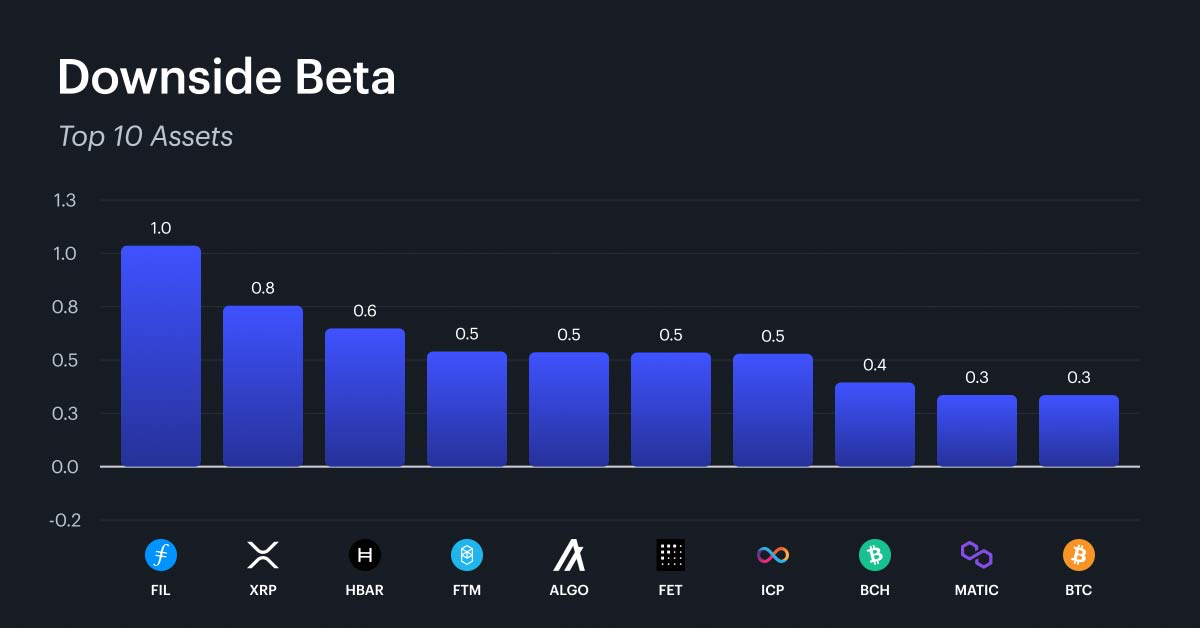
Downside Beta
This week's downside beta rankings show a meaningful broadening of the defensive trade compared to prior weeks. FIL leads with a score of 1.0, followed by XRP (0.8) and HBAR (0.6), with a wider set of mid-cap infrastructure tokens including ALGO, FET, and ICP also carrying positive downside betas. Notably, BTC holds a spot in the top 10 at 0.3, consistent with its structural role as a defensive anchor during sustained drawdowns. The broadening of positive downside beta beyond just the largest names suggests that the flight to quality is filtering into tokens with demonstrated utility and steadier ownership profiles. Investors have a wider set of options for defensive positioning than in prior weeks, though the concentration of the highest scores in FIL and XRP points to idiosyncratic resilience in those names specifically.
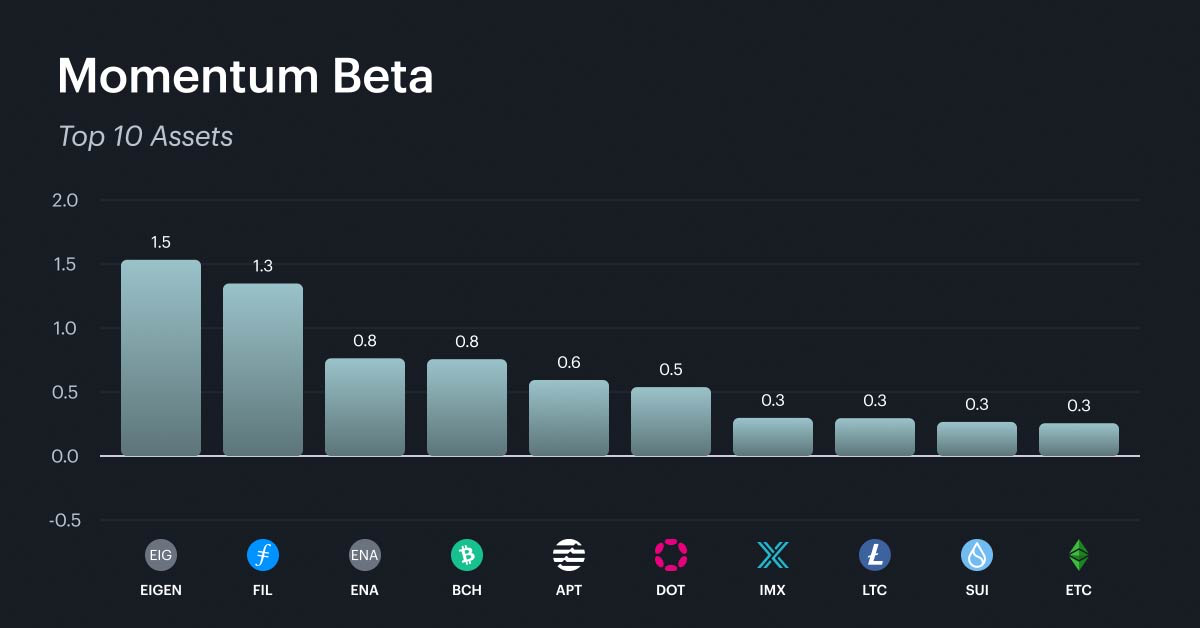
Momentum
Momentum delivered its strongest weekly contribution in several weeks, and the factor's beta rankings reveal where the trend is catching. EIGEN and FIL lead with the highest momentum beta at 1.5 and 1.3 respectively, suggesting these tokens have been the primary beneficiaries of recent price persistence. Notably, EIGEN's position at the top of momentum alongside a deeply negative downside beta highlights a classic risk-reward tension: it has rallied sharply in the recent bounce but would be expected to give back gains disproportionately in the next leg lower. ENA and BCH also rank highly, while the lower end of the top 10 includes IMX, LTC, SUI, and ETC, all clustered at 0.3. Investors adding momentum exposure should do so selectively and with tighter risk parameters until there is evidence of a sustained rally.
What Factors are Driving Markets
Across the Sectors index, the past 30 days have seen broad factor headwinds compound as the drawdown deepened through February. Downside beta, growth, and size have all contributed negatively, with little factor-based shelter available to investors in this category. The scale of the decline underscores the vulnerability of sector-oriented tokens to systematic risk in a prolonged downturn.

The Services index follows a similar pattern, with factor contributions broadly negative over the period. Momentum has offered marginal positive support, consistent with pockets of short-term trend persistence among select mid-cap service-layer tokens. However, outside of that narrow pocket, factor headwinds have been persistent and unrelenting.

The Settlement index continues to diverge meaningfully from the rest of the market. Unlike Sectors and Services, all factor contributions within Settlement have been positive over the trailing 30 days. This is largely a function of index composition: the Settlement category is dominated by large-cap blue-chip tokens like Bitcoin and Ether, which carry outsized weight in the category index. Because the broad market factor reflects the full cap-weighted universe, including significant small-cap altcoin exposure, the market factor itself has contributed more negatively than all other factors combined in the broader indices. Within Settlement, however, the concentration in blue-chip names means that the market drag is far less severe, allowing the positive contributions from downside beta, size, and growth to come through cleanly. This composition-driven divergence reinforces the case for overweighting Settlement-category exposure in risk-off environments, where large-cap layer-1s continue to absorb drawdowns more effectively than the broader market.

Appendix: CF Factor Methodology
Market Factor
The market factor captures the broad, systematic risk that permeates the digital asset ecosystem. It reflects aggregate influences such as macroeconomic conditions, investor sentiment, and overall market volatility. As such, this factor is defined by the daily returns of the CF Broad Cap (Free Float Market Cap Weight) Index, offering a comprehensive and capitalization-weighted representation of the asset class.
Size Factor
The size factor captures the return differential associated with asset scale, reflecting the hypothesis that smaller-cap digital assets tend to outperform their larger-cap counterparts. This effect is understood to compensate for elevated operational and financial risks while exploiting potential market inefficiencies. In this framework, the size factor is defined by each asset’s fully diluted market capitalization. The value is sign-inverted so that higher z-scores are assigned to smaller assets and vice-versa.
Value Factor
The value factor reflects a protocol’s ability to generate economic output relative to its capital base and market valuation, combining measures of both efficiency and user engagement. It is constructed as the average z-score of two key ratios: transaction fees relative to total value locked (Fees/TVL) and daily active users relative to market capitalization (DAU/MCap). This composite metric captures how productively a protocol utilizes its resources while also serving as a proxy for user-driven demand. A higher combined score indicates efficient resource utilization and strong user engagement.
Momentum Factor
The momentum factor captures short-term price persistence by identifying assets that have recently exhibited strong performance. It is computed as the average z-score of two metrics: the 2 weeks cumulative performance and the 2 weeks risk-adjusted cumulative performance. This approach aligns with established findings in traditional financial literature and demonstrates empirical relevance in digital assets, where price trends tend to exhibit momentum over short horizons.
Growth Factor
The growth factor captures the expansion of a protocol’s network activity and user adoption. In the context of digital assets, it reflects metrics such as fee generation and user engagement, which serve as indicators of increased platform utilization and operational scale. The factor is defined as the average z-score of 30-day fee growth and 30-day weekly active user growth, thereby identifying assets exhibiting consistent and measurable increases in underlying network usage.
Downside Beta
The downside beta factor captures an asset’s sensitivity to adverse market conditions by isolating its behavior during periods of negative market returns. Empirical evidence shows that assets with lower downside beta tend to outperform their higher-beta counterparts over the long-term, due to their reduced participation in market drawdowns and more stable return profiles during periods of elevated volatility. As such, it is estimated through a regression of the asset’s daily returns over the most recent four-week period against market returns observed exclusively during negative sessions. The resulting value is sign-inverted to ensure that assets with lower downside exposure are assigned higher z-scores.
Liquidity Factor
The liquidity factor captures the ease with which a digital asset can be traded without significantly impacting its price. Empirical evidence shows that illiquid assets tend to command a higher risk premium than their more liquid counterparts, serving as compensation for trading friction and price volatility. To quantify this, the factor is measured using token turnover, defined as trading volume as a percentage of circulating supply. The value is sign-inverted such that higher z-scores are assigned to less liquid assets.
For further detail, view the CF Factors Methodology Document, the CF Factor Data Suite, and Our paper “A Factor Model for Digital Assets” in Springer Nature’s Mathematical Research for Blockchain Economy
The information contained within is for educational and informational purposes ONLY. It is not intended nor should it be considered an invitation or inducement to buy or sell any of the underlying instruments cited including but not limited to cryptoassets, financial instruments or any instruments that reference any index provided by CF Benchmarks Ltd. This communication is not intended to persuade or incite you to buy or sell security or securities noted within. Any commentary provided is the opinion of the author and should not be considered a personalised recommendation. Please contact your financial adviser or professional before making an investment decision.
Note: Some of the underlying instruments cited within this material may be restricted to certain customer categories in certain jurisdictions.
Implied Volatility Premiums Rise as Macro Risks Loom
Digital assets fell across the board last week as a hotter inflation print and steady ETF outflows met a risk-off market. The decline was uniform, with little to separate large caps; only a value tilt and two DeFi names held up as implied volatility rebuilt a premium.

Mark Pilipczuk
Factor Friday - June 26, 2026
Growth and Value led the factor rankings for the week ending June 25 as momentum-driven positioning continued to unwind - Momentum finished last, extending its YTD loss to -7.14%. Size remains the top YTD performer.
Gabriel Selby
Suspension of itBit Paxos as a Constituent Exchange from Certain CME CF Cryptocurrency Pricing Products
Suspension of itBit Paxos as a Constituent Exchange from Certain CME CF Cryptocurrency Pricing Products
CF Benchmarks
By clicking Accept, you consent to CF Benchmarks's use of cookies.
Visit Cookie Settings to learn how CF Benchmarks uses cookies and to adjust your preferences.