
Feb 27, 2026
Not All Cryptos Are the Same: How CF Factor Data Reveals Sensitivities Across the Digital Asset Taxonomy
A combination of two CF Benchmarks digital asset frameworks - CF DACS and CF Factor Intelligence - paves the way for institutional-grade crypto returns attribution, risk monitoring and strategic implementation.
CF Factor Intelligence x CF DACS
Institutional investors allocating to digital assets have long wrestled with a deceptively simple problem: the asset class is not one thing. A portfolio holding Bitcoin, Ethereum, Chainlink, and Uniswap is not holding four versions of the same exposure. It is holding settlement infrastructure, programmable monetary networks, decentralized oracle services, and a DEX protocol — assets that behave differently, respond differently to market conditions, and carry systematically different risk profiles.
Naming that difference has historically been difficult. Price correlation provides limited granularity. Thematic groupings are useful but informal. What has been missing is a framework that is both taxonomically precise and quantitatively grounded. Till now.
The combined utilization of CF Benchmarks’ CF Digital Asset Classification Structure (CF DACS) and CF Factor Intelligence provides that framework. CF DACS organizes the investable digital asset universe into a consistent hierarchy of Categories, Sub-Categories, and Segments based on the economic function of the underlying protocol. CF Factor Intelligence provides daily factor premia, asset-level factor scores, and rolling factor exposures (betas) across seven systematic factors. Combining the two enables a question that neither tool can answer alone: where, within the taxonomy, are my factor exposures concentrated?
This piece uses that combined lens to examine factor betas estimated across the three top-level CF DACS Categories — Sector Applications, Services, and Settlement — and draws out the portfolio and governance implications.
A Primer on CF DACS Categories
Figure 1: The CF DACS Hierarchy — Categories, Sub-Categories, and Segments
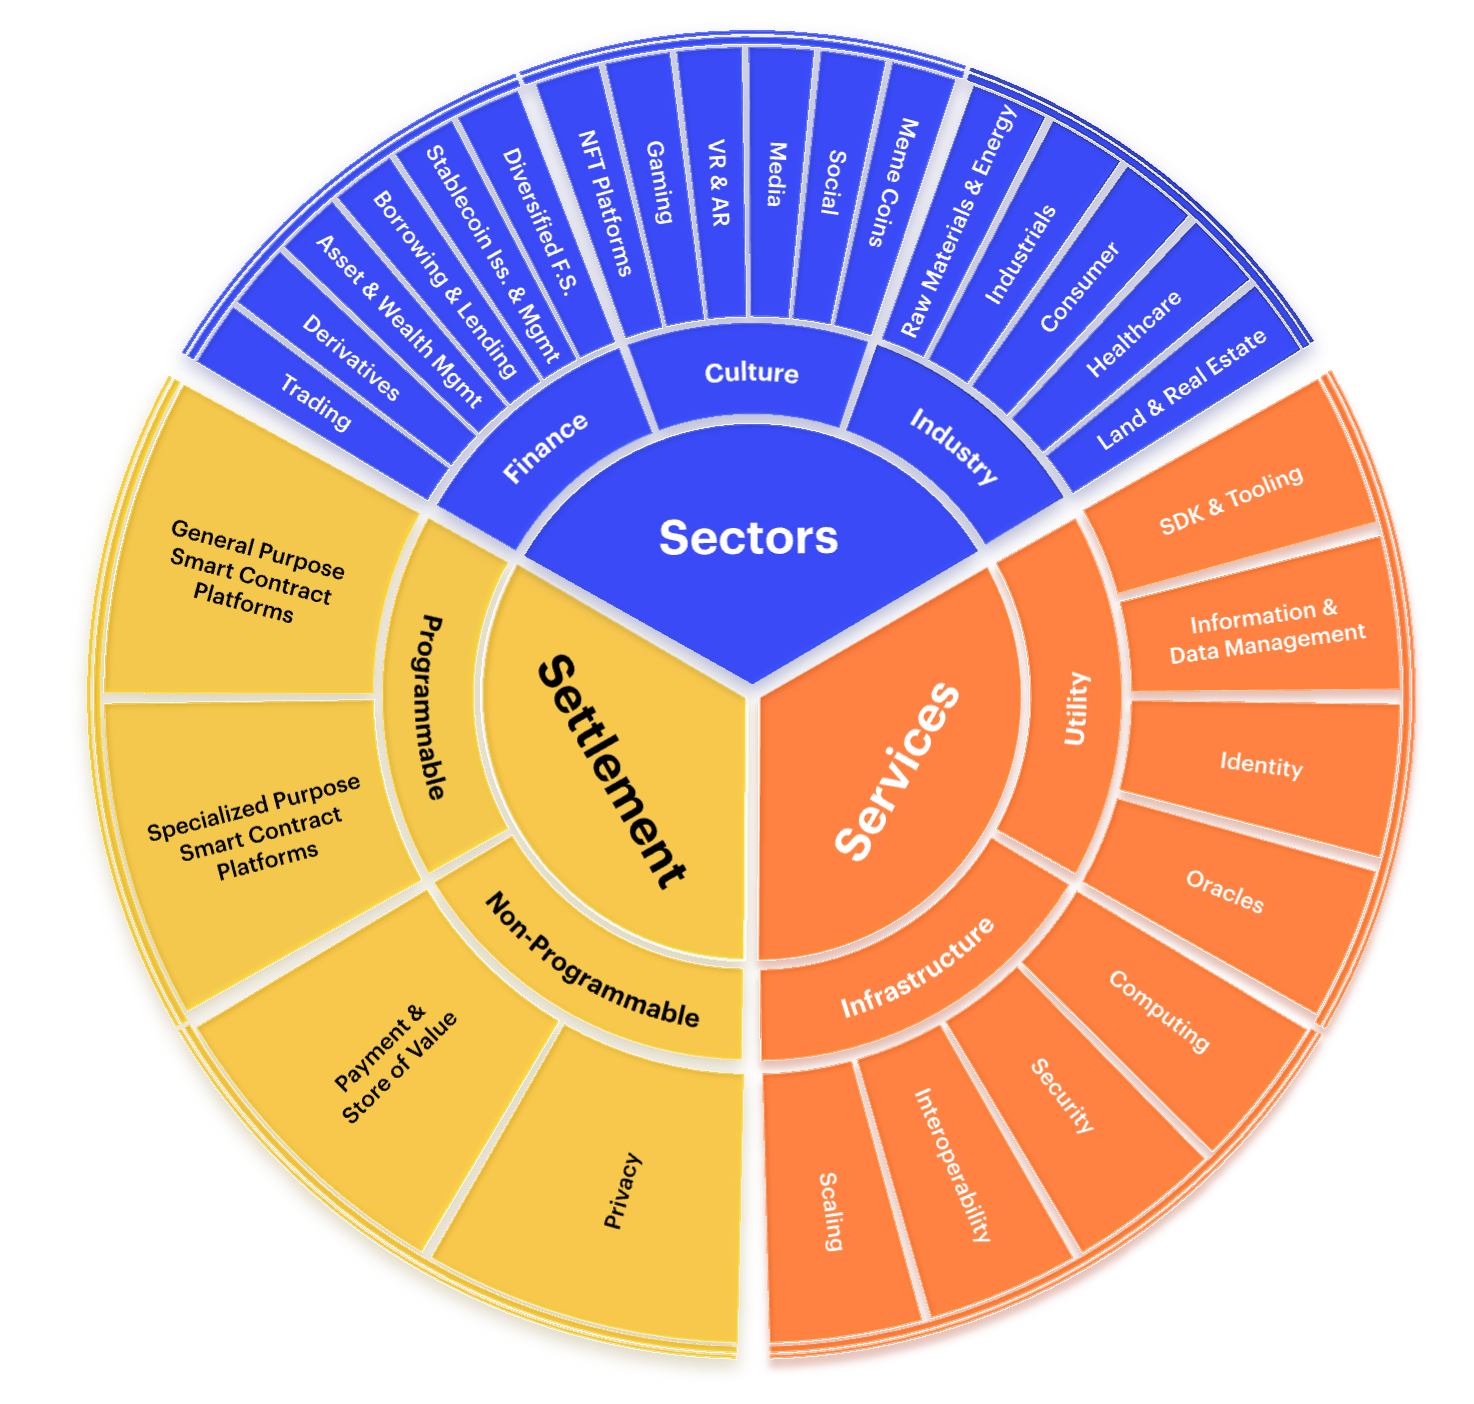
Settlement comprises layer 1 blockchains whose native tokens are required to pay network fees and whose consensus mechanisms underpin final settlement. Bitcoin and Ether are the dominant constituents. Services comprises protocols that provide the infrastructure and utility layer of the blockchain economy — scaling solutions, interoperability protocols, oracles, data management, and developer tooling. Sector Applications (referred to here as Sectors) comprises decentralized applications delivering end-user services: DeFi protocols, NFT platforms, gaming, media, and industry verticals.
The portfolios discussed below are the CF Digital Asset Category Indices — free-float market capitalization-weighted indices that passively track each DACS category and are rebalanced quarterly. The analysis covers the period from March 2025 to February 2026, representing the full available live data history for the underlying data.
Factor betas are estimated via time-series regressions of weekly index returns on weekly factor returns. The resulting coefficients represent the sensitivity of each DACS portfolio to the underlying factors over the observation window and form the basis of the exposure analysis presented here. How these sensitivities evolve as market regimes shift is itself part of the governance story — and the argument for monitoring them continuously.
Settlement: the Anchor
Figure 2: Factor Betas (Weekly) — Settlement - March 10, 2025 – February 19, 2026
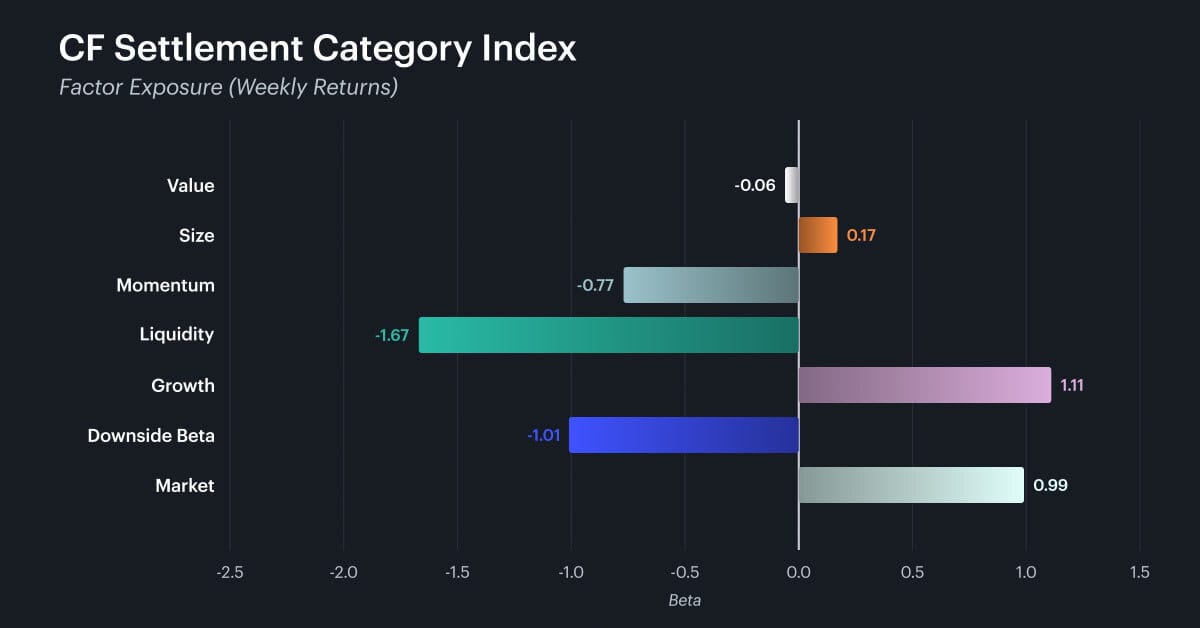
Settlement behaves, in factor terms, much as its composition would suggest. For the Settlement Category, Market beta sits at approximately 1.0 (0.99) at weekly frequencies — confirming that Settlement assets track broad crypto market returns closely and function as the closest thing the asset class has to a market proxy.
Value beta is essentially zero (−0.06, weekly). This is consistent with the CF Factor Intelligence Value definition, which is constructed from on-chain activity ratios — fees relative to total value locked, and daily active users relative to market capitalization. Bitcoin and Ethereum, which dominate the Settlement category by weight, do not generate the kind of usage-relative-to-valuation signals that drive meaningful Value factor scores under this framework. The near-zero reading is not a limitation of the model; it is an accurate description of the portfolio.
Size is positive but negligible (0.17), indicating no meaningful small-cap tilt. This is consistent with a category structurally concentrated in the two largest assets in the investable universe.
Growth presents one of the most notable factor exposures in the Settlement category, with a loading of 1.11. While not the largest exposure in absolute terms within the index, it represents the strongest Growth reading across the three categories and therefore warrants careful interpretation. One plausible explanation is that Settlement assets — which function as the primary entry point and liquidity anchor for the broader crypto market — exhibit heightened sensitivity to ecosystem expansion dynamics, including network adoption and shifts in market risk appetite. The magnitude of this loading suggests that these assets co-move meaningfully with growth-oriented regimes. Monitoring whether this relationship persists or moderates as market conditions evolve is precisely the kind of ongoing governance question the data infrastructure is designed to address.
Liquidity and Downside Beta both exhibit materially negative loadings (Liquidity: −1.67; Downside Beta: −1.01). As the Liquidity factor represents the return differential between less liquid and more liquid assets, the negative coefficient indicates a structural tilt toward the more liquid segment of the market — consistent with the category’s concentration in the largest names. Likewise, the Downside Beta factor measures the relative performance of lower versus higher downside-beta assets; the negative loading therefore implies meaningful exposure to assets that are more sensitive in market downturns. This reinforces the point that scale and liquidity alone do not insulate the category from broader cyclical drawdown dynamics inherent to the asset class.
Sectors and Services: the Amplifiers
The factor profiles of Sectors and Services are materially similar to each other and materially different from Settlement. Both categories display the characteristics of a small-cap, high-activity segment of the market — with correspondingly amplified sensitivities on both the positive and negative sides.
Figure 3: Factor Betas (Weekly) — Sectors
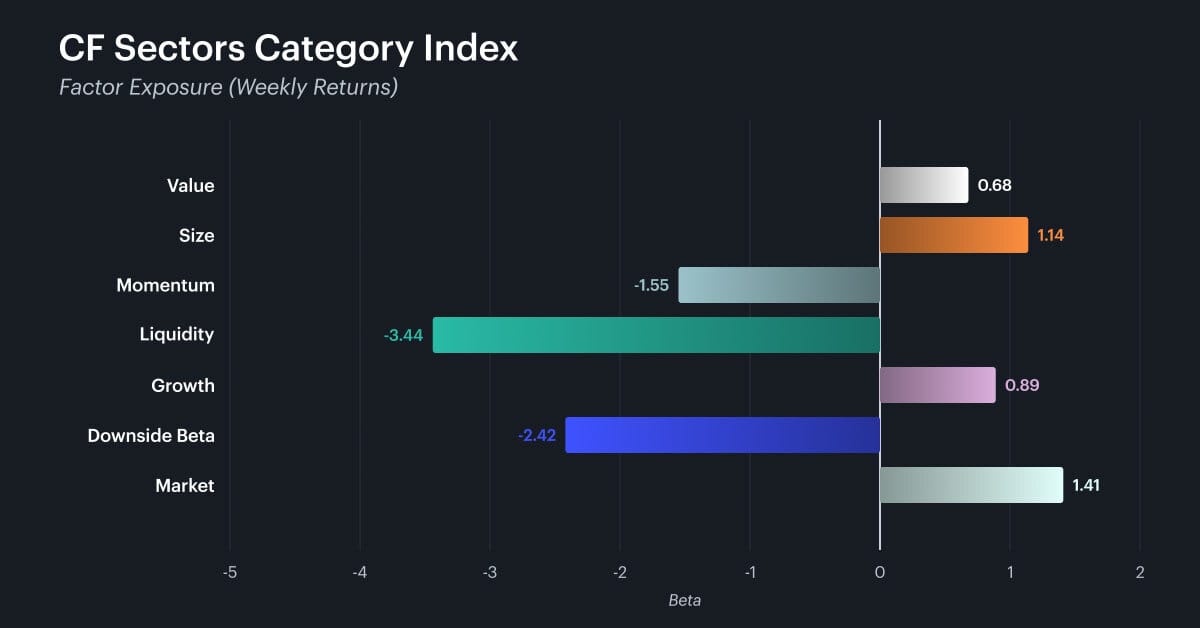
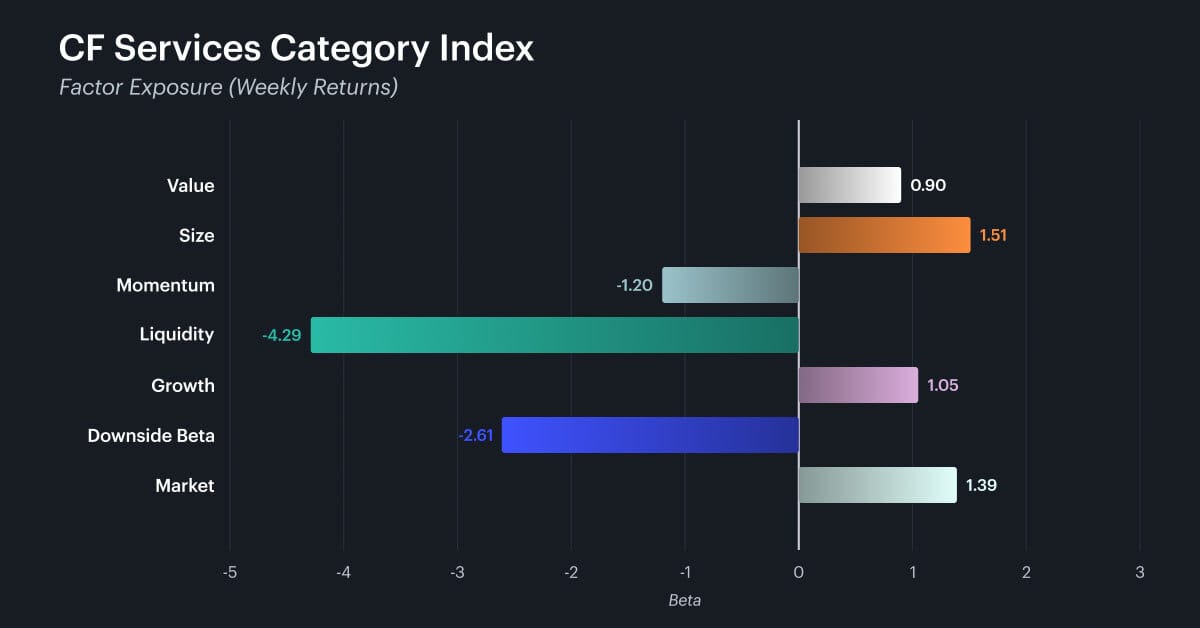
Figure 4: Factor Betas (Weekly) — Services
Higher Market Sensitivity
For both Sectors and Services, Market beta exceeds 1.0 (Sectors: 1.41; Services: 1.39), confirming that these segments amplify broad crypto market movements relative to the Settlement anchor. Size exposure is the most pronounced structural distinction: both categories display materially positive Size loadings (Sectors: 1.14; Services: 1.51), indicating a clear small-cap tilt relative to the large-cap concentration of Settlement. Downside Beta further reinforces this amplified configuration, with more negative loadings than Settlement and therefore greater participation in market drawdowns.
Taken together, elevated Market beta, a pronounced small-cap tilt, and heightened downside sensitivity position Sectors and Services as cyclical extensions of the broader crypto market. Liquidity loadings are also negative across both categories; while material, they do not alter this central characterization.
Growth exposure remains positive for both categories and preserves the broader directional pattern observed in Settlement, though smaller in magnitude. This suggests that while Sectors and Services retain participation in ecosystem expansion dynamics, their defining structural difference lies in their amplified beta and small-cap configuration rather than a uniquely elevated Growth profile.
Other factor exposures are comparatively secondary in magnitude. One distinction, however, is Value: both Sectors (0.68) and Services (0.90) exhibit positive Value loadings relative to the near-neutral profile of Settlement. While small in size relative to the dominant exposures, this slight tilt reflects the greater presence of protocols exhibiting greater economic activity relative to their size, characteristic of application-layer and infrastructure segments.
A Cross-Asset Perspective
A natural extension of the above is whether Sectors and Services — which combine above-market beta, positive Growth and Value tilts, and a pronounced small-cap profile — carry factor characteristics analogous to growth-sensitive instruments in other asset classes, such as small-cap growth equities.
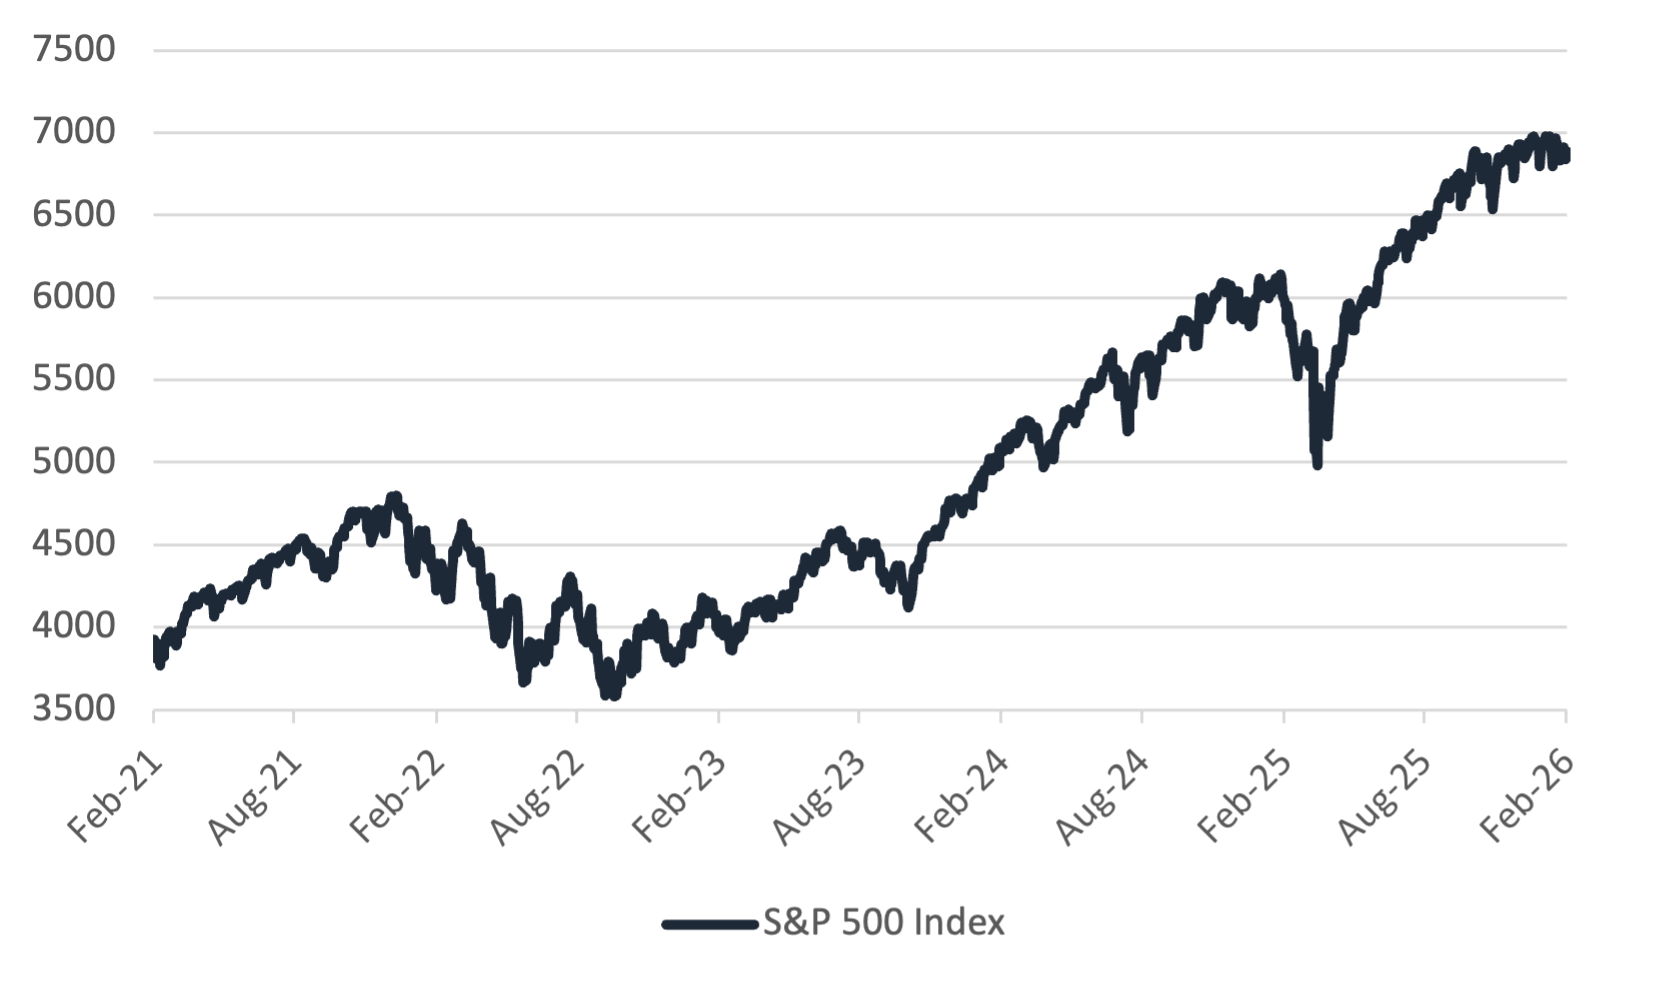
Figure 6: S&P 500 Index — 5-year cumulative return, February 2021 to February 2026
Caveat
A caveat is necessary before this comparison. The crypto factor betas reported here reflect approximately 11 months of live data. The equity factor analysis, using MSCI ACWI and S&P 500 as proxies, reflects a trailing five-year window. These are different observation horizons, and the numbers are not directly comparable. What the comparison offers is qualitative pattern recognition, not quantitative equivalence.
With that framing, the factor profile of Sectors and Services — positive Size, positive Growth,, elevated market beta — is broadly consistent with the profile of small-cap growth equities in periods of risk appetite and accommodative conditions. The 2021 analogy is instructive: in environments characterized by expanding liquidity, rising on-chain activity, and risk appetite, these DACS categories exhibited the kind of factor loading that can serve a growth-proxy role in a cross-asset allocation. The analogy to small-cap growth equities in that cycle is not without merit.
Critically, however, the same factor profile that supports the growth-proxy thesis in risk-on regimes is precisely what generates amplified drawdown exposure in risk-off periods. In the current environment — where the CF Free-Float Broad Cap Index is down 33.5% year to date as of mid-February 2026, and Downside Beta is the only factor in positive territory for the year (+6.5% YTD) — the Sectors and Services factor profile manifests as accelerated loss, not opportunity.
The durable institutional point is that CF Factor Intelligence provides the quantitative infrastructure to test, monitor, and govern these kinds of cross-asset hypotheses with precision — distinguishing between a deliberate tilt toward growth and size-sensitive crypto exposure, and an unexamined side-effect of thematic allocation. That distinction is not available to frameworks that stop at the token or index level.
Governance implications
The combined DACS and factor lens supports two practical workflows that institutional allocators and portfolio managers can integrate into existing risk processes.
Exposure mapping
A portfolio holding across Settlement, Sectors, and Services carries a composite factor profile determined by its weights. Identifying concentrations in underlying factor exposures enables governance teams to distinguish deliberate style tilts from unintended allocation effects. A Sectors-heavy allocation, for example, may embed a structural small-cap growth tilt while also exhibiting materially greater drawdown sensitivity than its nominal weight alone would suggest.
Threshold-based monitoring
Setting governance thresholds on both taxonomy concentration and factor beta drift — and reviewing both periodically — is more precise than either dimension alone. A portfolio that reduces its Sectors weight but sees no change in Downside Beta has not resolved its governance exposure. The factor lens is what makes that visible.
CF DACS and CF Factor Intelligence are designed to work as a combined system. The analysis above illustrates what that combination makes legible — and what it enables institutions to govern.
Conclusion
Digital asset allocation is maturing. The questions institutions are asking have moved on from whether to allocate to how to understand, manage, and account for what they hold. A framework that can only describe crypto by token or by broad market index is no longer adequate for that task.
The factor profiles presented in this piece — estimated across the three top-level CF DACS Categories using live index data — demonstrate that the digital asset universe is meaningfully segmented in systematic risk terms. Settlement assets behave differently from Sectors and Services in every factor dimension measured. Combining the two lenses, taxonomy and factor, produces a portfolio view that neither can deliver alone: where exposures are coming from, how they compound across categories, and where the governance pressure points lie.
For CIOs and PMs, the practical starting point is straightforward: map current holdings by DACS category and assess the resulting exposure profile. A Sectors-heavy allocation may function as a small-cap growth tilt with correspondingly greater sensitivity to cyclical drawdowns, regardless of whether that was the original intent. Making those structural exposures visible transforms allocation decisions from implicit bets into explicit strategy.
CF Factor Intelligence and CF DACS are delivered via the CF Benchmarks API, with daily factor scores, betas, and premia. The capability to
The factor betas presented in this piece are estimated from live index data covering the period from March 2025 to February 2026, representing the complete available live data history at the time of publication. Results reflect the factor sensitivities observed during this period and should not be interpreted as long-run or permanent characteristics of the categories described. Factor exposures are regime-dependent and subject to change. This material is provided for informational and illustrative purposes only and does not constitute investment advice or a recommendation to buy or sell any asset.
Explore More
Click the links below to learn more about CF Benchmarks' Factor Model for Digital Assets, CF Factor Data, CF Factor Intelligence, and the CF Digital Asset Classification Structure.
Read Part 1 of our Factor Data Introduction

Understand CF Factor Intelligence

Read the research paper: 'A Factor Model For Digital Assets'
Explore the CF Factor Data Series
Keep track of digital asset factors with Factor Fridays
The information contained within is for educational and informational purposes ONLY. It is not intended nor should it be considered an invitation or inducement to buy or sell any of the underlying instruments cited including but not limited to cryptoassets, financial instruments or any instruments that reference any index provided by CF Benchmarks Ltd. This communication is not intended to persuade or incite you to buy or sell security or securities noted within. Any commentary provided is the opinion of the author and should not be considered a personalised recommendation. Please contact your financial adviser or professional before making an investment decision.
Note: Some of the underlying instruments cited within this material may be restricted to certain customer categories in certain jurisdictions.
Changes to the Token Market Price Benchmarks Series - Market Prices – 21 July 2026
The Administrator has confirmed changes to the Token Market Price Family for the period 14 July 2026 to 21 July 2026.

CF Benchmarks
Softer CPI Reprices July Hike Risk & Lifts Digital Assets
Digital assets extended their recovery over the past week as cooler US inflation prints repriced Fed expectations; the bid was broad across the large cap indices, growth factor leadership returned, stablecoin funding repriced lower, and stress stayed isolated in names hit by token-specific news.
Mark Pilipczuk
Notice of the Demising of CF Dai-Dollar Settlement Price and Spot Rate
The Administrator announces that it will demise the CF Dai-Dollar Settlement Price (DAIUSD_RR) and CF Dai-Dollar Spot Rate (DAIUSD_RTI) which are members of the CF Digital Asset Index Family.
CF Benchmarks
By clicking Accept, you consent to CF Benchmarks's use of cookies.
Visit Cookie Settings to learn how CF Benchmarks uses cookies and to adjust your preferences.