
May 12, 2022
Why the London Market Close is the best time to strike NAV for new Aussie Crypto ETFs

Our research shows that the calculation of NAV from CME CF Bitcoin Reference Rate at 15:00 to 16:00 London Time is optimal for Australian crypto ETFs
With the first Australian crypto ETFs launched on CBOE Australia today, the question of the optimal time to calculate net asset value—‘strike NAV’ of crypto exchange trade products—is back to the fore.
It’s a dilemma that CF Benchmarks has conducted extensive quantitative research into in recent years.
It’s not a unique one to crypto. Exchange traded commodities products, many of which invest in assets with structural similarities to cryptoassets, have wrestled with the problem for decades.
That is because the time at which NAV is struck has significant downstream impacts for investors. Chiefly, fair, representative and robust ETF valuations demand that net asset value be struck at a time of optimal liquidity.
Doing this enables the ETF to undertake transactions in its underlying commodity as part of the NAV striking process, at a time when the least possible slippage is likely, reducing tracking error and minimising price manipulation risk.
One key difference between ETPs holding international equities or commodities, and ETPs investing in cryptoassets is that crypto is a ‘distributed’, 24/7 market, as opposed to conventional markets which trade on one type of venue, at defined times of the day around the world.
This poses unique challenges for financial products with Bitcoin as the underlying investment.
That is why CF Benchmarks has leveraged its unique position as administrator of the most liquid, established and trusted, regulated Bitcoin benchmark, CME CF Bitcoin Reference Rate (BRR), to determine the optimal time to strike NAV for Aussie Bitcoin ETFs.
We’ve updated and extended our empirical research on the BRR and the optimal time to strike NAV with it, with particular reference to crypto ETPs listed in Australia
Those new to the BRR can understand it in just over 2 minutes by watching the video below.
Findings from this new specific analysis are detailed in our latest research paper: ‘A Time to Strike: Determination of the optimal time for NAV strike of Crypto-asset ETPs listed on Australian Stock Exchanges’.
We summarise its key points below.
Representation and robustness from optimal liquidity
A key aspect of determining the optimal NAV striking time is market representation.
15:00 to 16:00 London Time is the observation window chosen for calculation of BRR. The rationale is illustrated in Figure 1.
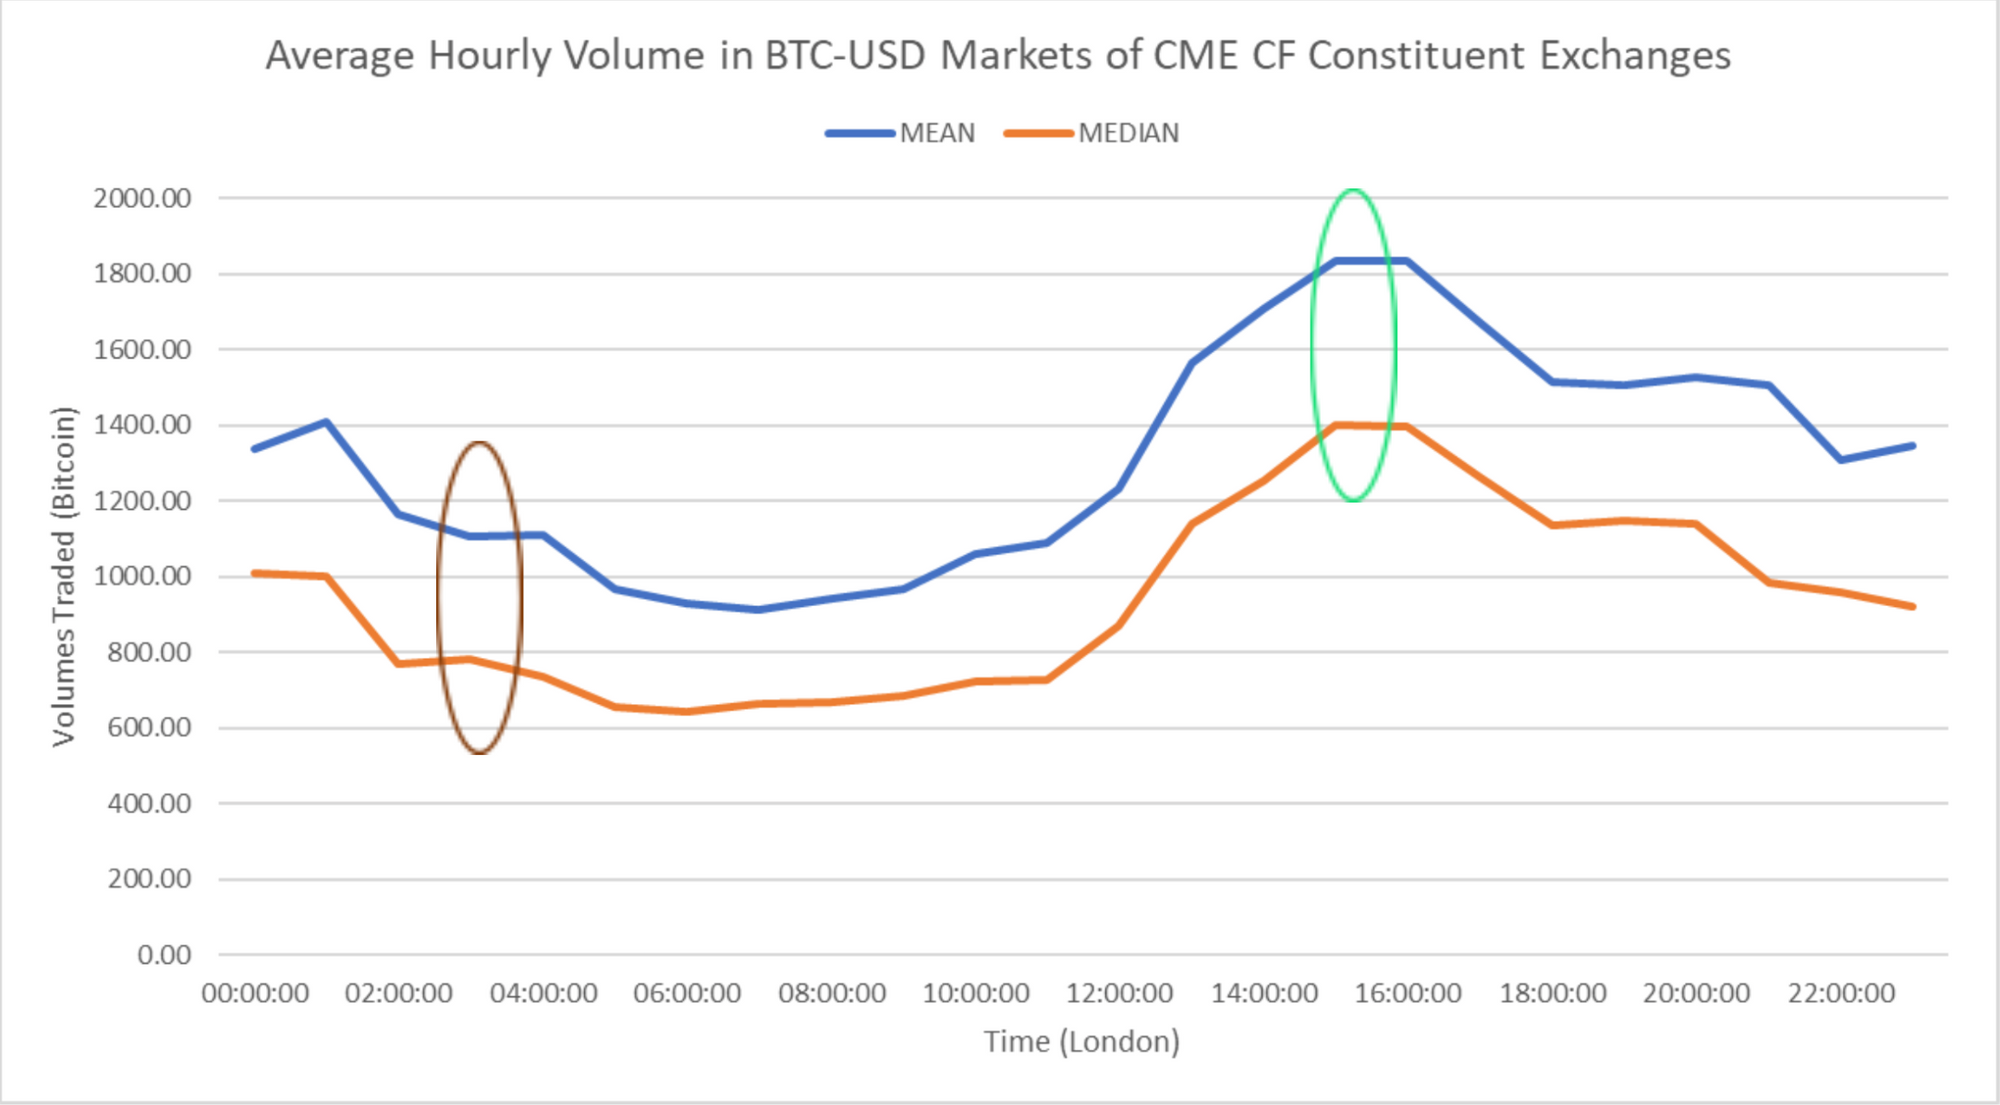
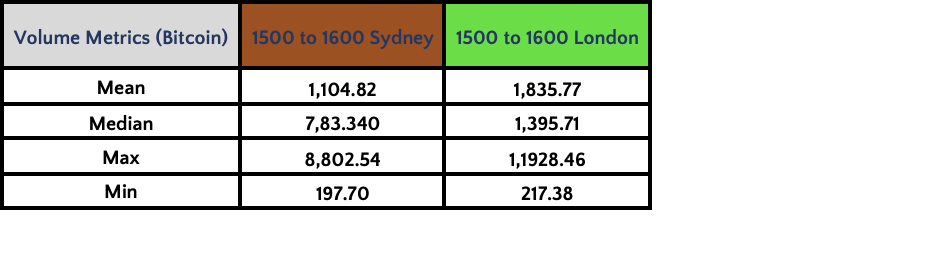
Essentially, the window is the most liquid time of the day. As Table 1 illustrates, the mean and median trading volumes observed at 15:00 to 16:00 London Time are almost double those observed at 15:00 to 16:00 Sydney Time.
London market close, or Sydney?
Now let’s examine how representative of the Bitcoin market the observation window of 15:00-16:00 London Time is for the BRR on a more granular level.
We can do this by looking at the strength of correlations between Bitcoin prices from BRR Constituent Exchanges at that time.
As well, this will demonstrate the best time on the basis that the period of the day evincing the highest liquidity will be the one most resistant to price manipulation.
This exercise will reveal the likelihood of a BRR price being calculated that is unrepresentative of the Bitcoin price at that time of day.
Summary results of a pairwise correlation (AKA cross-correlation) of prices from Constituent Exchanges at the 15:00 – 16:00 London Time observation window are presented below. (See Figure 2 and Table 2).
For comparison, summary results of a pairwise correlation of prices from Constituent Exchanges at an alternative observation window, 15:00 – 16:00 Sydney Time, are also presented.
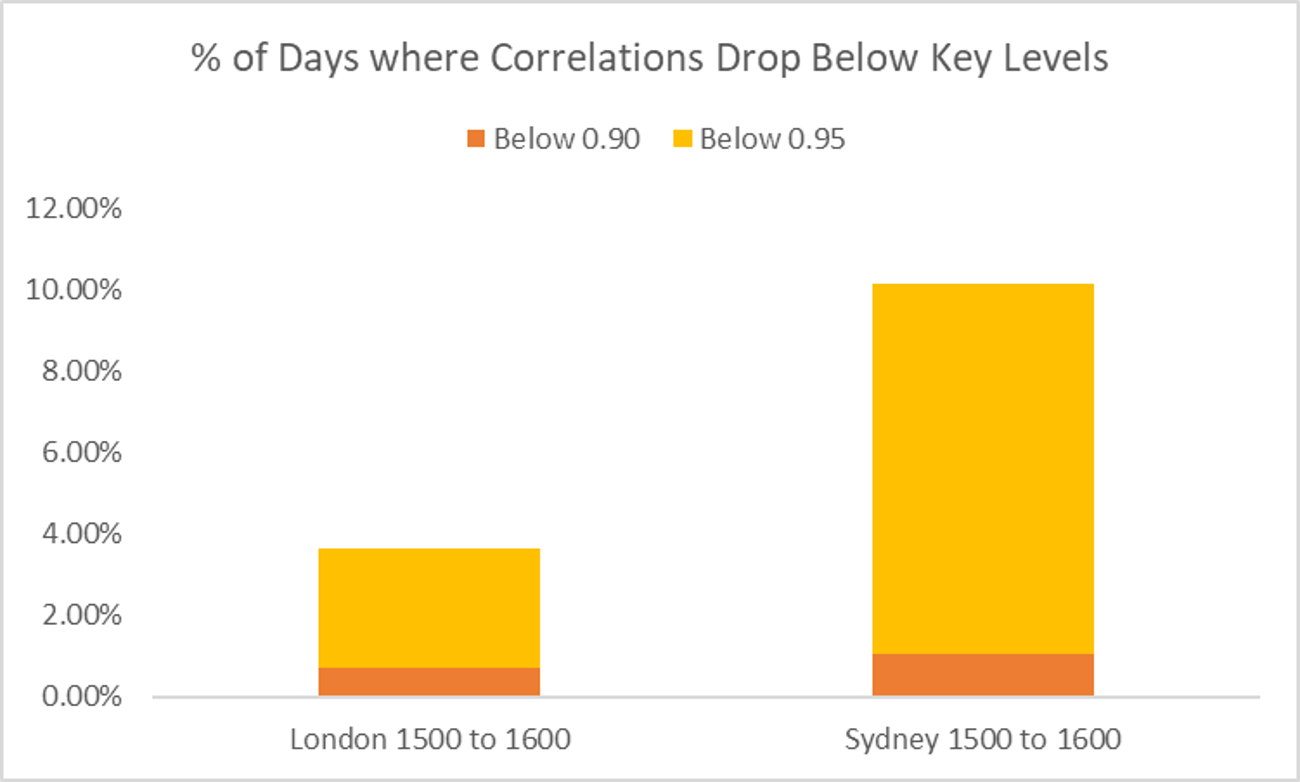

With a higher preponderance of days when correlations dropped below 0.9 and 0.95 shown in the Sydney Time alternative observation window, we can have a high degree of confidence that the London Time is the optimal of the two for NAV striking.
Read or download the research report here.
Read more about CME CF Bitcoin Reference Rate (BRR) here
The information contained within is for educational and informational purposes ONLY. It is not intended nor should it be considered an invitation or inducement to buy or sell any of the underlying instruments cited including but not limited to cryptoassets, financial instruments or any instruments that reference any index provided by CF Benchmarks Ltd. This communication is not intended to persuade or incite you to buy or sell security or securities noted within. Any commentary provided is the opinion of the author and should not be considered a personalised recommendation. Please contact your financial adviser or professional before making an investment decision.
Note: Some of the underlying instruments cited within this material may be restricted to certain customer categories in certain jurisdictions.
Changes to the Token Market Price Benchmarks Series - Market Prices – 20 October 2026
The Administrator has confirmed changes to the Token Market Price Family for the period 13 October 2026 to 20 October 2026

CF Benchmarks
Altcoins Lag as Bitcoin Tests The 50-Day Moving Average
Digital assets fell broadly over the past week as Bitcoin slipped to a moving average, with inflation prints and an equity sell-off in the background. Losses grew with distance from Bitcoin, hitting diversified and smaller-cap exposure hardest, while implied volatility rose.
Mark Pilipczuk
Factor Friday - October 16, 2026
Size led the factor table for a third week at 0.59% as the Market rebounded 0.40% and 15 of 35 Broad Cap tokens closed higher. Momentum fell 1.58% in a rebound led by laggards, and Size's weekly print has narrowed from 8.86% to 0.59% in three weeks, even as its year-to-date lead holds at 22.81%.
Mark Pilipczuk
By clicking Accept, you consent to CF Benchmarks's use of cookies.
Visit Cookie Settings to learn how CF Benchmarks uses cookies and to adjust your preferences.