
Sep 22, 2025
Weekly Index Highlights, September 22, 2025
Market Performance Update
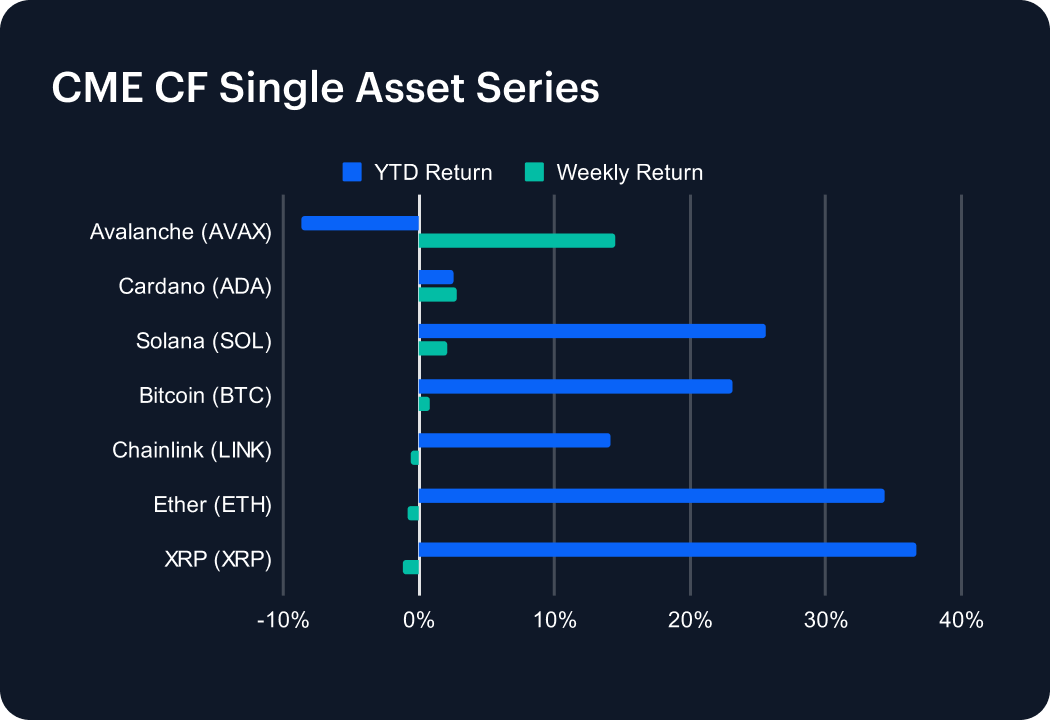
Crypto market performance moderated over the past week, with major assets diverging after an earlier stretch of broad gains. Bitcoin continued to edge higher, adding 0.8% on the week, nudging its year-to-date return to just above 23%. While not a breakout move, BTC’s steadiness provided some resilience amid weaker showings elsewhere. Solana saw a sharp deceleration: after surging 13.5% the prior week, weekly gains cooled to just 2.1%, trimming its YTD return to 25.6%. A similar pattern unfolded in Avalanche, which slipped from a strong 15.5% gain to a more modest 14.5%, though that still helped cut its YTD losses to -8.6%. Among larger-cap altcoins, Chainlink reversed momentum, falling 0.6% after a 4.3% rise the week before. XRP also slipped, down 1.2% week-on-week, with YTD gains softening to 36.7%. The relative underperformance of altcoins against Bitcoin this week reinforces the view that leadership remains concentrated in BTC, with second-tier assets facing more volatility in sustaining year-to-date gains.
Sector Analysis
Sector performance diverged notably, with Gaming tokens again out in front, advancing about 1.9% thanks to double-digit gains in IMX and resilience in GALA. At the other end, Meme Coins dropped roughly 2.6%, with DOGE and WIF weighing on the category. Trading tokens such as UNI and CRV cooled, leaving the sector average down about 0.5% after two weeks of steady growth. Elsewhere, Borrowing & Lending protocols edged higher by about 0.3%, while Asset & Wealth Management held broadly flat, underscoring a week of sector rotation where thematic catalysts shaped performance more than market-wide drivers.
CF Staking Series
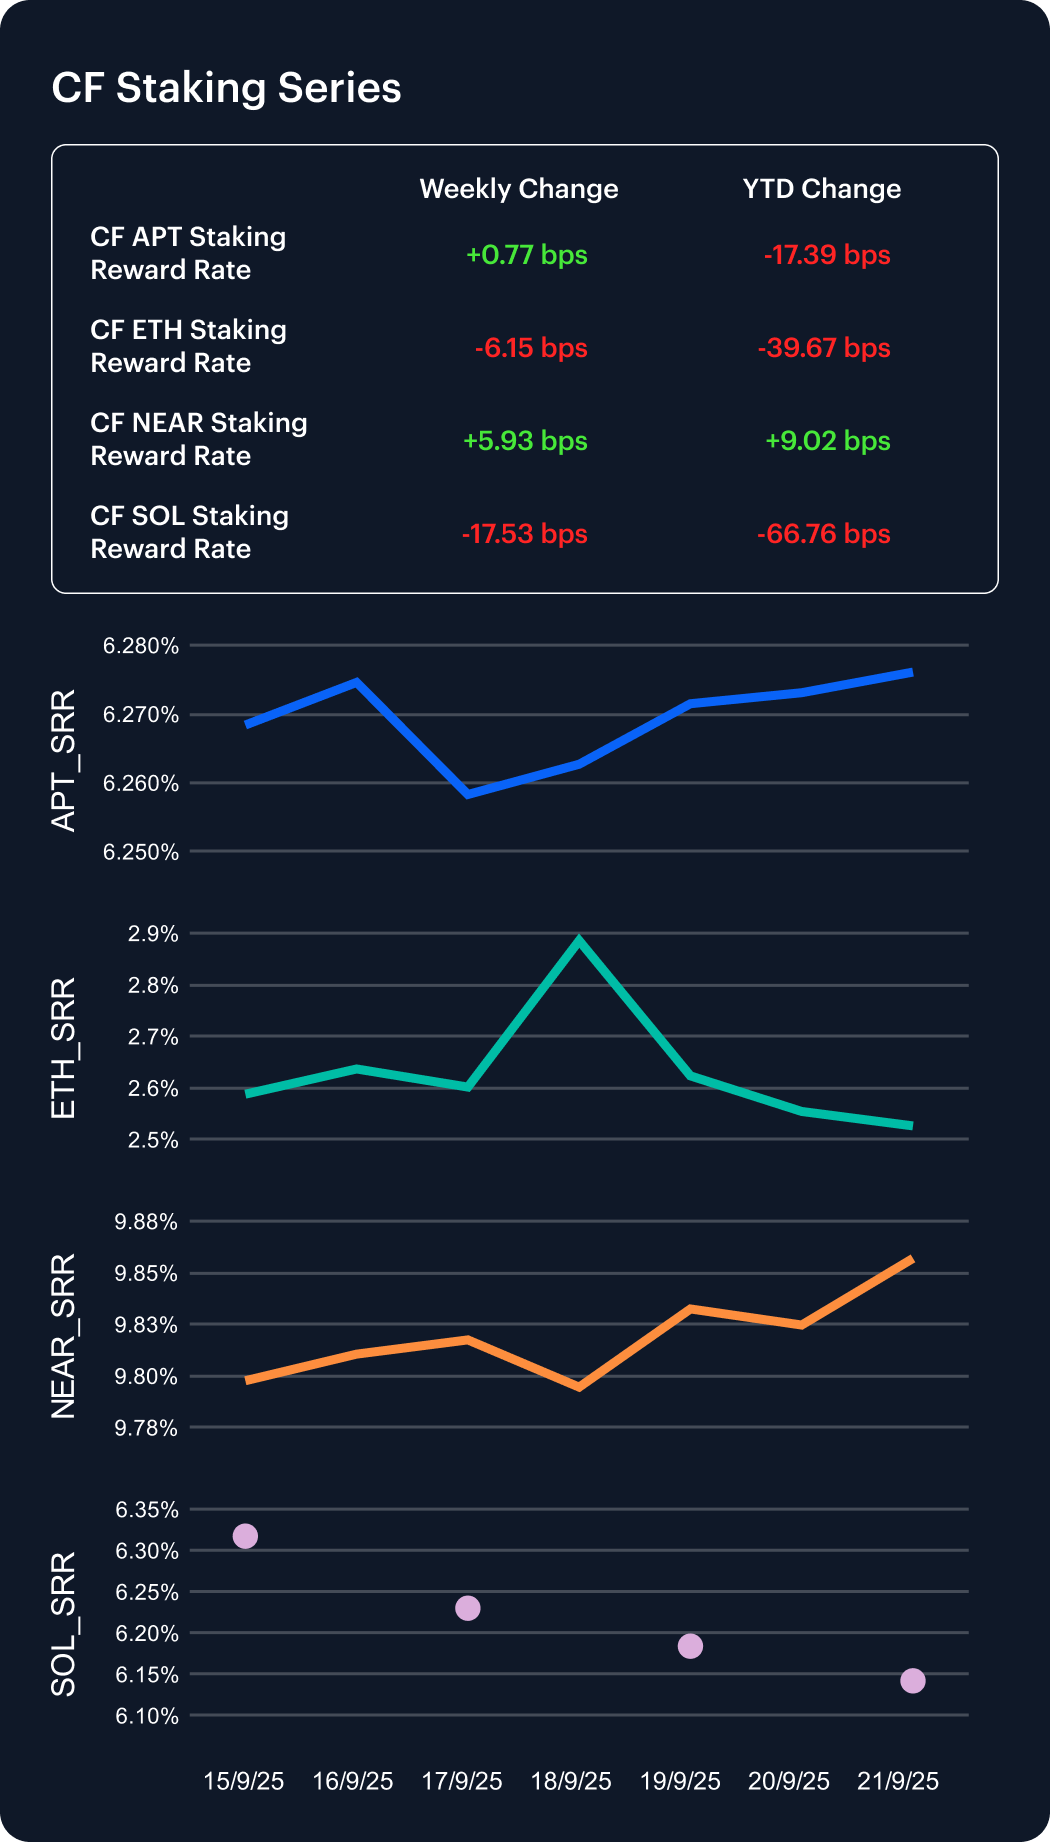
Staking performance split cleanly this week: NEAR (+0.61%) and APT (+0.12%) posted gains, while SOL (-2.77%) and ETH (-2.38%) declined; rate changes echoed the move, with NEAR (+5.93 bps) and APT (+0.77 bps) edging higher against pullbacks in SOL (-17.53 bps) and ETH (-6.15 bps). Year to date, NEAR (+0.92%) remains marginally positive, whereas APT (-2.70%), SOL (-9.80%), and ETH (-13.57%) are still negative—underscoring a week where leadership came from NEAR and APT, with ETH and SOL lagging.
Market Cap Index Performance
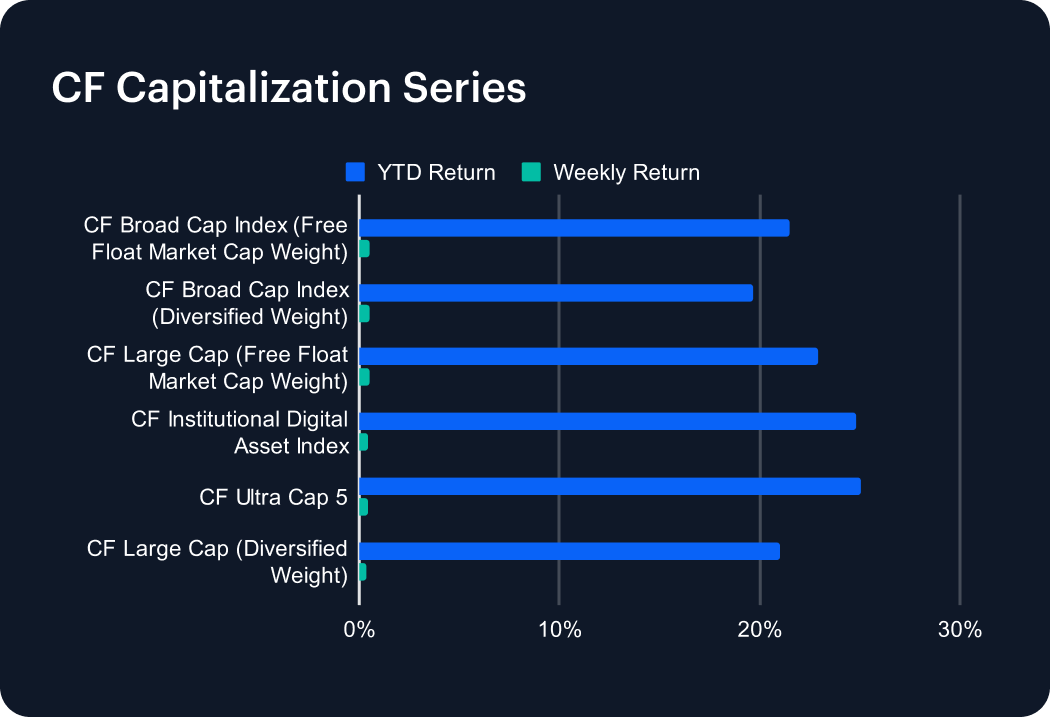
Capitalization-weighted indices showed a marked deceleration, as the broad-based rally of the previous week gave way to muted gains. The CF Broad Cap indices — both diversified and free float weighted — cooled to about 0.5% after advancing more than 5% the week prior, trimming their year-to-date returns to the high teens. The Ultra Cap 5 and Institutional Digital Asset Index each added only 0.5%, down from 3–4% a week earlier, though both still show robust YTD gains of around 25%. Large Cap benchmarks echoed the same pattern, underscoring that leadership narrowed significantly, with Bitcoin providing stability but altcoin weakness weighing on aggregate capitalization indices.
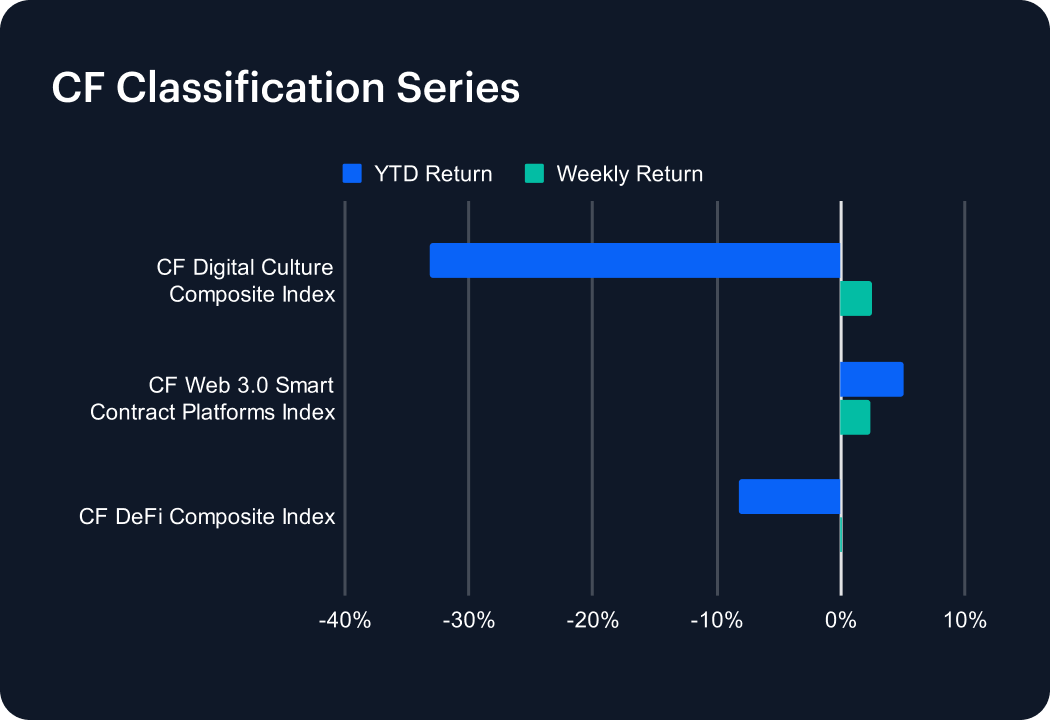
Classification Series Analysis
Thematic performance narrowed considerably after a strong prior week. Smart Contract Platforms came off a robust 7.0% gain and stalled, leaving year-to-date returns modestly positive at around 5%. The Digital Culture Composite also paused after last week’s 5.7% advance, but the sector remains firmly underwater in 2025 with losses of more than 30%. DeFi tokens slipped back into neutral, flat for the week and extending YTD weakness to about -8%. The pullback across classifications underscores how last week’s broad thematic surge failed to sustain momentum, with only Smart Contract Platforms still showing net positive progress for the year.
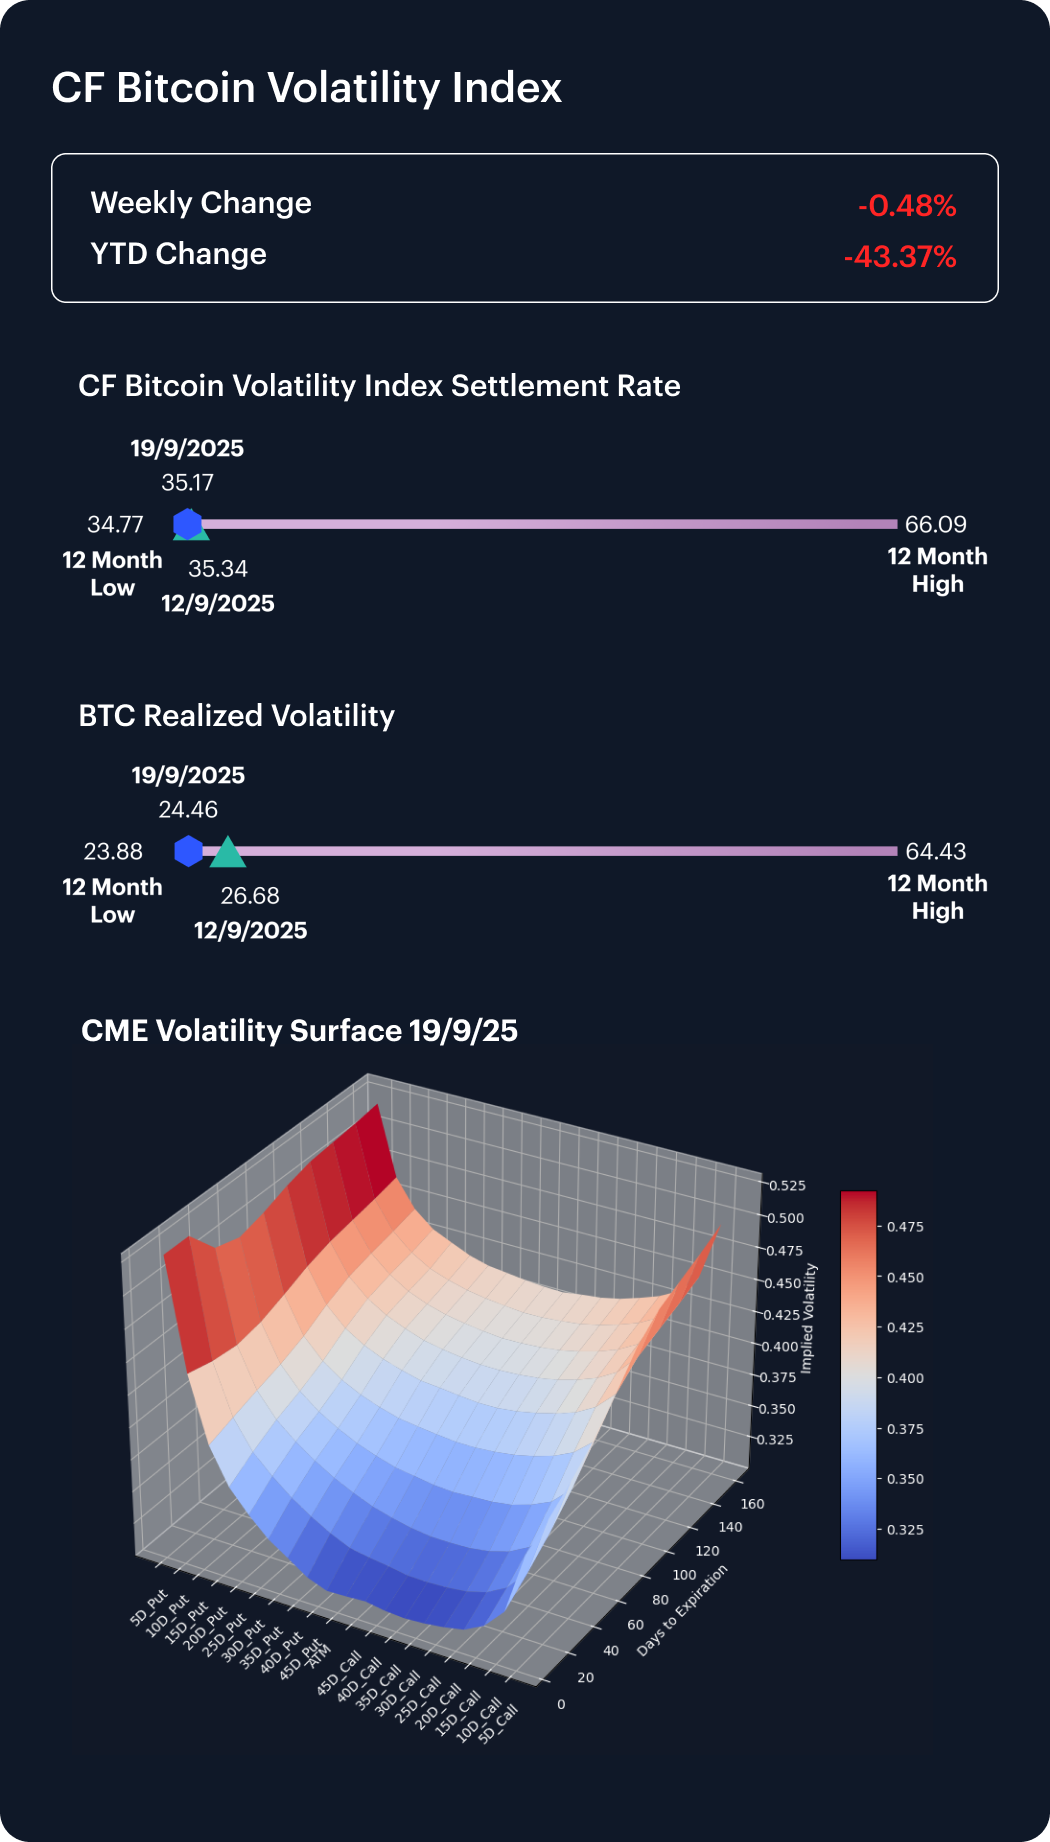
Volatility Analysis
Bitcoin implied volatility eased further, with the CF Bitcoin Volatility Index slipping to the mid-30s after briefly touching 37 earlier in the week. Realized volatility was steady near 27%, underscoring the lack of follow-through in spot price swings. The modest weekly decline extended the broader trend of suppressed option premiums, leaving implied vol down more than 40% year-to-date. With realized and implied metrics converging at historically low levels, market participants continue to price in a relatively calm environment, even as broader crypto indices saw momentum fade.
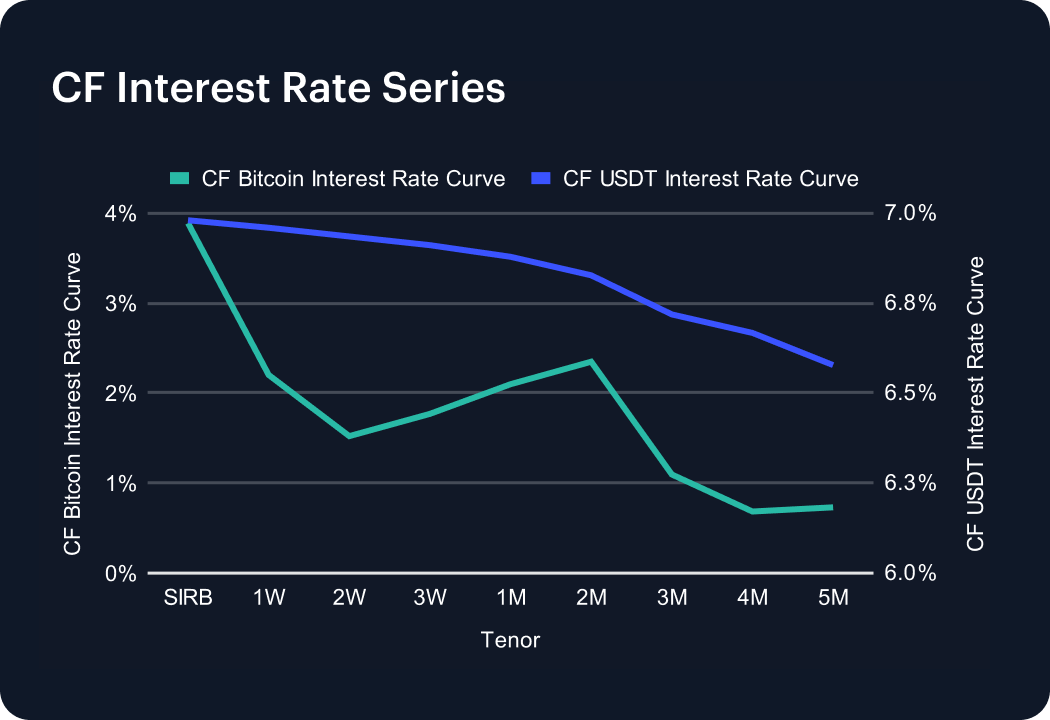
Interest Rate Analysis
The CF Bitcoin Interest Rate Curve showed a dramatic short-end spike, with the spot implied rate climbing from about 1.6% to nearly 3.9%. In contrast, tenors from one week through five months all declined, with the 1M point dropping to just above 2% and the 3M tenor sliding to near 1%. The net effect was a sharp flattening of the curve, pointing to concentrated demand for immediate leverage while medium-term expectations softened. At the same time, the USDT curve shifted higher across the board, adding roughly 120 bps at each tenor, underscoring tightening conditions in stablecoin funding markets. Together, these moves suggest a market dynamic of short-dated stress balanced by more muted forward expectations.
The information contained within is for educational and informational purposes ONLY. It is not intended nor should it be considered an invitation or inducement to buy or sell any of the underlying instruments cited including but not limited to cryptoassets, financial instruments or any instruments that reference any index provided by CF Benchmarks Ltd. This communication is not intended to persuade or incite you to buy or sell security or securities noted within. Any commentary provided is the opinion of the author and should not be considered a personalised recommendation. Please contact your financial adviser or professional before making an investment decision.
Note: Some of the underlying instruments cited within this material may be restricted to certain customer categories in certain jurisdictions.
Changes to the Token Market Price Benchmarks Series - Market Prices – 21 July 2026
The Administrator has confirmed changes to the Token Market Price Family for the period 14 July 2026 to 21 July 2026.

CF Benchmarks
Softer CPI Reprices July Hike Risk & Lifts Digital Assets
Digital assets extended their recovery over the past week as cooler US inflation prints repriced Fed expectations; the bid was broad across the large cap indices, growth factor leadership returned, stablecoin funding repriced lower, and stress stayed isolated in names hit by token-specific news.
Mark Pilipczuk
Notice of the Demising of CF Dai-Dollar Settlement Price and Spot Rate
The Administrator announces that it will demise the CF Dai-Dollar Settlement Price (DAIUSD_RR) and CF Dai-Dollar Spot Rate (DAIUSD_RTI) which are members of the CF Digital Asset Index Family.
CF Benchmarks
By clicking Accept, you consent to CF Benchmarks's use of cookies.
Visit Cookie Settings to learn how CF Benchmarks uses cookies and to adjust your preferences.