
Oct 28, 2024
Weekly Index Highlights, October 28, 2024
Get a quick overview of the week in numbers! Check out CFB's Weekly Index Highlights, covering key trends and the performance of our top reference rates and indices from October 21 to October 27, 2024.
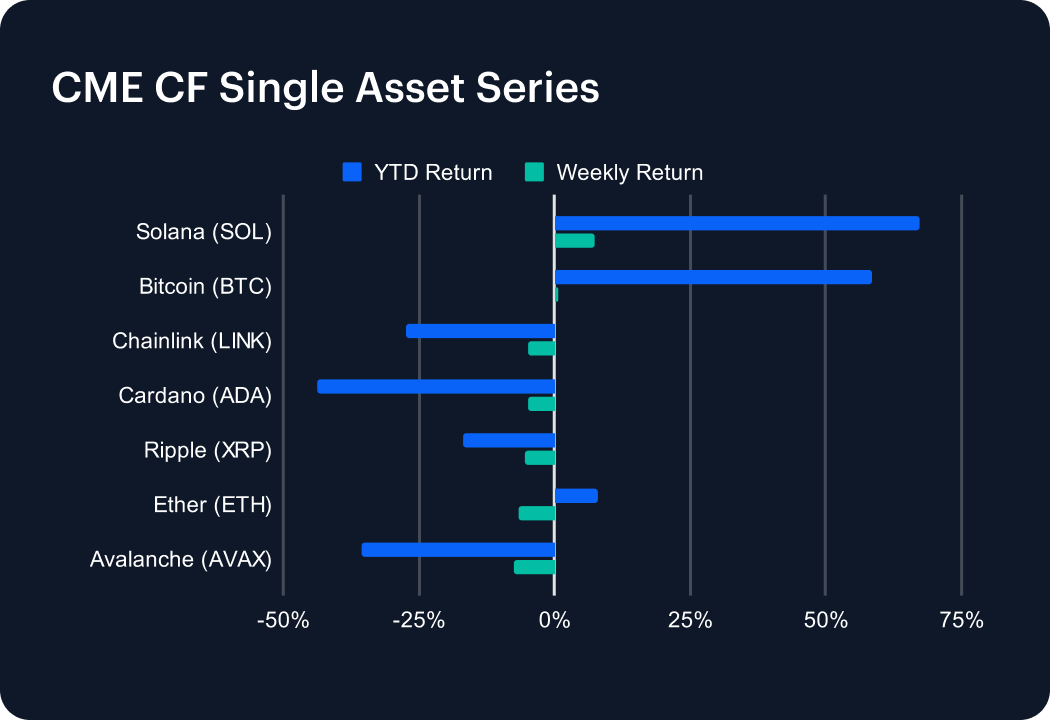
The phrase ‘stalling out’ captures the overall tone of momentum for the past week, among the large and mid-caps, in crypto terms, constituting this series. Only Solana (SOL) posted a definitively positive performance, amid the outbreak of a SOL-minted meme coin trend, promoted by AI agents. SOL rose +7.49% for the week, extending its year-to-date (YTD) return to +67.19%. Bitcoin, 2nd in this series by YTD return, +58.49%, added just +0.59% week on week.
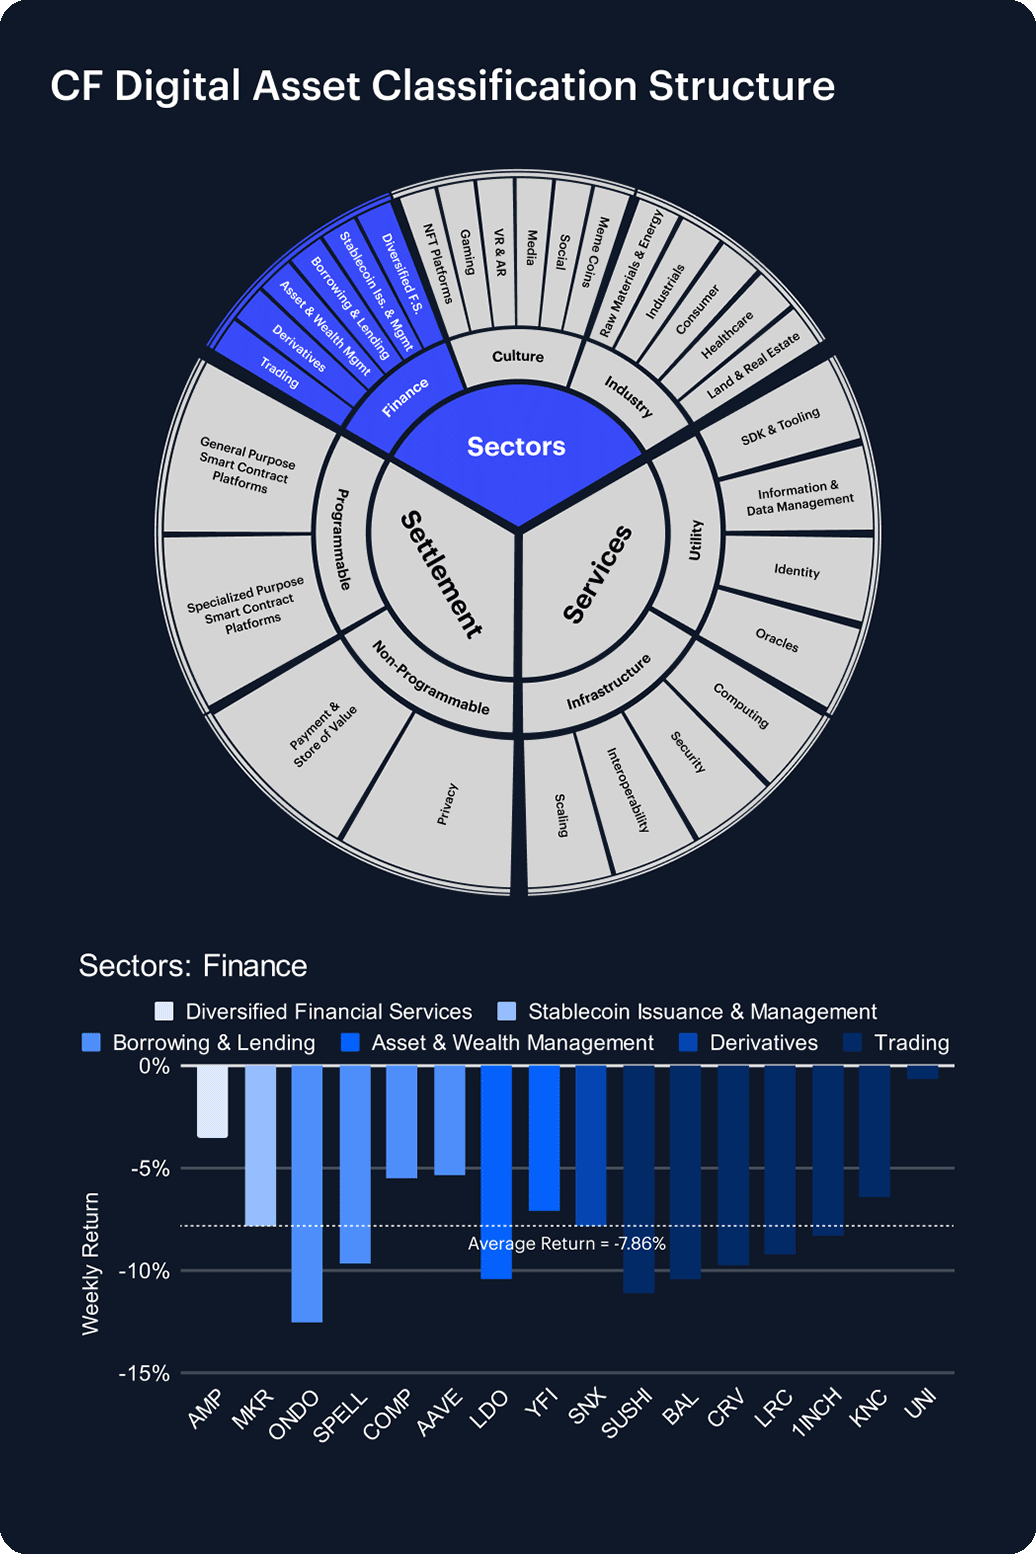
What looks like almost across-the-board profit taking led all Sector Applications, Services and Settlement categories lower, on average, with only a handful of individual risers. As well as gains by Solana (SOL) and Bitcoin (BTC) mentioned above, Helium (HNT), a distributed computing token in the Infrastructure sub-category, added +4.88%; and gaming token SUPER (Culture sub-category), edged +2.02% higher. Even so, Infrastructure retreated by -8.01% overall, and Culture dropped -10.16%, the worst average sub-category performance.
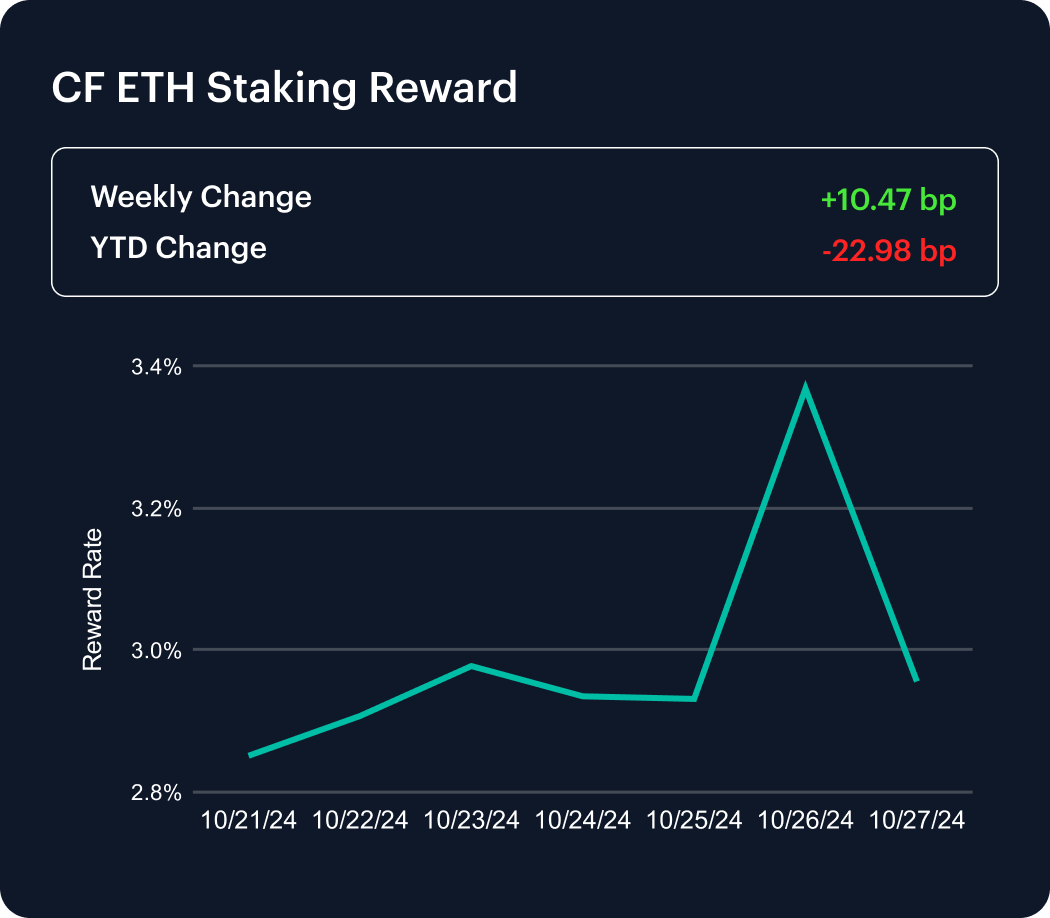
There was an upward spike in the weekly change of ETH staking rewards of +10.47 bp, after two consecutive weeks of negative momentum readings. The YTD change remains deeply in the red though, -22.98 bp.
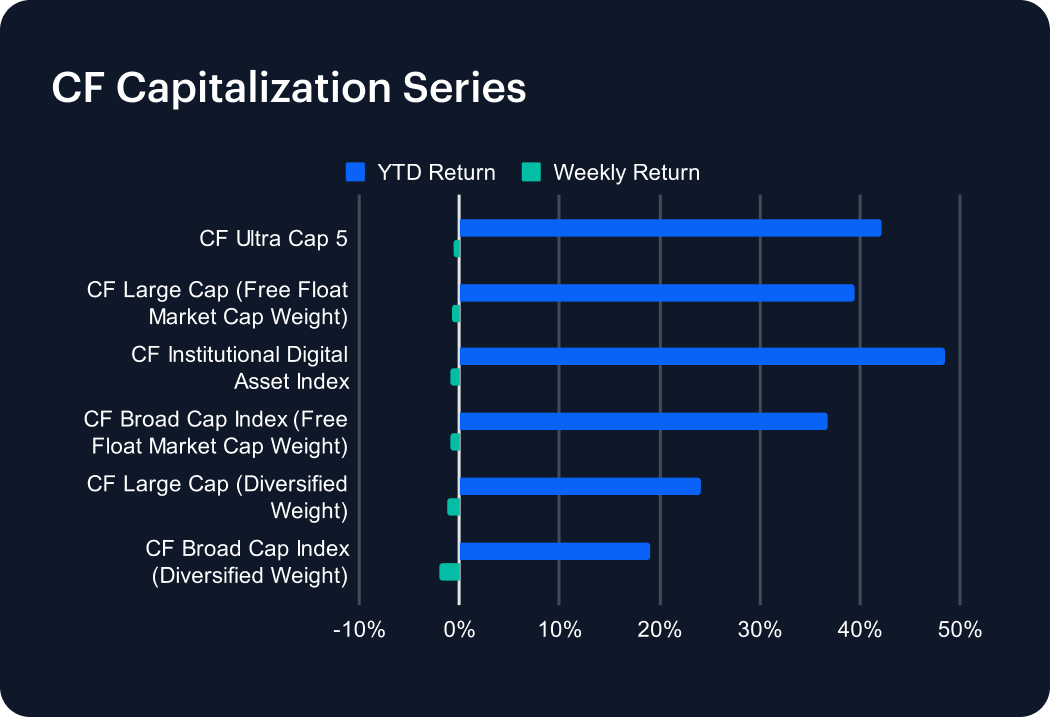
The nominal worst underperformer in a week in which all CF Capitalization Series benchmarks fell slightly, was the CF Broad Cap Index (Diversified Weight), which lost -2.01%. Mega cap resilience is indicated by the relative outperformance of the CF Ultra Cap 5, where the loss was contained to -0.54%.
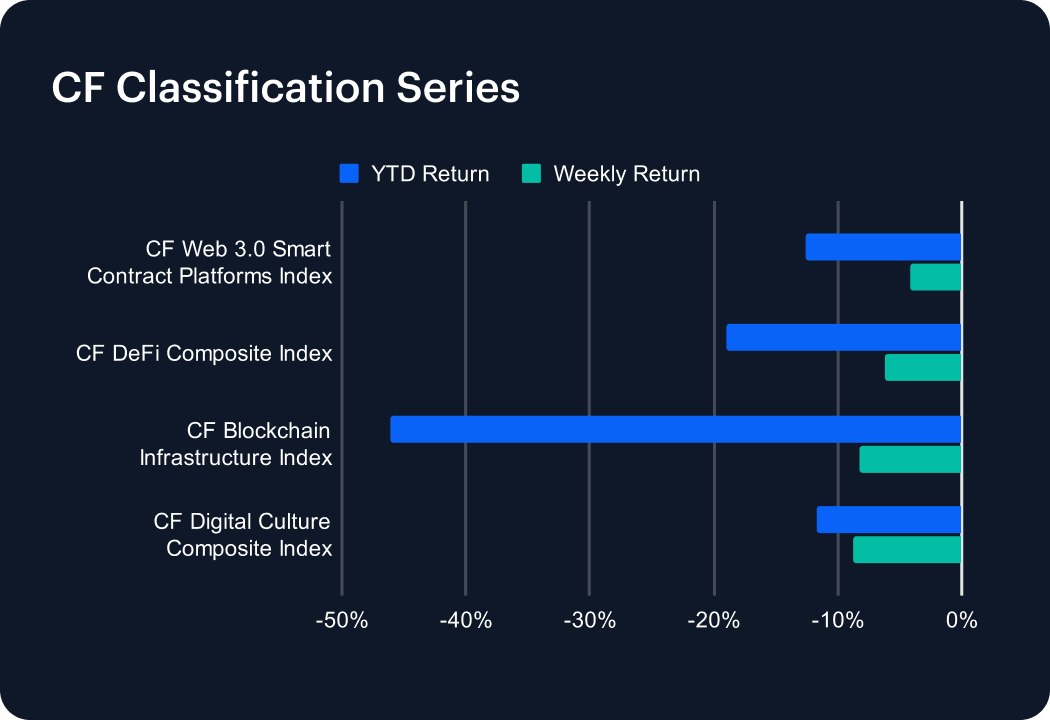
The more pronounced declines of this series relative to the CF Capitalization Series were led by the CF Digital Culture Composite Index, which lost a weekly -8.75%. The CF Blockchain Infrastructure Index was close behind, falling by -8.21%. The CF Digital Culture Composite Index’s weekly fall was notable in that it constitutes the majority of that index’s YTD weakness, -11.75%, while the CF Blockchain Infrastructure Index’s yearly performance was already deeply negative. It now stands at -46.11%.
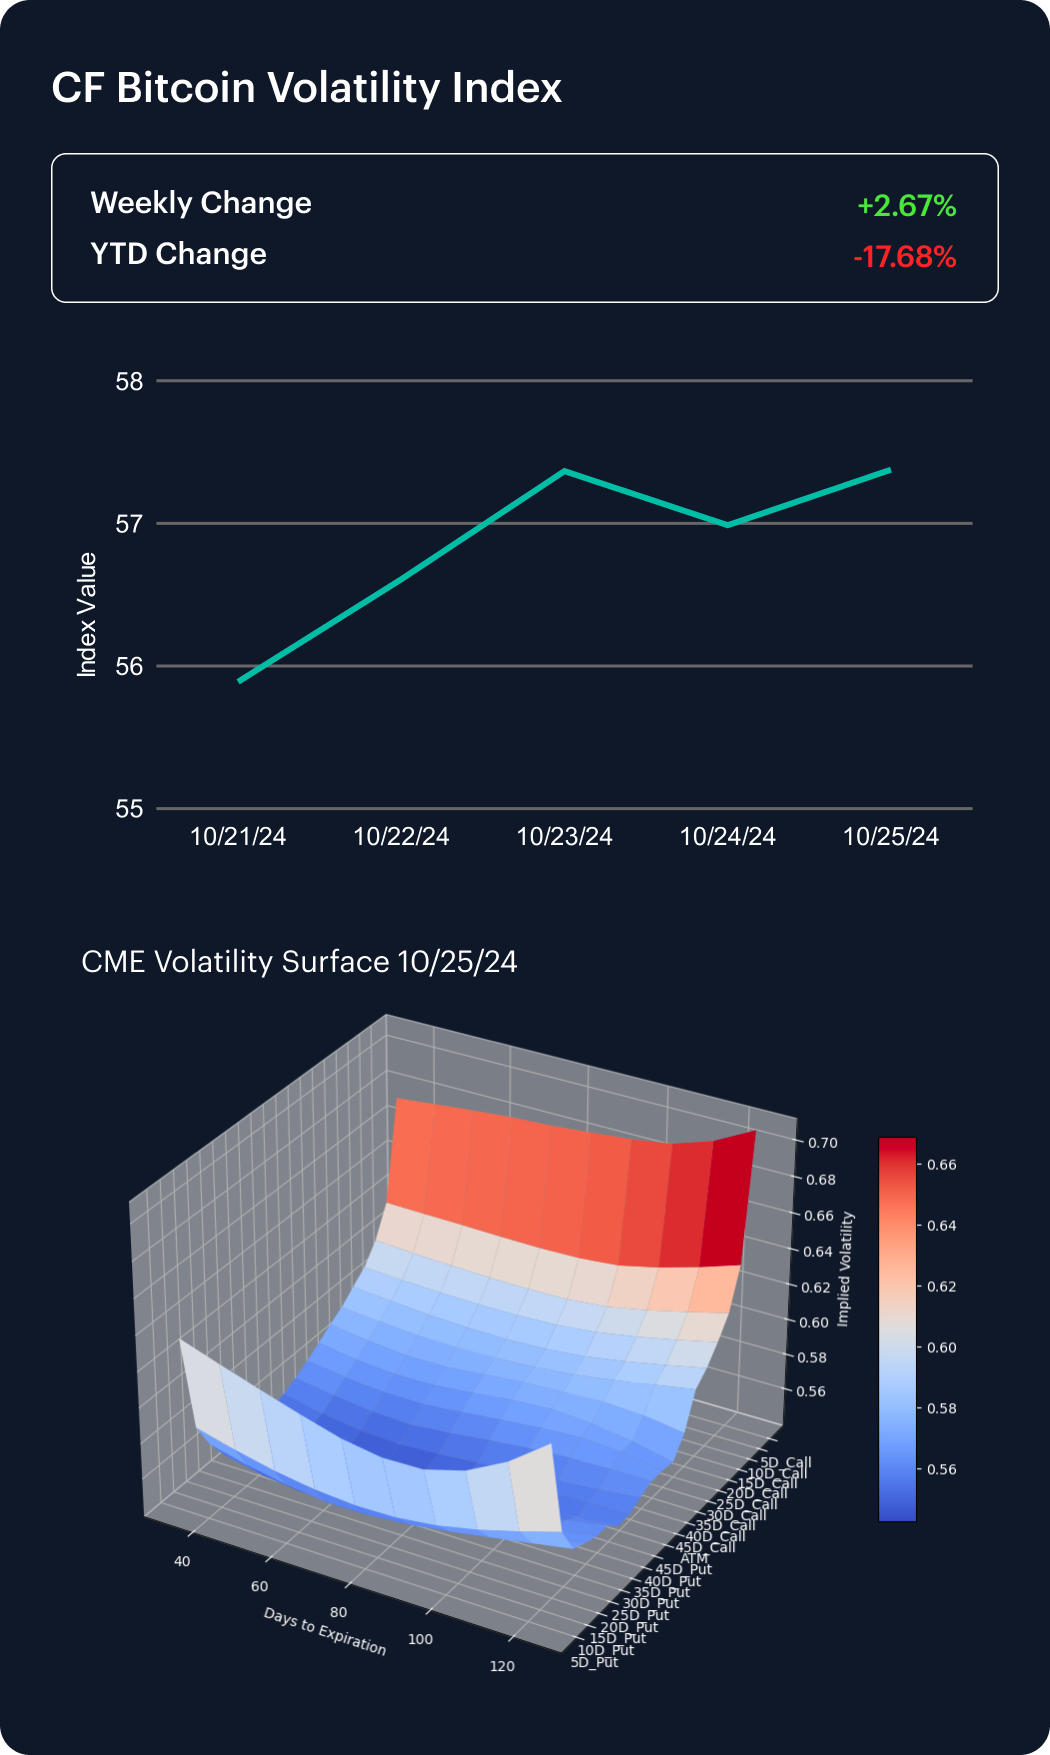
The slope of recent weekly BVXS changes tentatively suggests the trend of CME Bitcoin implied volatility may be simmering higher. The weekly change was +2.67%. For the year though, implied volatility remains becalmed; the YTD change is now -17.68%.
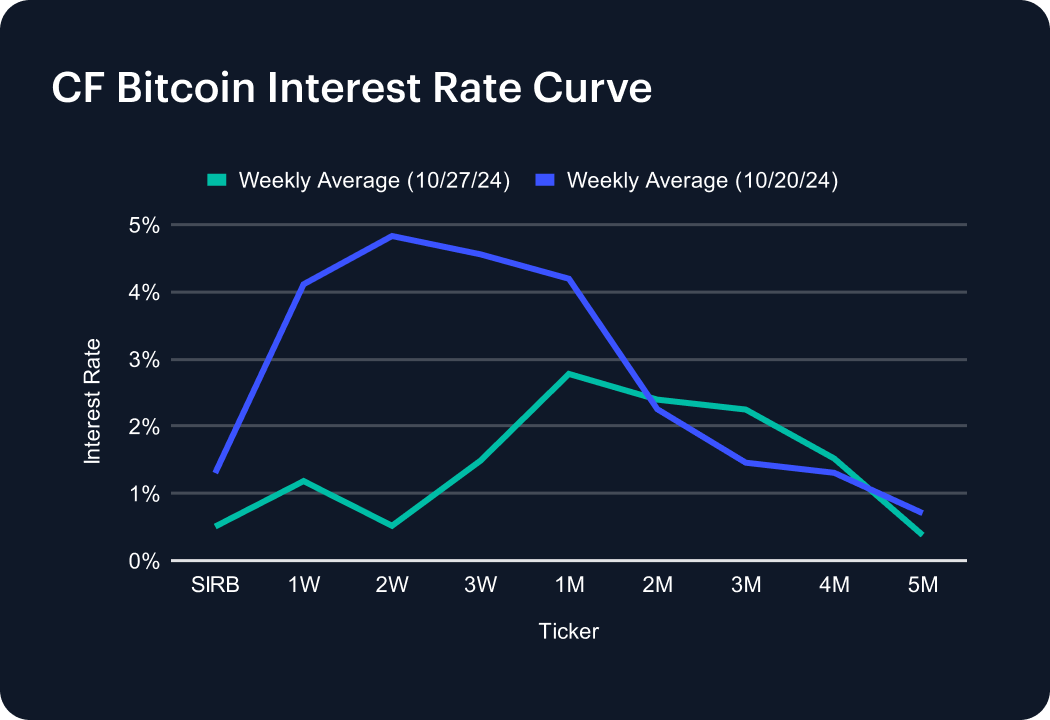
Differentiation across the curve remains modest. Nevertheless, a bell-shaped term structure is emerging, with medium-term tenors showing signs of strengthening relative to shorter and longer-term tenors. Classically, the pattern indicates a transitional phase in economic conditions. In this case that could relate specifically to the blockchain economy. That said, falls by tenors towards the middle of the curve were among the most pronounced of the week. The 3-Week rate slipped approximately 3 bp to stand close to 1.5 bp. The 1-Month rate ticked down 1.4 bp to around 2.8 bp.
The information contained within is for educational and informational purposes ONLY. It is not intended nor should it be considered an invitation or inducement to buy or sell any of the underlying instruments cited including but not limited to cryptoassets, financial instruments or any instruments that reference any index provided by CF Benchmarks Ltd. This communication is not intended to persuade or incite you to buy or sell security or securities noted within. Any commentary provided is the opinion of the author and should not be considered a personalised recommendation. Please contact your financial adviser or professional before making an investment decision.
Note: Some of the underlying instruments cited within this material may be restricted to certain customer categories in certain jurisdictions.
Changes to the Token Market Price Benchmarks Series - Market Prices – 21 July 2026
The Administrator has confirmed changes to the Token Market Price Family for the period 14 July 2026 to 21 July 2026.

CF Benchmarks
Softer CPI Reprices July Hike Risk & Lifts Digital Assets
Digital assets extended their recovery over the past week as cooler US inflation prints repriced Fed expectations; the bid was broad across the large cap indices, growth factor leadership returned, stablecoin funding repriced lower, and stress stayed isolated in names hit by token-specific news.
Mark Pilipczuk
Notice of the Demising of CF Dai-Dollar Settlement Price and Spot Rate
The Administrator announces that it will demise the CF Dai-Dollar Settlement Price (DAIUSD_RR) and CF Dai-Dollar Spot Rate (DAIUSD_RTI) which are members of the CF Digital Asset Index Family.
CF Benchmarks
By clicking Accept, you consent to CF Benchmarks's use of cookies.
Visit Cookie Settings to learn how CF Benchmarks uses cookies and to adjust your preferences.