
Oct 13, 2025
Weekly Index Highlights, October 13, 2025
Market Performance Update
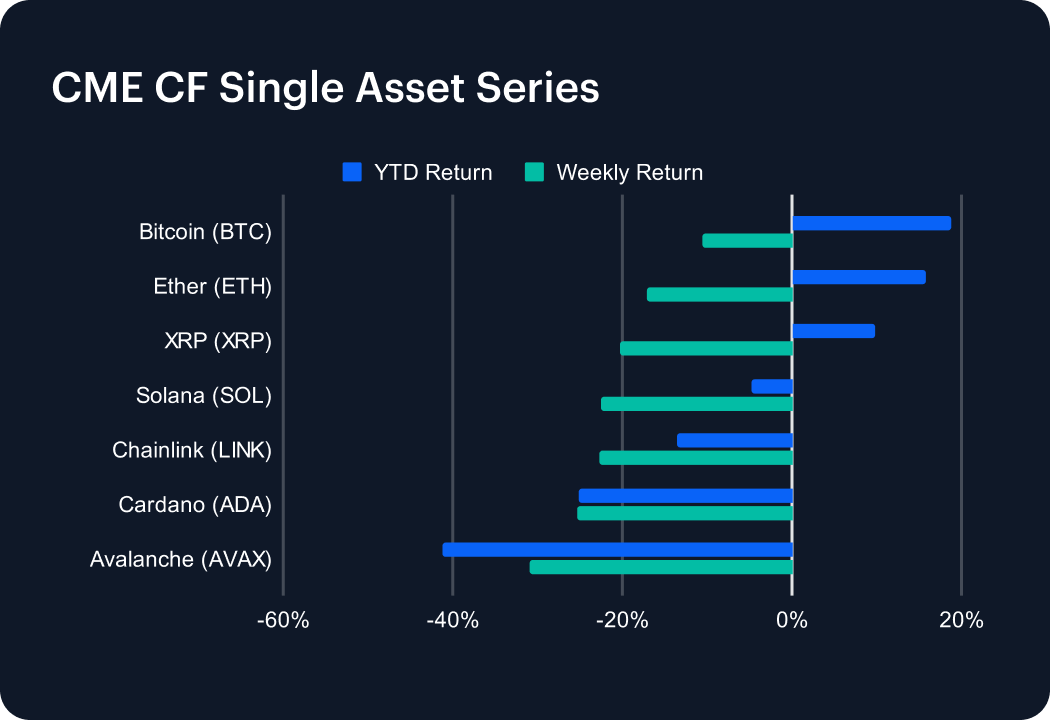
Digital assets fell sharply in the most recent week, as high-beta majors tumbled in step with the broad resurgence of tariff-related market volatility. Bitcoin stumbled −10.61%, lopping its year-to-date (YTD) return down to 18.87%, Ether dropped −17.03%, leaving its YTD gain at 15.78%, while Solana (SOL) collapsed −22.61%, reversing into the red by -4.75% on a YTD basis. The trend was the same for large caps lower down the capitalization tiers, though generally at higher magnitude than for mega caps: Cardano (ADA) −25.24%, Chainlink (LINK) −22.70%, XRP −20.29%; while Avalanche (AVAX) was the worst underperformer, with a −31.01% move lower. The pattern points to broad de-risking, with the heaviest pressure in higher-beta names. To gauge the likelihood and extent of follow-through, participants will be alert to the emergence of any dip buying early in the current week.
Sector Analysis
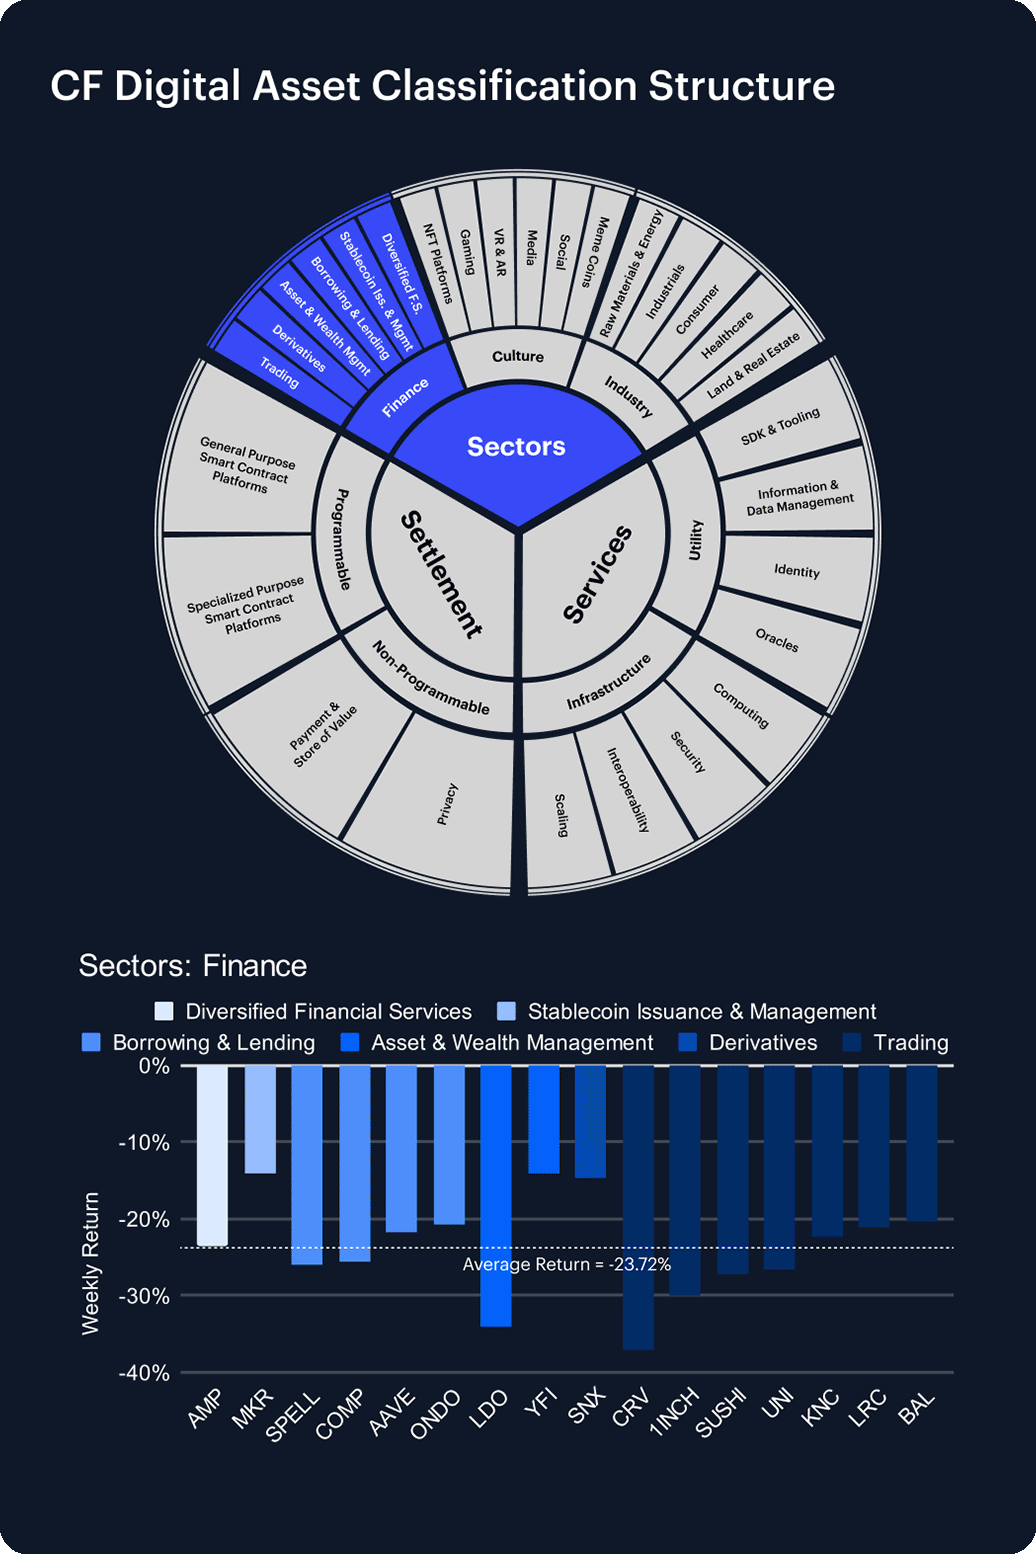
Through the CF Digital Asset Classification Structure (CF DACS) lens, performance was decisively lower week-on-week, albeit with dispersion across cohorts. Store of Value & Payment (Settlement) was the relative hold-out at −16.93% w/w, while Scaling (within the Infrastructure sub-category) printed down −27.39% and General Purpose Smart Contract Platforms retreated −26.22%. Sector cohorts weakened as Finance fell −23.72%, and the Utility Sub-Category fell −28.72%, led by the 34% slide of BICO, with Chainlink (CHAIN) losing -23%. Within Culture, Gaming underperformed particularly sharply with PRIME dropping −28.31%, and SuperVerse (SUPER) losing 32.87%. In short: a largely typical beta-led unwind, with Infrastructure and Services sliding in tandem while attention-leading segments fared the worst.
CF Staking Series
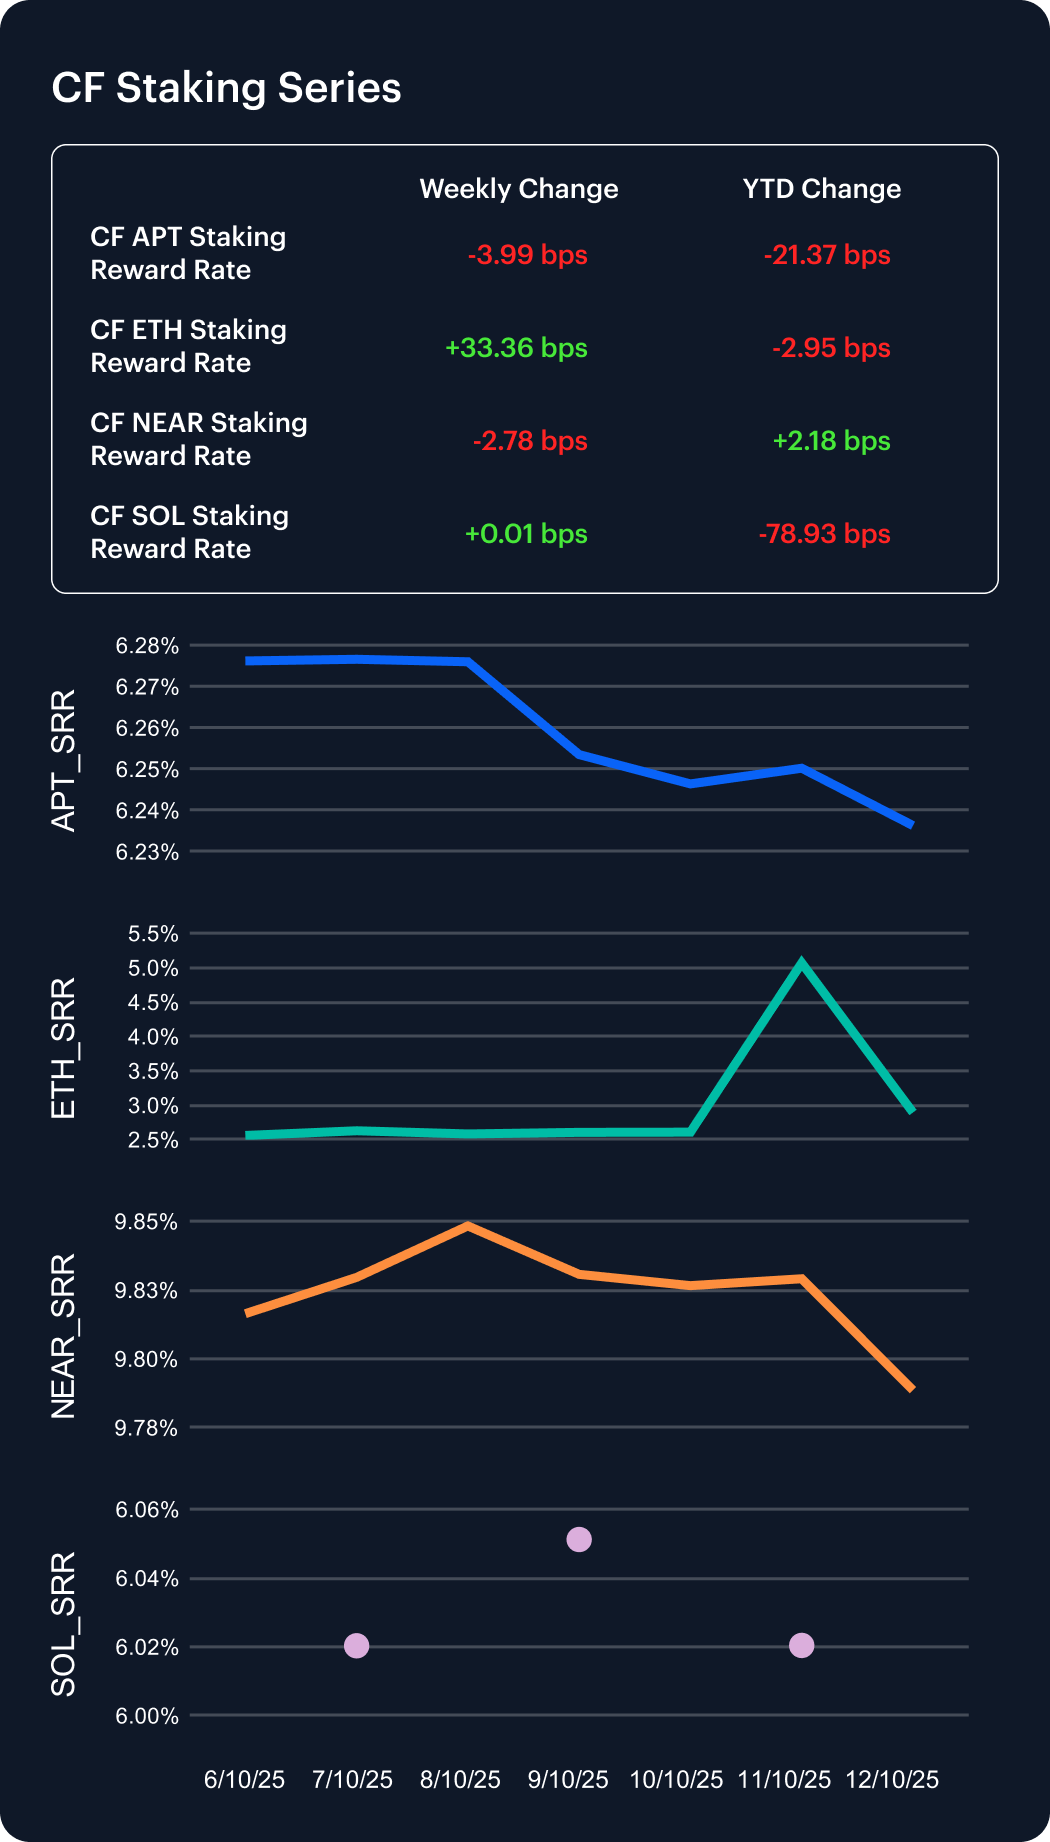
A mixed performance pattern emerged among our CF Staking Series indices amid last week’s episode of market turmoil. ETH staking rose +13.03%, with a +33.36 bps reward-rate change, while SOL staking was essentially flat, rising just +0.01 bps. By contrast, APT staking slipped −0.64% (−3.99 bps) and NEAR edged −0.28% (−2.78 bps). Potential causality is difficult to interpret, though net-net, carry conditions improved in ETH, were unchanged in SOL, and softened modestly in APT and NEAR.
Market Cap Index Performance
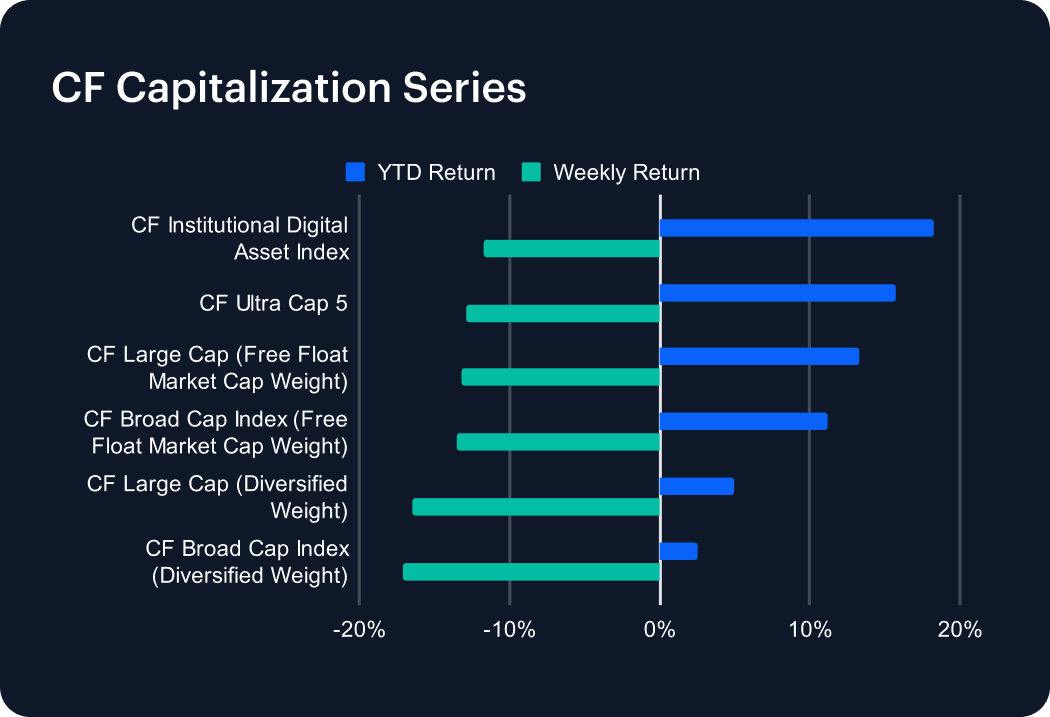
Moves were consistently lower across size tiers, reflecting some orderliness, to an extent, in the broad down move. The CF Broad Cap Index (Diversified Weight) fell −17.06%, CF Large Cap (Diversified Weight) was down −16.44%, CF Ultra Cap 5 lost −12.89%, and the CF Institutional Digital Asset Index moved −11.70% lower. Rank-ordering suggests deeper drawdowns further down the breadth stack, consistent with a liquidity-seeking de-risking. Note that Ultra Cap and Institutional cohorts outperformed on a relative basis.
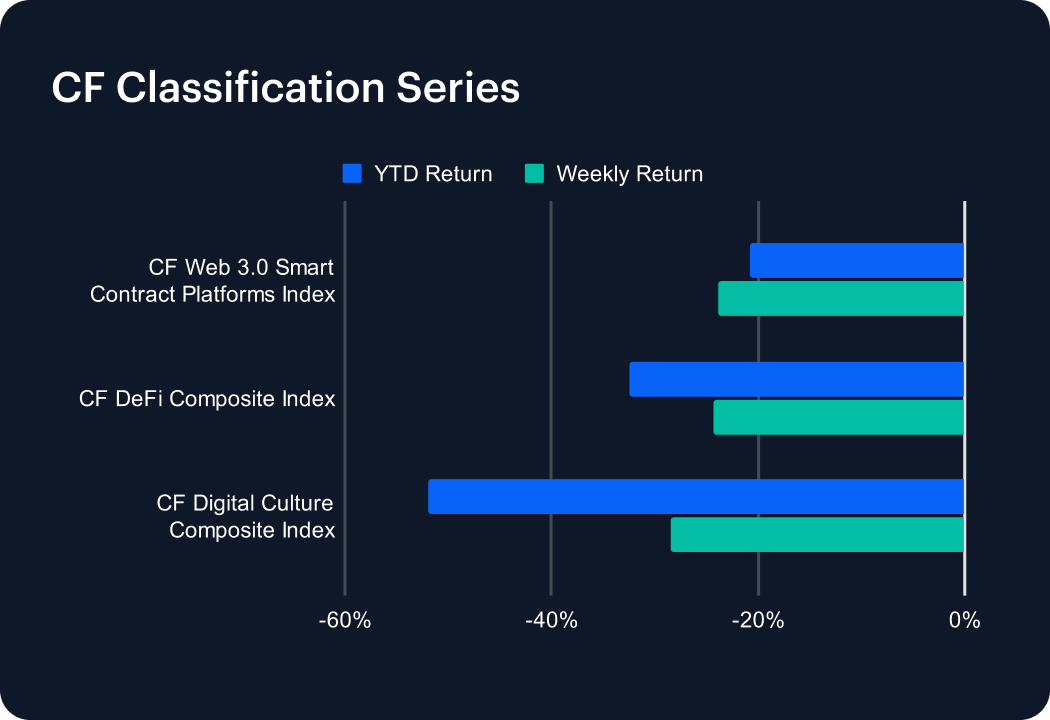
Classification Series Analysis
CF Benchmarks’ thematic-type indices, chiefly structured within our CF Classification Series, also broadly weakened week-on-week. CF Web 3.0 Smart Contract Platforms Index declined −23.89%, along with the CF DeFi Composite Index −24.33%, and CF Digital Culture Composite Index, −28.45%. The retreat of roughly uniform breadth depicts smart contract platform gauges and DeFi slipping in-line, with Culture trailing even those, somewhat. It’s a profile typical of risk-off phases where utility and attention-grabbing cohorts both compress; this is, lightly, a hint at indiscriminate selling creeping in.
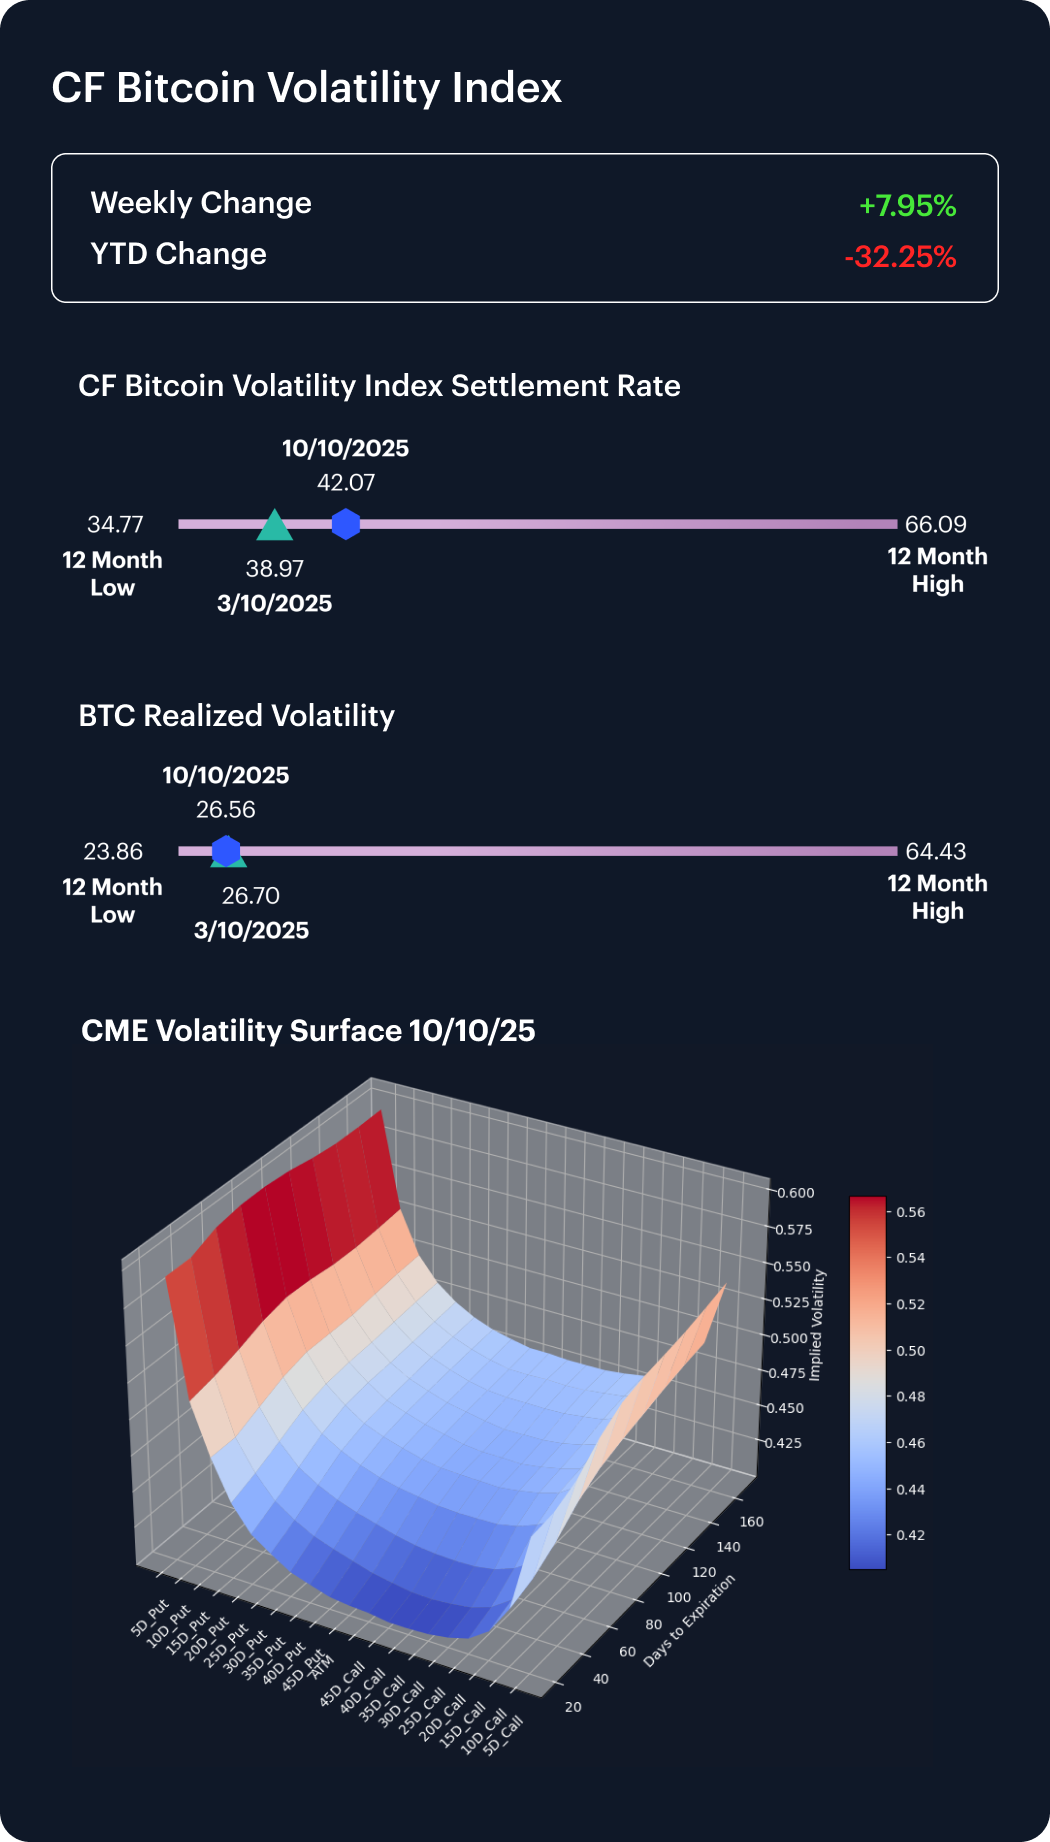
Volatility Analysis
Bitcoin implied volatility vs. realized volatility diverged during the week. Our CF Bitcoin Volatility Index Settlement Rate (BVX) rose +3.10 points to 42.07, while realized eased −0.15 pts to 26.56. This widened the implied-realized gap by around +3.24 pts. The up-shift in implied alongside softer realized suggests hedging premia were rebuilt faster than delivered vol. Tentatively, this looks consistent with a sharp correlation-heavy sell-off, that could be pricing-in further medium-term downside risk.
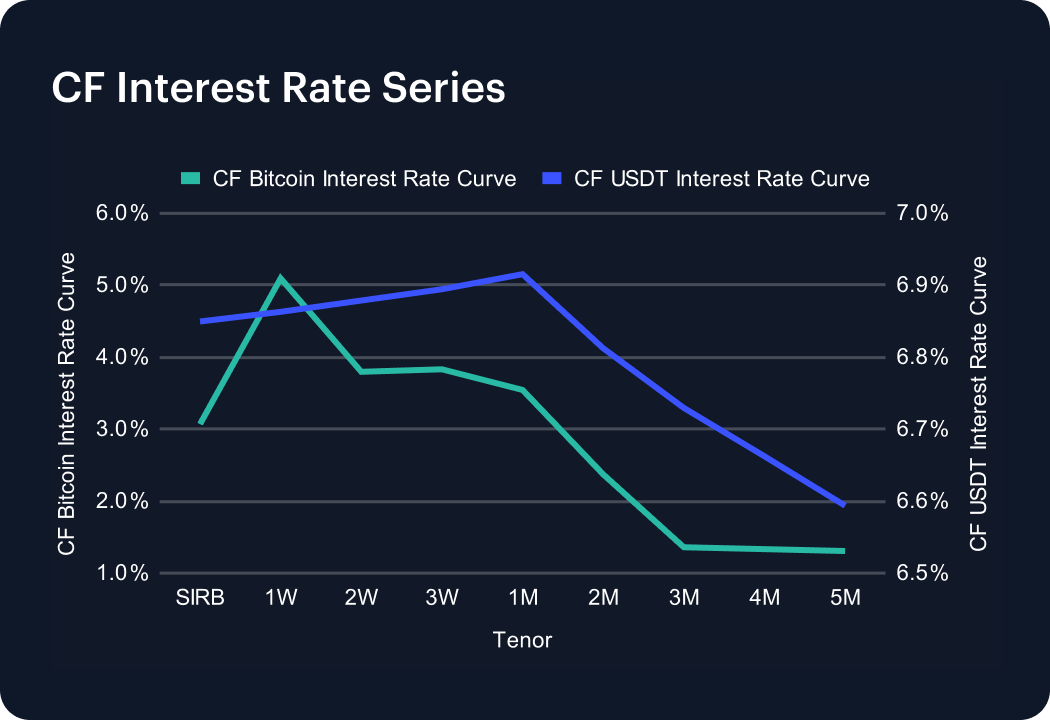
Interest Rate Analysis
Funding curves firmed, with potential for a lag, relative to the later-week volatility, looking at how our CF Bitcoin Interest Rate Curve (BIRC) performed. On the Bitcoin side, SIRB gained +4.35 bps to 3.07%, and 1M rose +29.06 bps to 3.54%: this indicates tighter BTC-linked funding across the front-to-belly of the curve. The USDT curve also moved higher: 1W +59.28 bps to 6.86%, 1M +62.35 bps to 6.92%. Overall, to the extent that hard takeaways are possible at all, this mix implies firmer basis on BTC tenors during the week, alongside dearer dollar-stablecoin carry.
The information contained within is for educational and informational purposes ONLY. It is not intended nor should it be considered an invitation or inducement to buy or sell any of the underlying instruments cited including but not limited to cryptoassets, financial instruments or any instruments that reference any index provided by CF Benchmarks Ltd. This communication is not intended to persuade or incite you to buy or sell security or securities noted within. Any commentary provided is the opinion of the author and should not be considered a personalised recommendation. Please contact your financial adviser or professional before making an investment decision.
Note: Some of the underlying instruments cited within this material may be restricted to certain customer categories in certain jurisdictions.
Changes to the Token Market Price Benchmarks Series - Market Prices – 21 July 2026
The Administrator has confirmed changes to the Token Market Price Family for the period 14 July 2026 to 21 July 2026.

CF Benchmarks
Softer CPI Reprices July Hike Risk & Lifts Digital Assets
Digital assets extended their recovery over the past week as cooler US inflation prints repriced Fed expectations; the bid was broad across the large cap indices, growth factor leadership returned, stablecoin funding repriced lower, and stress stayed isolated in names hit by token-specific news.
Mark Pilipczuk
Notice of the Demising of CF Dai-Dollar Settlement Price and Spot Rate
The Administrator announces that it will demise the CF Dai-Dollar Settlement Price (DAIUSD_RR) and CF Dai-Dollar Spot Rate (DAIUSD_RTI) which are members of the CF Digital Asset Index Family.
CF Benchmarks
By clicking Accept, you consent to CF Benchmarks's use of cookies.
Visit Cookie Settings to learn how CF Benchmarks uses cookies and to adjust your preferences.