
Nov 03, 2025
Weekly Index Highlights, November 3, 2025
Market Performance Update
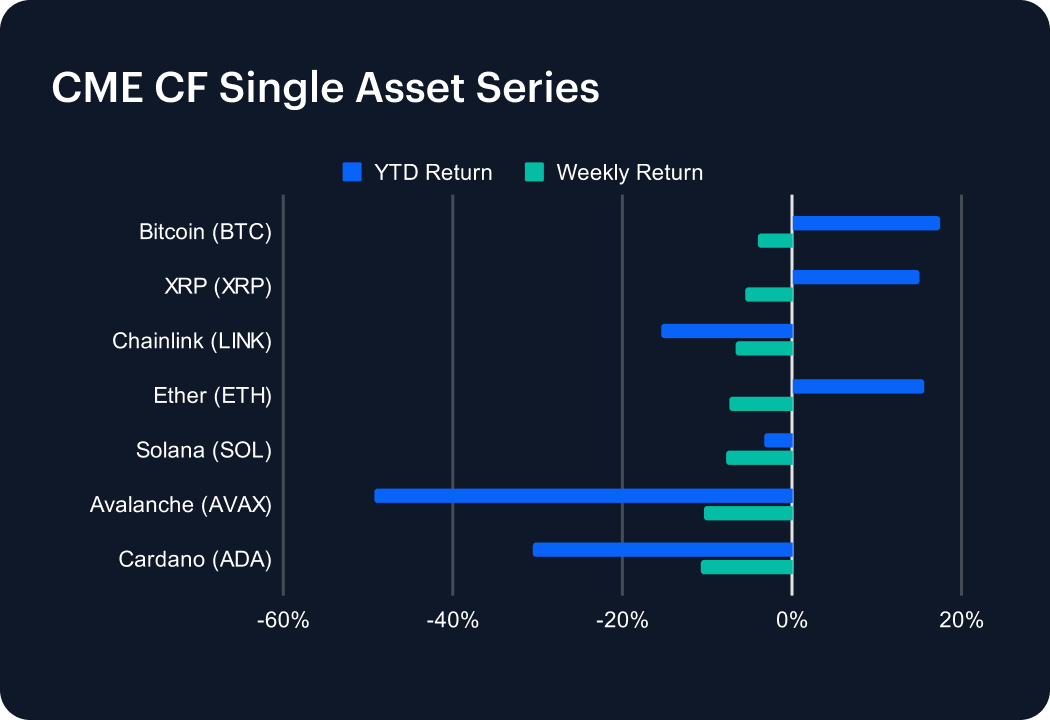
Digital assets reversed sharply after two firmer weeks, on profit-taking and caution ahead of key data releases and recent qualified commentary from the Fed drove a broad risk-off move across majors. All seven tracked assets finished lower, led by Cardano, -10.7%, Avalanche, -10.5%, and Solana, -7.8%; while Bitcoin, nudging -4.0% lower, XRP, losing -5.5%, and Chainlink down -6.6%, proved relatively resilient. Year-to-date performance narrowed but remains positive for the majors—Bitcoin (+17.4%), Ether (+15.7%), and XRP (+15.1%)—while smaller layer 1s stay firmly negative, underscoring a defensive tilt back toward higher-capitalization names.
Sector Analysis
Sector breadth turned decisively lower week-on-week, with all six DACS cohorts flipping or deepening into the red: Finance averaged -7.6% (from -1.5%), Culture -5.4% (from +0.2%), Utility -4.4% (from -1.3%), and Infrastructure -6.2% (from -0.7%). Settlement weakened across both Programmable (-4.9% from +1.0%) and Non-Programmable (-4.8% from +5.6%) cohorts and was the week’s sharpest reversal. Losses were led by higher-beta constituents in Finance (e.g., UNI -12.4%, CRV -17.4%, SNX -13.6%) and Infrastructure/Scaling (OP -9.8%, ARB -9.9%, TIA -10.4%), with broad softness across Programmable L1s (ADA -10.7%, AVAX -10.5%, SOL -7.8%, ETH -7.4%). Offsets were limited but notable: ICP +25.4% and HBAR +7.8% outperformed within Programmable, LPT +10.3%, firmed in Culture/Media, and defensive pockets were dimly detectable in Utility/Information & Data and Non-Programmable/Store of Value & Payment (e.g., LTC -2.2%, BTC -4.0%) with relative resilience. Overall tone: broad risk-off with the steepest week-on-week deterioration in Non-Programmable and Finance, and only isolated strength in select platform and media names.
CF Staking Series
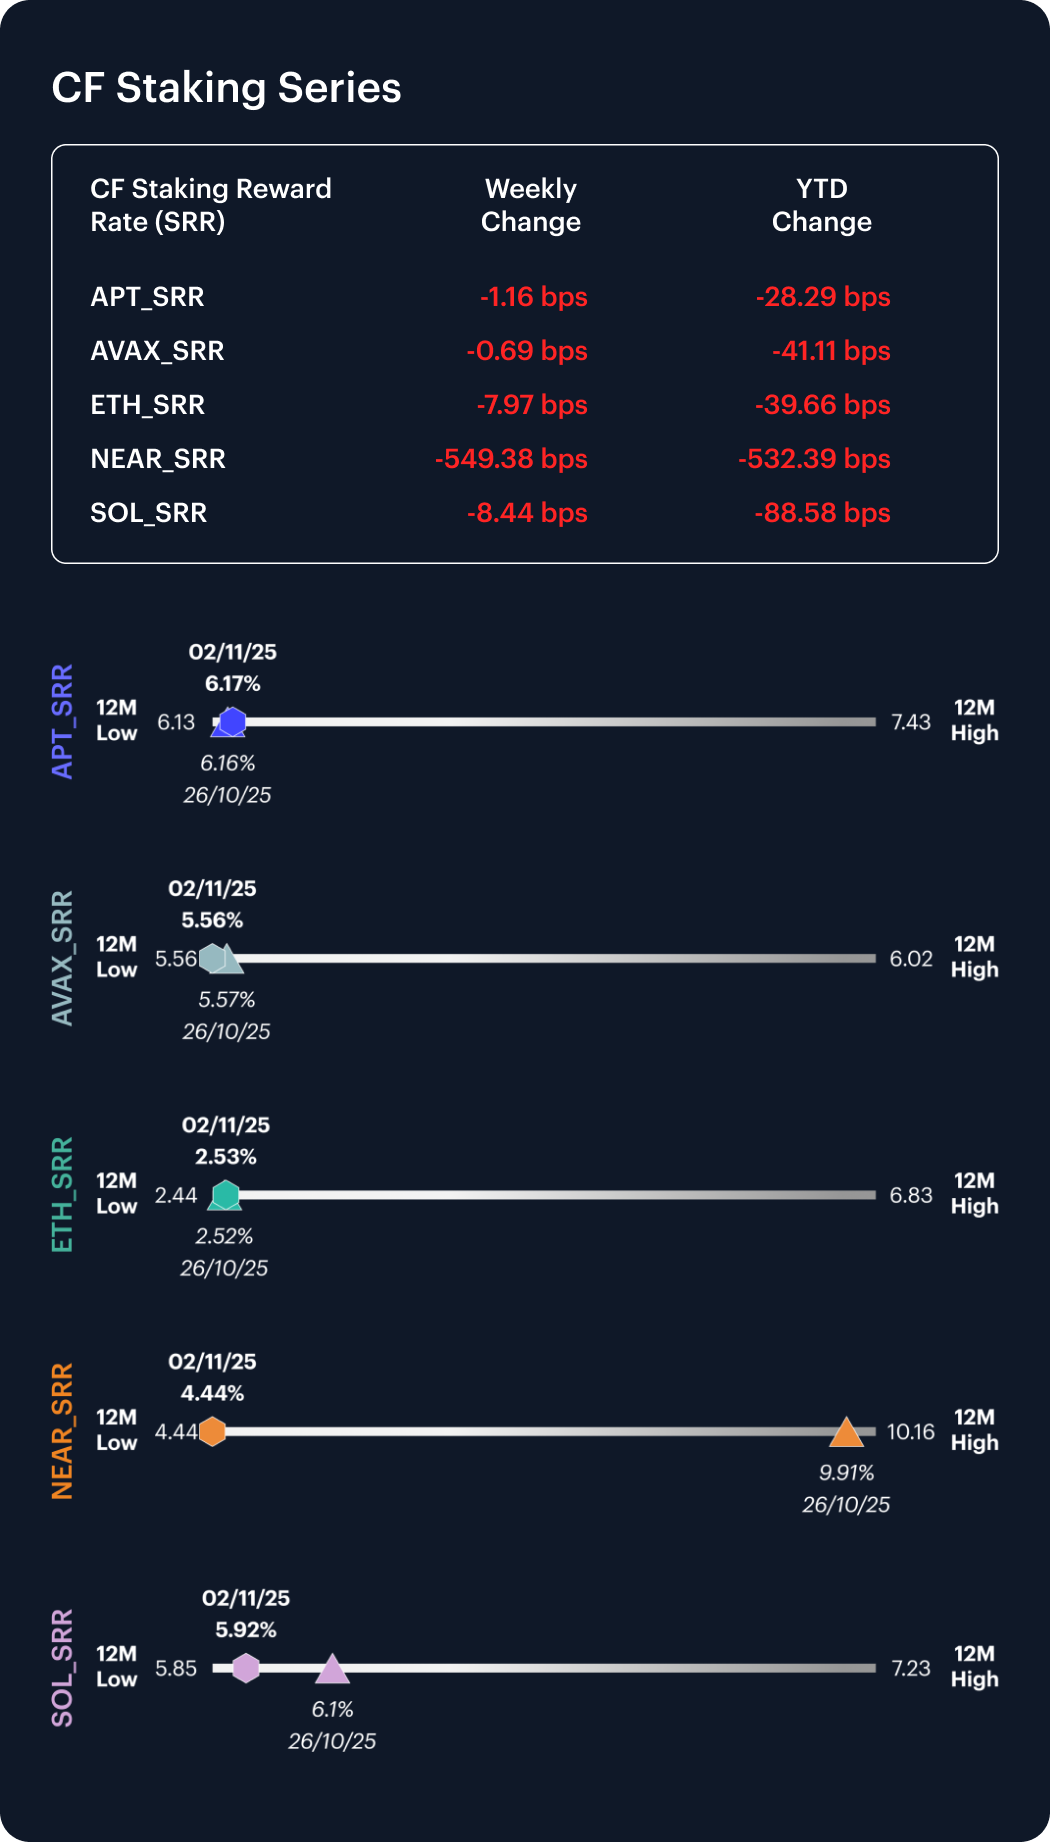
Carry softened across the board, led by an exceptional NEAR compression as the staking rate fell roughly -549 bps to 4.44% (a new 12-month low), coinciding with a -55.3% weekly return for the NEAR staking composite; ETH edged lower by about -8 bps to 2.53% (weekly -3.1%), while SOL eased -8 bps to 5.92% (weekly -1.4%). Lower-beta names were steadier: AVAX dipped -1 bps to 5.56% (weekly -0.1%) and APT slipped -1 bps to 6.17% (weekly -0.2%). On a year-to-date basis, carry has compressed across the set—most acutely in NEAR (-532 bps YTD), with more modest declines in SOL (-89 bps), ETH (-40 bps), AVAX (-41 bps) and APT (-28 bps)—underscoring a week characterized by both rate compression and price weakness, particularly in higher-beta staking exposures.
Market Cap Index Performance
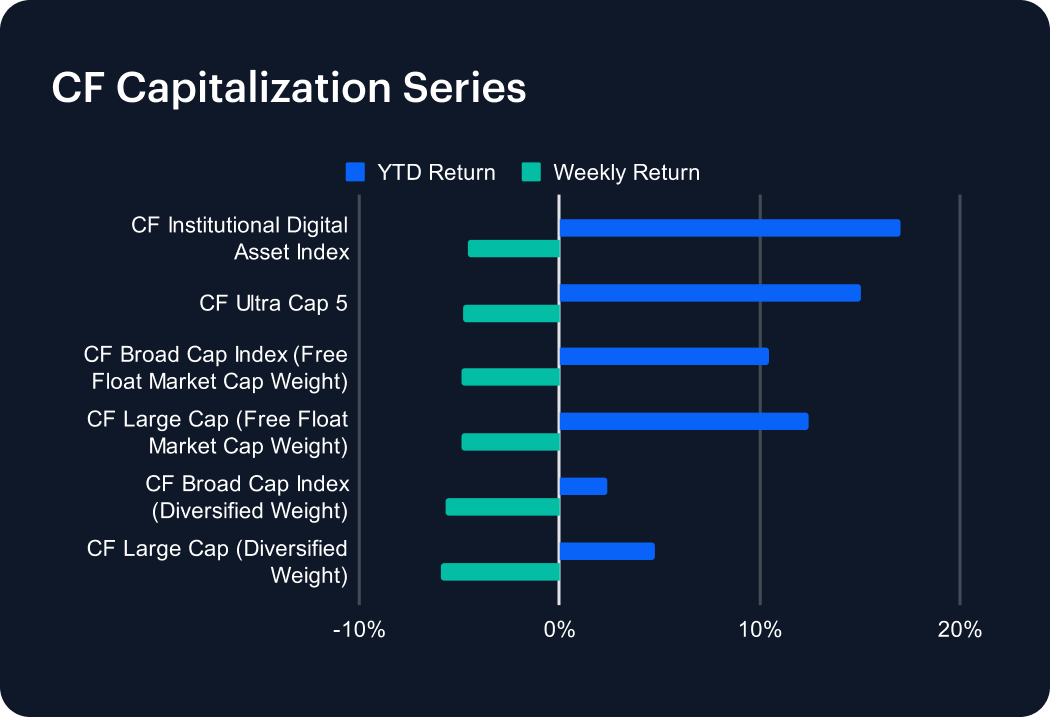
All CF capitalization indices reversed lower week-on-week, in line with the softer overall market tone. Declines were clustered around -4.5% to -6.0% and the deepest losses in the diversified-weight composites. CF Institutional Digital Asset Index fell -4.58% and CF Ultra Cap 5 eased -4.82%, leading relative performance, while CF Broad Cap (Diversified Weight) was down 5.72% and CF Large Cap (Diversified Weight) down -5.91%. These laggards underperformed their free-float peers: CF Broad Cap (Free-float market-cap weight) -4.87%, and CF Large Cap (FFMCW) -4.90%. The rotation represents a sharp swing from last week’s gains. That’s consistent with a broad risk-off that favored higher-quality, free-float variants on a relative basis. Year-to-date leadership narrowed but remains intact at the top of the stack—Institutional +17.05%, Ultra Cap 5 +15.03%, Large Cap (FFMCW) +12.46%, Broad Cap (FFMCW) +10.48%. The diversified versions are now exhibiting mid-single-digit gains. Broad Cap (Diversified) +2.41%, Large Cap (Diversified) +4.76%).
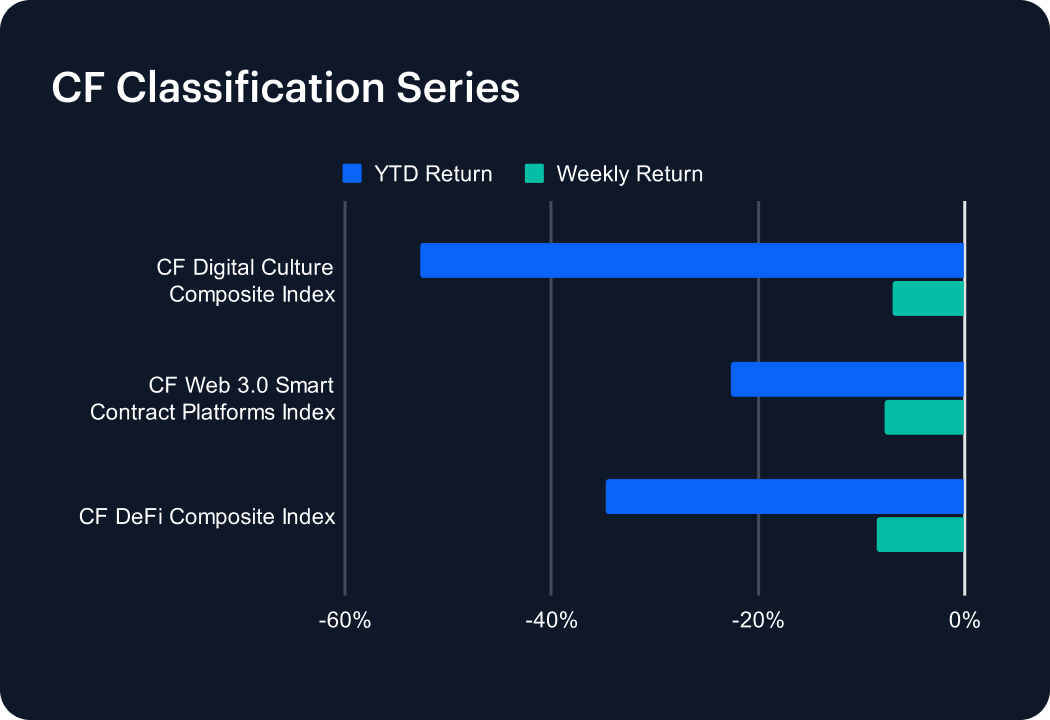
Classification Series Analysis
Classification cohorts reversed sharply into broad losses, with DeFi (-8.5%) the weakest, followed by Web 3.0 Smart Contract Platforms (-7.7%) and Digital Culture (-7.0%), unwinding last week’s modest gains (+0.6% / +1.6% / +1.4%, respectively). Index levels corroborate the drawdown—DeFi fell from 358.8 → 328.3, Web 3.0 from 439.9 → 405.9, and Digital Culture from 197.2 → 183.3—and year-to-date performance deteriorated further (Digital Culture -52.7%, DeFi -34.8%, Web 3.0 -22.6%), underscoring a decisive rotation away from higher-beta classifications after two weeks of improving momentum.
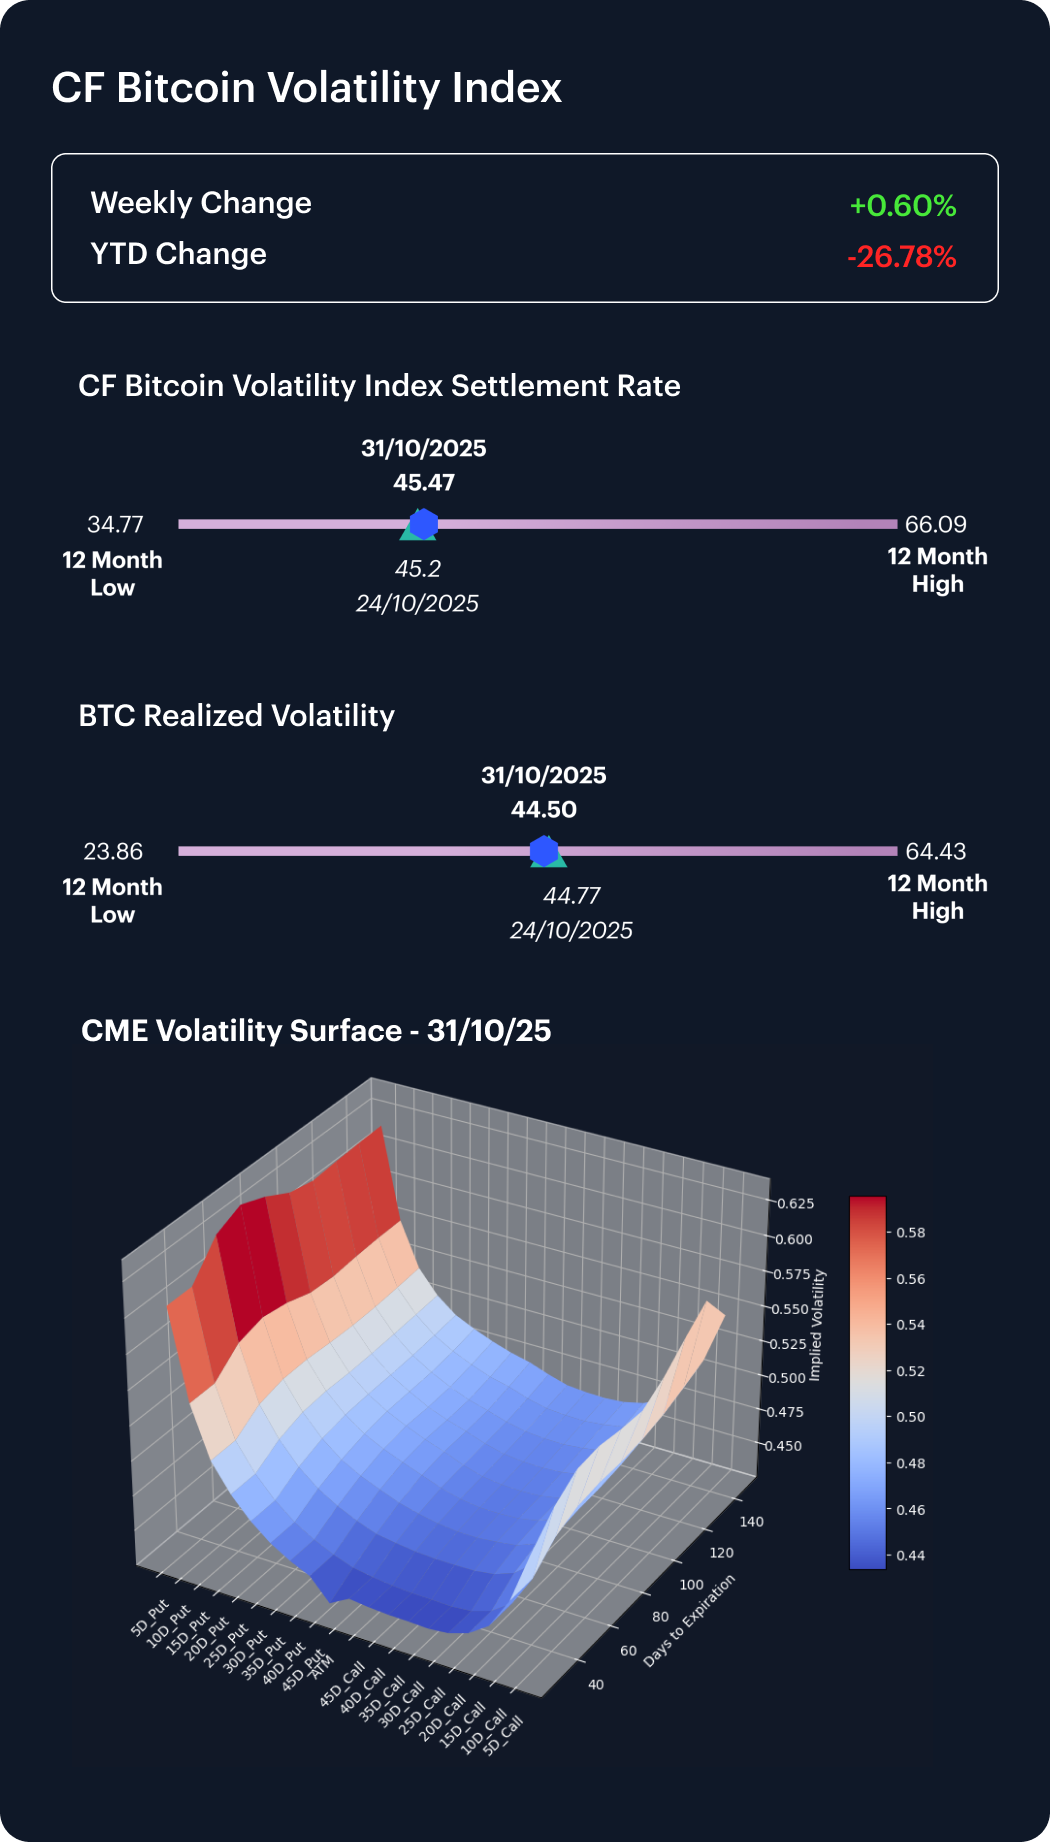
Volatility Analysis
Implied and realized volatility rematerialized after the prior week’s sharp compression, with the CF Bitcoin Volatility Index (BVX) closing marginally higher at 45.47 from 45.20, while realized volatility eased fractionally to 44.50. The small uptick in implied (weekly +0.6%) follows a -13.0% drop the week before, leaving BVX still down roughly 27% YTD from early-year highs. The 12-month range—34.8 to 66.1—highlights that conditions remain historically subdued but no longer at their softest, as short-dated skews widened modestly alongside the week’s broad risk-off tone. Overall, volatility metrics suggest a mild re-firming of implied levels against stable realized, consistent with rising downside hedging demand, but still well below the year’s peak stress regime.
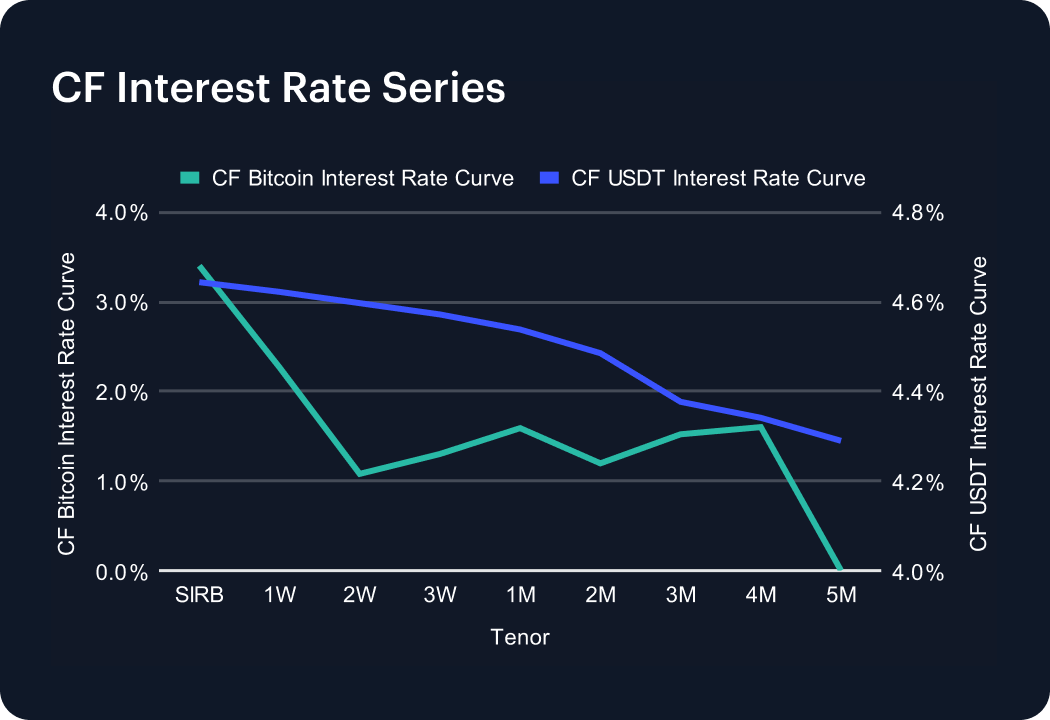
Interest Rate Analysis
Funding rates diverged week-on-week. The CF Bitcoin Interest Rate Curve (BIRC) steepened modestly at the front end as SIRB jumped from 0.32% to 3.40% while most fixed tenors eased slightly (1W 2.27% vs 2.32%, 1M 1.59% vs 1.81%). In contrast, the CF USDT Interest Rate Curve flattened lower across all maturities, with SIRB 4.64% vs. 5.41%, 1W 4.62% vs. 5.39%, and 1M 4.54% vs. 5.32%. The result is a widening BTC–USDT basis at the very short end, driven by a sharp rebound in Bitcoin funding rates from prior subdued levels, and a concurrent 30–80 bps easing in USDT yields along the curve. The overall tone is suggestive of firmer BTC rates but broad USDT softening, implying tighter native-crypto funding even as stablecoin carry normalizes.
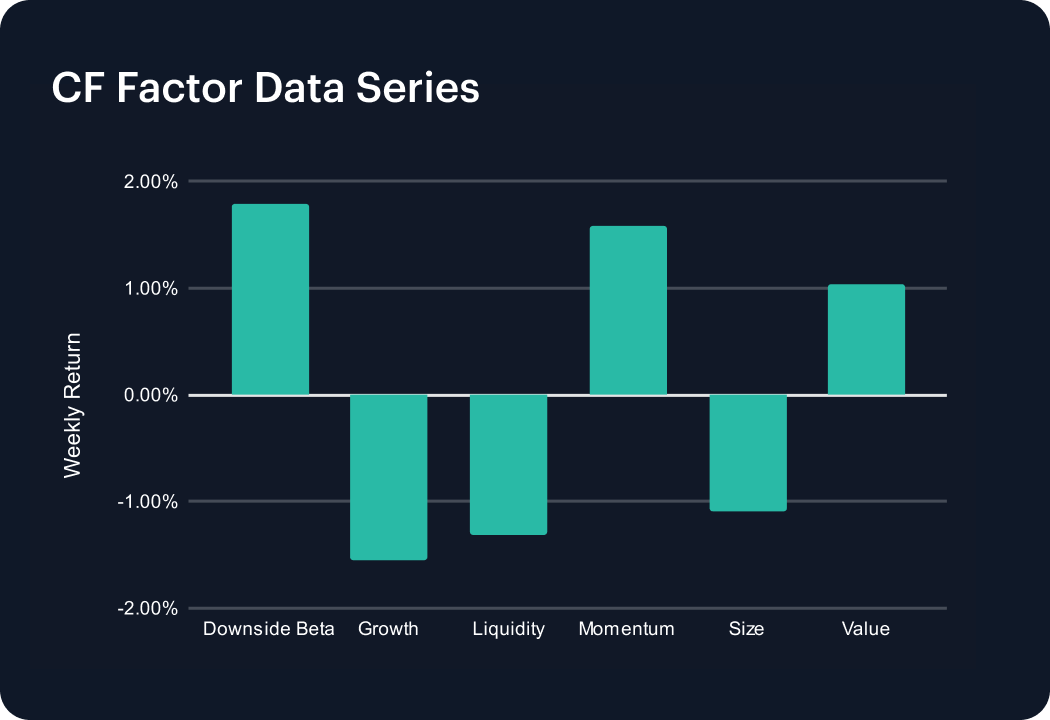
Factors Analysis
Factor leadership rotated decisively: Growth and Liquidity deteriorated week-on-week; averages flipped from roughly +0.06% and +0.25% last week to -0.22% and -0.19%, which is consistent with a risk-off that penalized higher-beta, illiquid names. Downside Beta turned positive on the week (+0.26% vs -0.05%), signaling greater sensitivity to drawdowns, while Momentum recovered (+0.23% vs -0.05% prior) despite fading into the weekend. Size remained negative on average (-0.15%, favoring large-caps) but showed a late-week bounce (+0.83%, +0.65% on November 1-2), and Value firmed into the close (week average +0.15%, with back-end prints +1.10% and +0.70%). Overall, that was a broad de-risking week—with quality/liquidity premia reasserted, while large-caps outperformed, and the brief bid for small-caps and Value arrived only late in the period.
Click here to explore CF Benchmarks' Factor Intelligence data and products, including factor explainers, and live factor Returns, Scores and Exposures.
The information contained within is for educational and informational purposes ONLY. It is not intended nor should it be considered an invitation or inducement to buy or sell any of the underlying instruments cited including but not limited to cryptoassets, financial instruments or any instruments that reference any index provided by CF Benchmarks Ltd. This communication is not intended to persuade or incite you to buy or sell security or securities noted within. Any commentary provided is the opinion of the author and should not be considered a personalised recommendation. Please contact your financial adviser or professional before making an investment decision.
Note: Some of the underlying instruments cited within this material may be restricted to certain customer categories in certain jurisdictions.
Bitcoin ETF Outflow Streak Ends as BVX Falls to a 12-Month Low
Digital assets traded mixed over the week: ETF inflows returned and the mega caps carried our headline indices, while high-beta names and diversified breadth lagged. DeFi led the themes, meme coins absorbed a governance attack, implied volatility kept compressing.

Gabriel Selby
Factor Friday - July 10, 2026
The relief rally extended for a second week with Market +2.27%, but the real story is risk appetite: Liquidity led styles at +1.51% as thinner, less liquid names caught a bid. Value paused at -0.79% yet still leads over four weeks. Defensive tilts kept unwinding into the bounce.
Mark Pilipczuk
2026 Mid-Year Market Outlook
Iran risk, regulatory policy, Bitcoin rebalancing, tokenization, and protocol revenue are reshaping the outlook. Growth is narrowing, but regulatory progress and productive on-chain activity create offsets. Dispersion, not broad beta, should define the next year.
Gabriel Selby
By clicking Accept, you consent to CF Benchmarks's use of cookies.
Visit Cookie Settings to learn how CF Benchmarks uses cookies and to adjust your preferences.