
Nov 24, 2025
Weekly Index Highlights, November 24, 2025
Market Performance Update
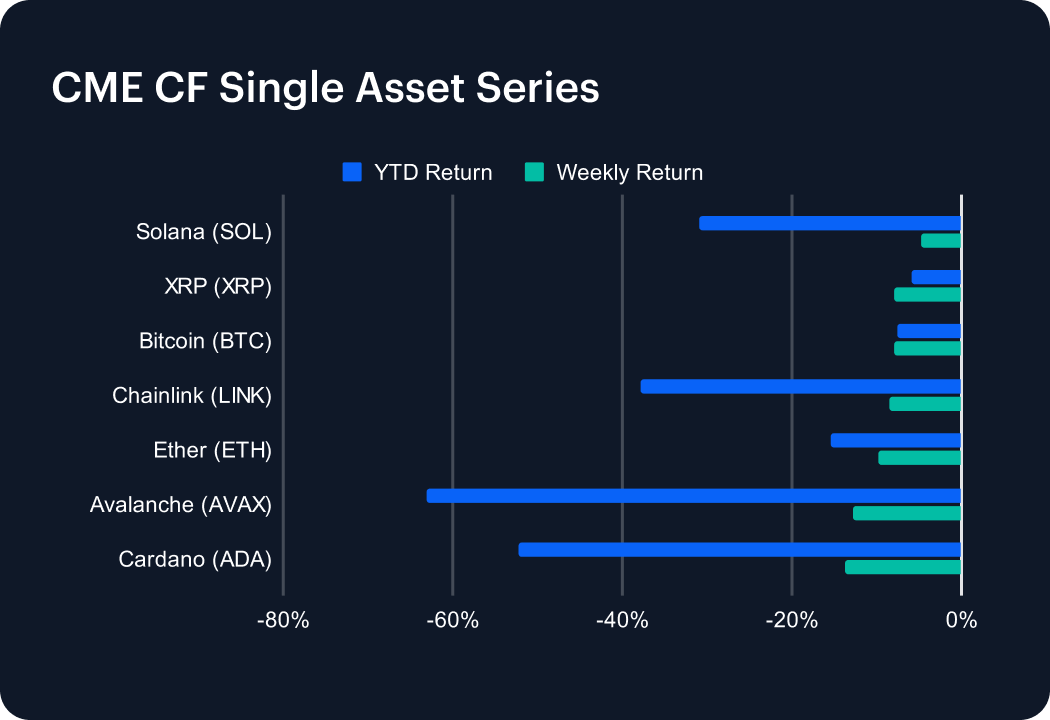
The extended drawdown of digital asset markets deepened into another week, with Bitcoin and XRP signally erasing all gains made earlier in the year – the last two assets in this group to do so - following their respective -7.89% and -7.86% weekly slides, while ETH’s year-to-date loss widened to -15.34%, after a -9.76% drop for the week. Though both mega caps appeared to stabilize close to widely recognized technical supports, layer‑1s remained under pressure in general, with Solana (SOL) and Avalanche (AVAX) declining 4.8% and 12.9% respectively, while Cardano (ADA) and Chainlink (LINK) registered deeper losses at −13.7% and −8.6%. Still, despite the severity of the drawdown, order books remained relatively deep and spreads contained, leaving the impression of a market that is more continuing to digest prior gains than one that is significantly repricing fundamentals. Liquidity metrics held near trailing averages, and funding remained benign across major derivatives venues, consistent with a cyclical consolidation rather than structural stress.
Sector Analysis
Sector performance as observed through the CF Digital Asset Classification Structure (CF DACS) lens also remained weak but was sufficiently on the right side of ‘orderly’ to preclude a wholesale writing off of constructive sentiment – for now. Non-Programmable −5.0%, was strongest; followed by the other key Sub-Categories in relative performance order: Utility −6.7%; Finance −9.6%; Programmable −12.5%; Culture −13.3%; and Infrastructure −14.0%. Within Finance, Trading and Borrowing & Lending were comparatively resilient (e.g., CRO −1.6%, SPELL −3.2%) versus Derivatives and Asset & Wealth Management (SNX −13.0%, JTO −17.4%). Services were split. Utility benefited from a rare bright spot in SDK & Tooling (BICO +18.5%), while Information & Data Management and Oracles were softer (FIL −17.4%, GRT −11.9%). Infrastructure’s Scaling cohort absorbed the brunt of trimming (STRK −29.7%, TIA −25.1%), and Computing was broadly weaker (HNT −19.9%, RENDER −13.7%). In Settlement, Programmable platforms fell in a broad beta move (e.g., NEAR −18.8%, APT −18.4%), while Non-Programmable Store-of-Value assets were mixed but comparatively defensive, with Bitcoin Cash (BCH) a rare gainer, BCH +7.6%. Culture lagged across Gaming, Social, VR/AR and NFT Platforms (IMX −18.7%, SUPER −18.9%, with Meme Coins broadly lower (e.g., WIF −16.6%, PEPE −14.4%).
CF Staking Series
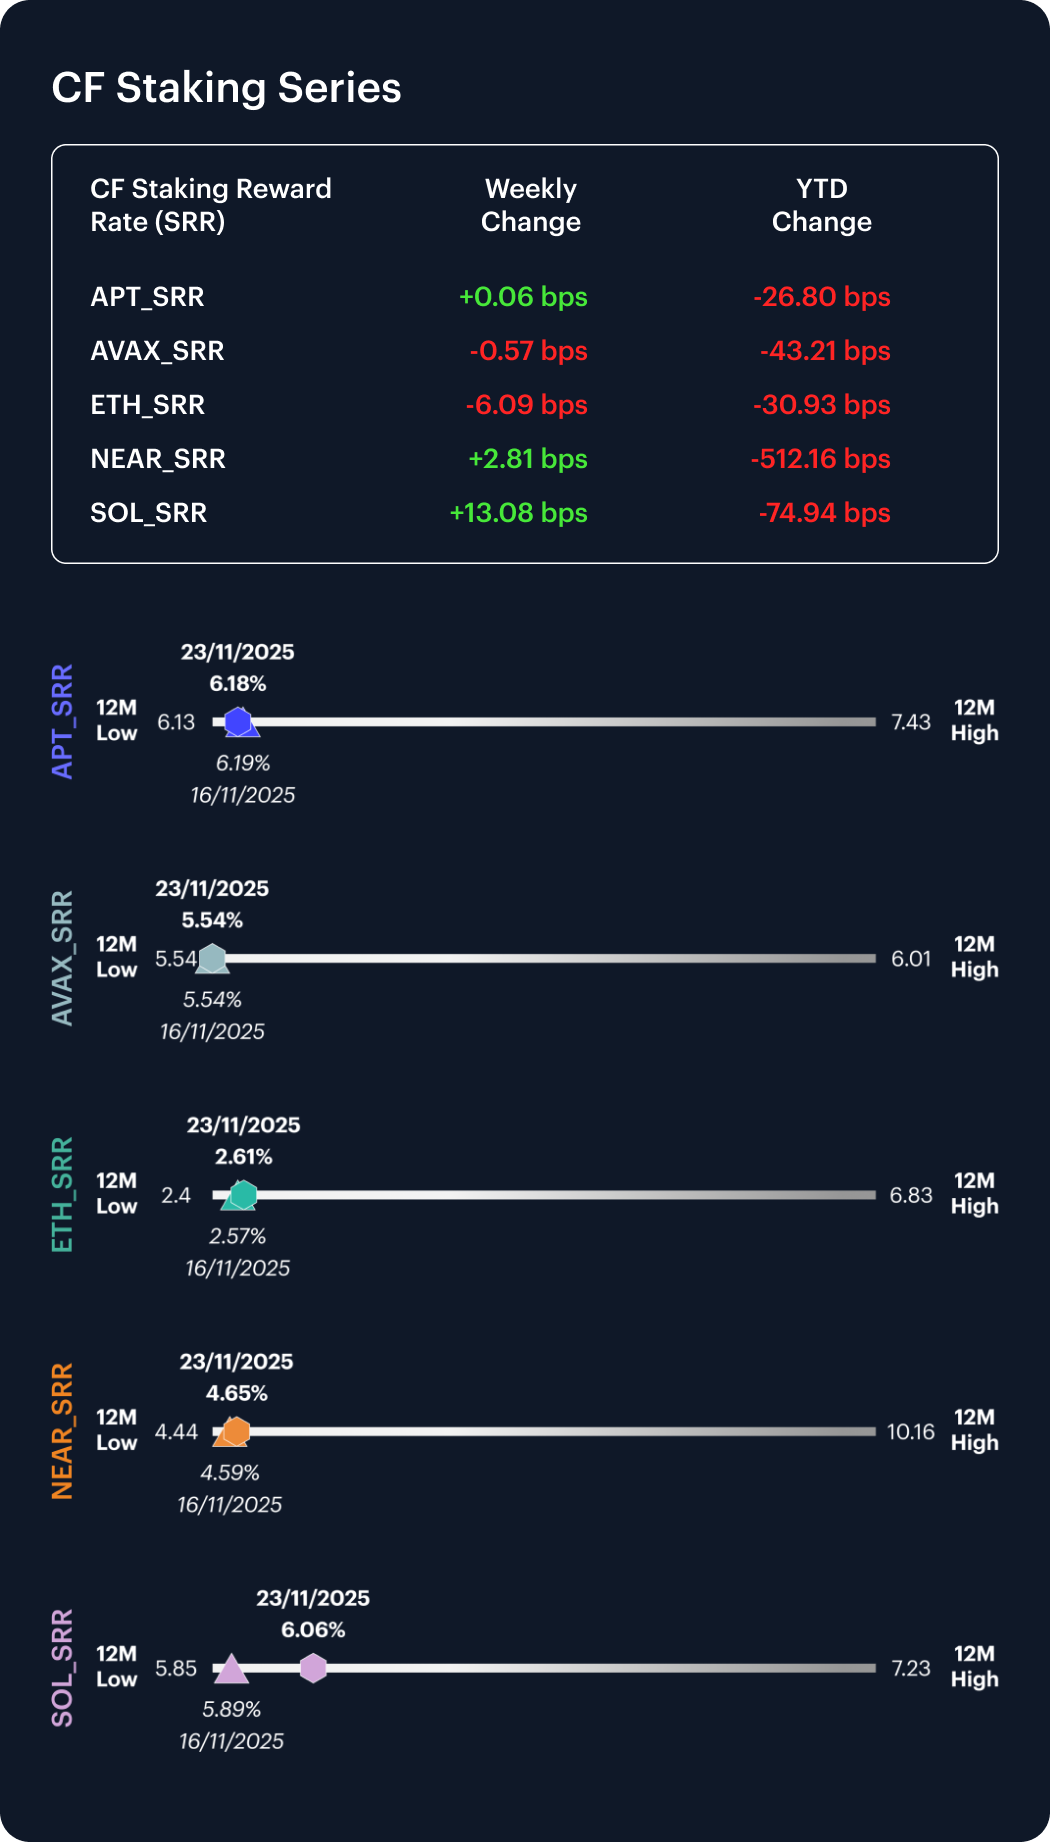
Staking indices were directionally mixed week-on-week, with rates of travel emerging if not a clear direction. ETH staking reward rates eased by −6.09 bps versus −2.31 bps the prior week, while SOL rose +13.08 bps (accelerating from its prior +0.47 bps). NEAR gained +2.81 bps, slightly more than the +2.62 bps previously; APT was steady at +0.06 bps; way less than +0.97 bps last time; and AVAX slipped −0.57 bps; somewhat narrower than −0.89 bps a week earlier. The resulting pattern indicates mild re-expansion at the periphery, and ongoing normalization in validator yields. Average weekly moves stayed well within historical norms, indicating a stable mid-cycle equilibrium across staking indices.
Market Cap Index Performance
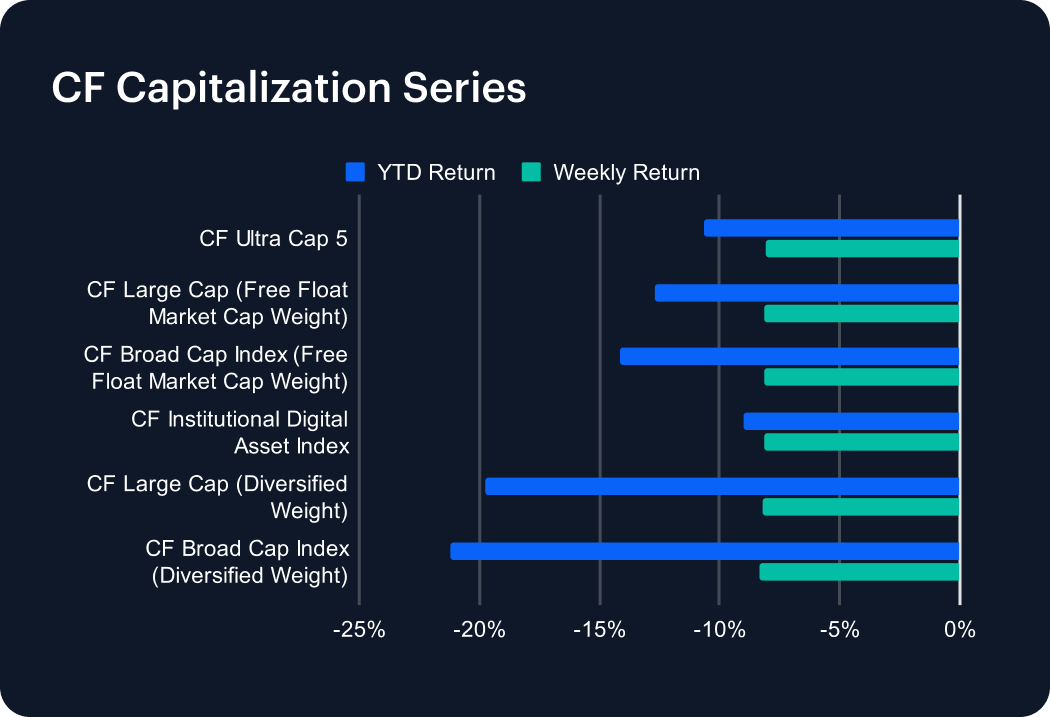
Across capitalization tiers, the same negative picture prevailed as the one seen through other slices, but it’s worth noting the rate of these losses generally narrowed materially week-on-week and dispersion compressed sharply. Ultra Cap 5’s decline was −8.09% (from −10.11%), Large Cap (Free Float) slid −8.12% (from −10.17%), Broad Cap (Free Float) dumped −8.16% (versus −10.25%), the Institutional Digital Asset Index lost −8.18% (from −9.61%), Large Cap (Diversified) shed −8.22% (from −11.30%), and the Broad Cap (Diversified) retreated −8.34% (compared with −11.40% in the prior week). This resulted in the tier spread tightening to approximately 0.25 pp from ~1.79 pp, indicating a quality-and-liquidity bias with tightly clustered outcomes while risk compressed.
Classification Series Analysis
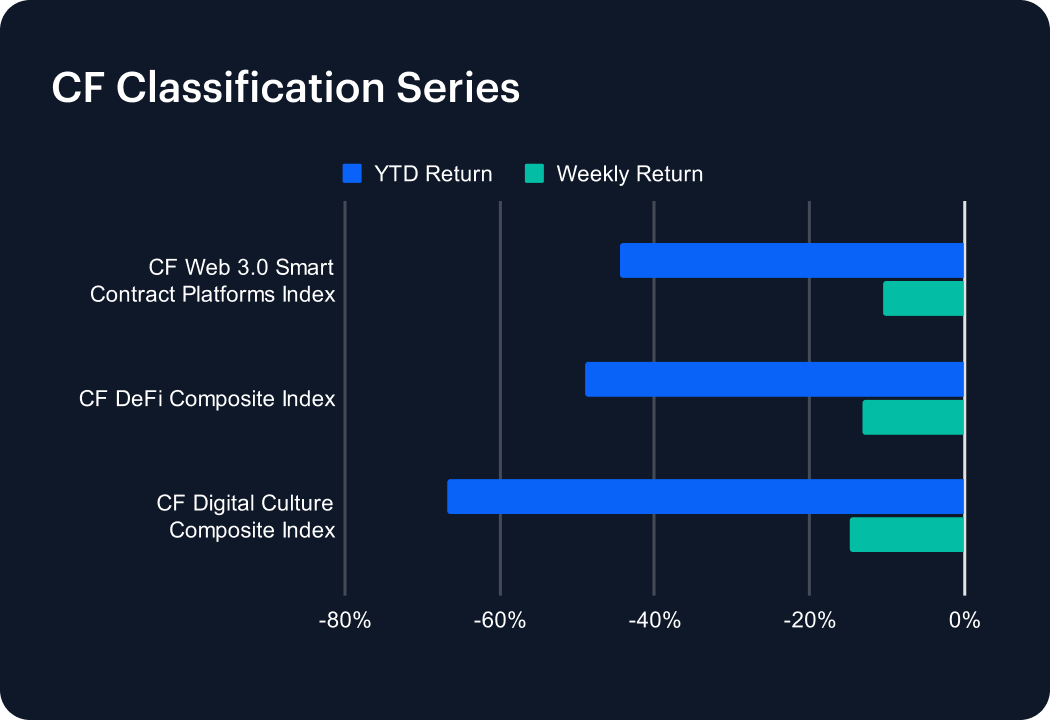
The CF Web 3.0 Smart Contract Platforms Index fell sharply again, −10.52%, on the week, though escaping the prior week’s circa 15% slide; while both the CF DeFi Composite Index’s and the CF Digital Culture Composite Index’s declines worsened, −13.29% and −14.75%, respectively. The narrower spread across themes suggests ongoing beta compression in thematic indices. Additionally, with Web 3.0 outperforming its prior week’s heavy loss, while DeFi and Culture softened further, rotational and liquidity-led moves are suggested instead of thematic capitulation.
Volatility Analysis
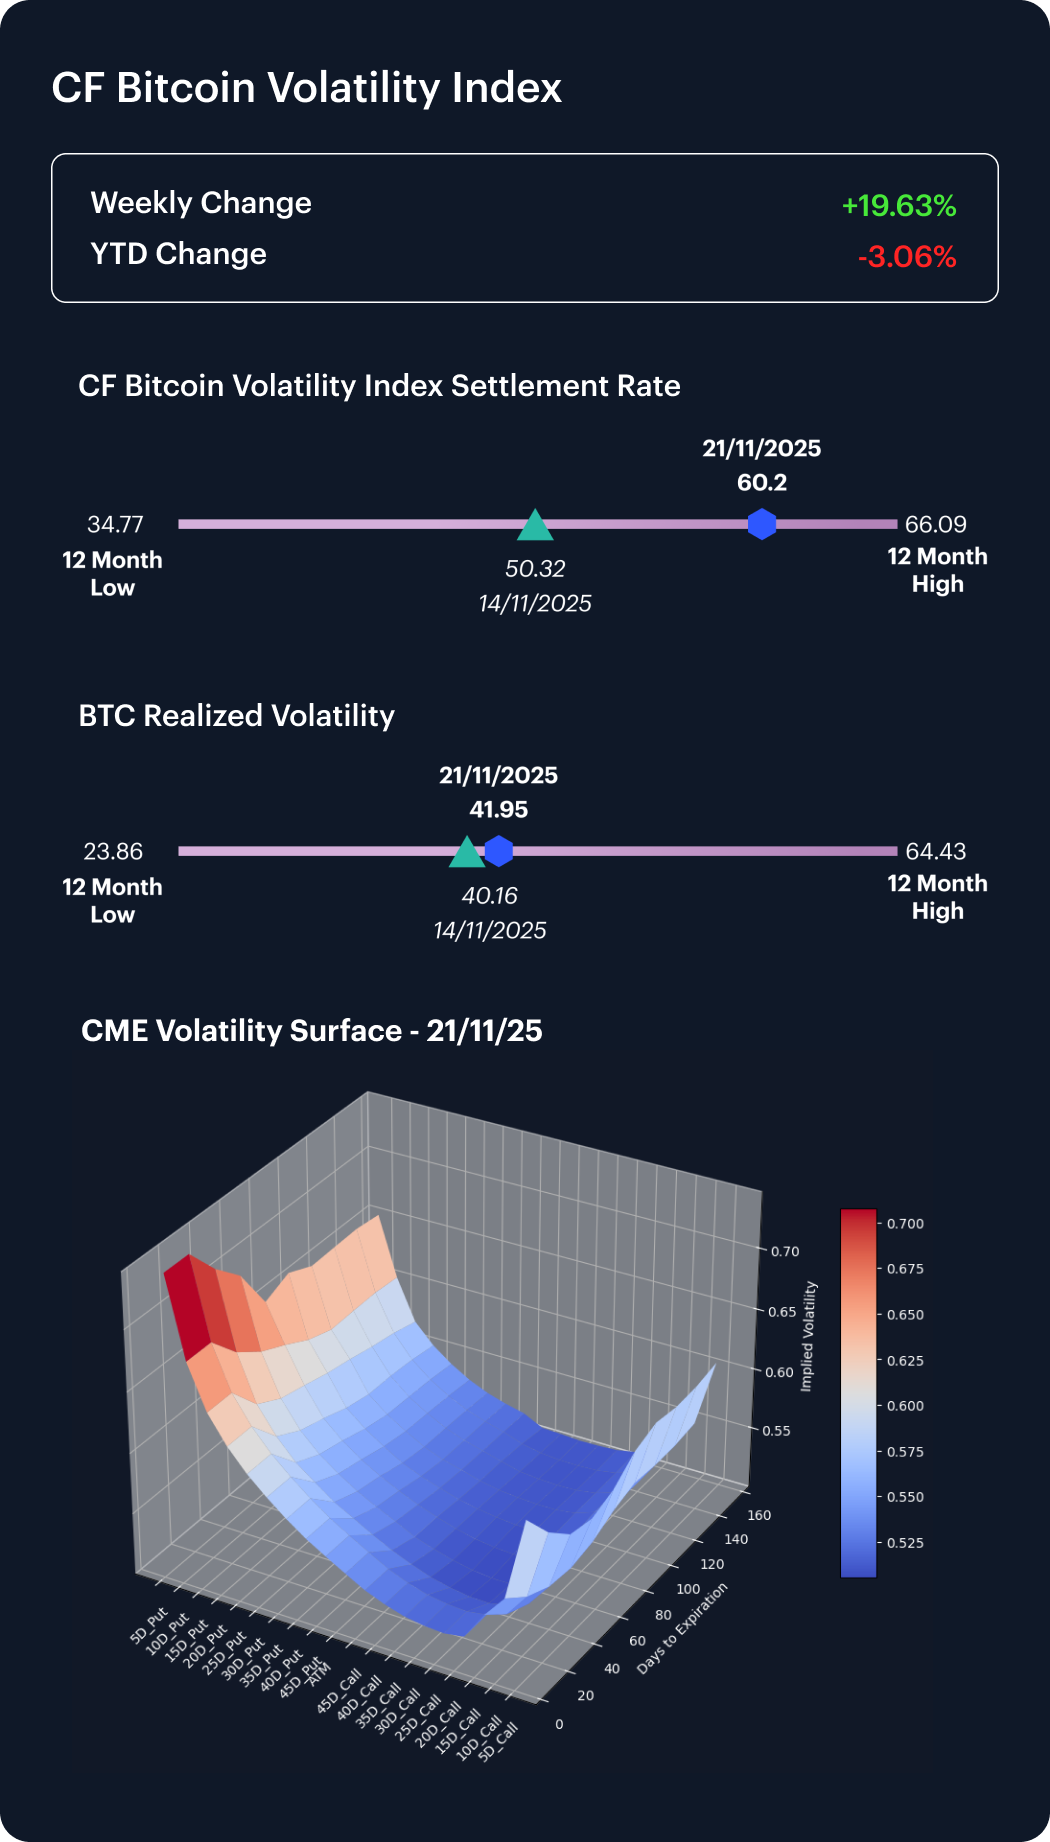
The CF Bitcoin Volatility Index (BVX) climbed from 50.32 to 60.20 for the week (+9.88 points), an acceleration from the +2.66 pts increase recorded the previous week. Realized volatility rose modestly to 41.95 from 40.16, reversing the prior week’s compression. The implied–realized gap thus widened materially, pointing to increased demand for downside hedges even as the underlying drawdown continued to look orderly. Option surface metrics, however, continued to suggest disciplined positioning and a vol. environment that was nowhere near out of control.
Interest Rate Analysis
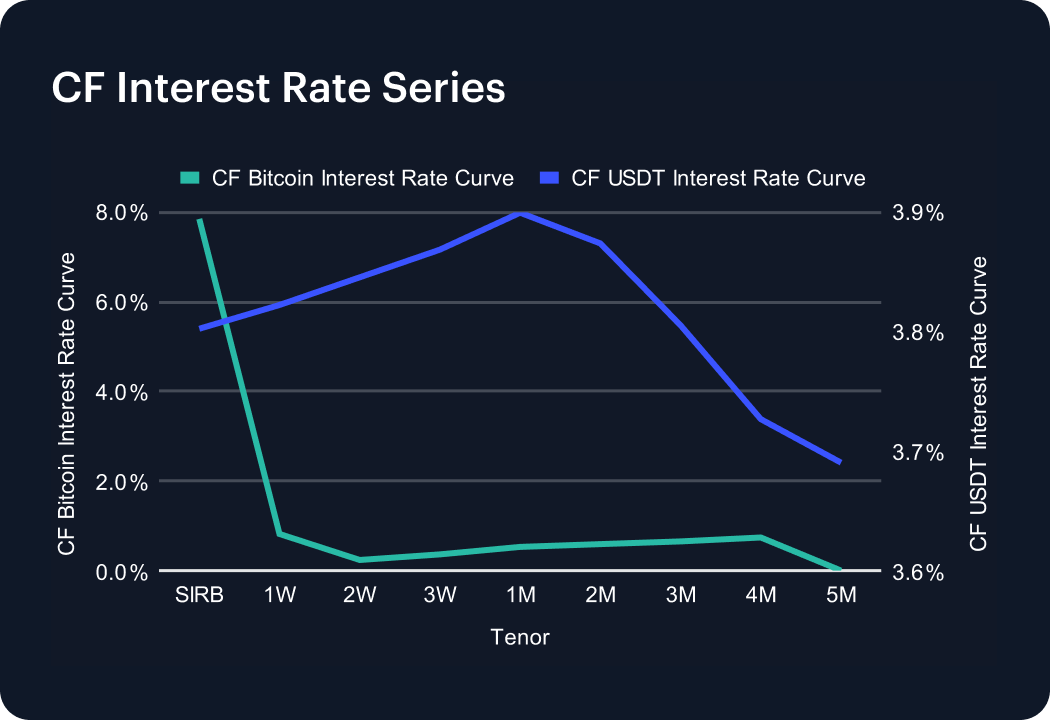
Funding curves softened across both Bitcoin and USDT complexes but at a slower pace than the previous week. On the BTC curve, SIRB declined to 7.85% from 6.12%, while the 1-Month tenor held near 0.53% (vs. 0.83% a week earlier). The USDT curve flattened, with 1-Week 3.82% (−1.39 pp w/w) and 1-Month 3.90% (−1.37 pp), compared with a broader front-end easing last week. The net effect was a parallel shift lower in absolute levels but with compression moderated, suggesting continued normalization of funding without leverage stress.
Factors Analysis
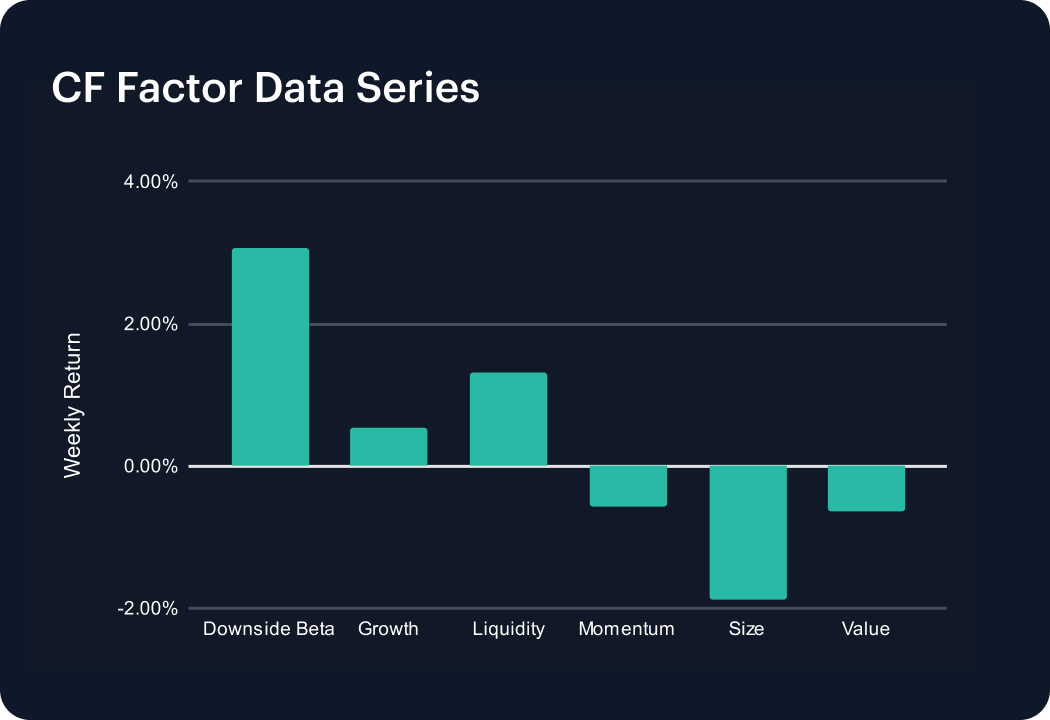
Cumulative weekly factor returns point to selective re-risking with a rotation in the drivers. Downside Beta printed at 3.06% from 2.35%, the week before, and Growth at 0.54% vs. 0.38%, while Liquidity cooled to 1.31%, after a 2.19% reading. Momentum flipped negative at −0.57% from 0.55%. Size, −1.89%, and Value, −0.63%, remained in the red but were better than last week's −2.11% and −1.21% respective closes. This latest positioning seems to favor beta and growth exposure over pure liquidity, with carry and value still out of favor yet stabilizing. This looks consistent with mechanical de-risking, rather than a regime change.
The information contained within is for educational and informational purposes ONLY. It is not intended nor should it be considered an invitation or inducement to buy or sell any of the underlying instruments cited including but not limited to cryptoassets, financial instruments or any instruments that reference any index provided by CF Benchmarks Ltd. This communication is not intended to persuade or incite you to buy or sell security or securities noted within. Any commentary provided is the opinion of the author and should not be considered a personalised recommendation. Please contact your financial adviser or professional before making an investment decision.
Note: Some of the underlying instruments cited within this material may be restricted to certain customer categories in certain jurisdictions.
Changes to the Token Market Price Benchmarks Series - Market Prices – 21 July 2026
The Administrator has confirmed changes to the Token Market Price Family for the period 14 July 2026 to 21 July 2026.

CF Benchmarks
Softer CPI Reprices July Hike Risk & Lifts Digital Assets
Digital assets extended their recovery over the past week as cooler US inflation prints repriced Fed expectations; the bid was broad across the large cap indices, growth factor leadership returned, stablecoin funding repriced lower, and stress stayed isolated in names hit by token-specific news.
Mark Pilipczuk
Notice of the Demising of CF Dai-Dollar Settlement Price and Spot Rate
The Administrator announces that it will demise the CF Dai-Dollar Settlement Price (DAIUSD_RR) and CF Dai-Dollar Spot Rate (DAIUSD_RTI) which are members of the CF Digital Asset Index Family.
CF Benchmarks
By clicking Accept, you consent to CF Benchmarks's use of cookies.
Visit Cookie Settings to learn how CF Benchmarks uses cookies and to adjust your preferences.