
Nov 18, 2024
Weekly Index Highlights, November 18, 2024
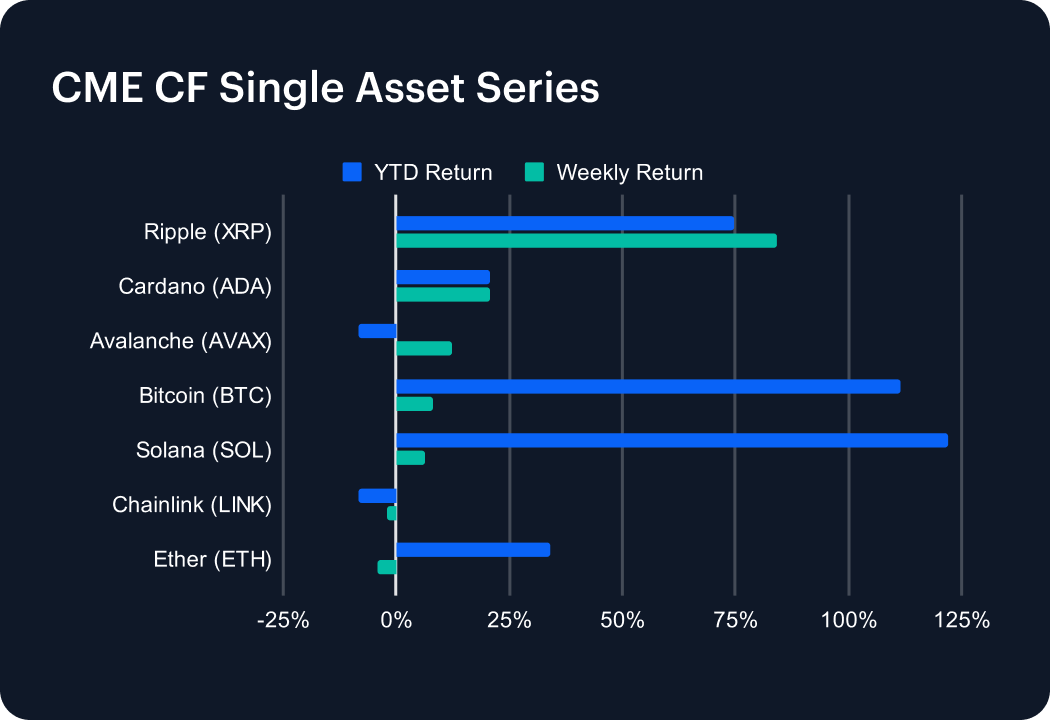
Whilst the ‘Trump Trade redux’ exerted a dwindling influence across digital assets in the most recent week, specific politically related effects have begun to emerge. Ripple’s (XRP) +84.16% weekly surge was the most evident of these among CME CF Single Asset Series indices. With XRP’s year-to-date return now standing at +74.81%, it clearly turned definitively positive for the year over the course of the week. By contrast, Cardano (ADA) posted a second straight solid weekly gain, but was a distant second, rising +20.62%. Recent weekly revivals for ETH and Chainlink (LINK) petered out entirely, with falls of -4.10% and -2.14% respectively.
Ripple’s advance underpinned a somewhat unusual near-uniform advance by key Non-Programmable tokens. Stellar’s (XLM) + 79.52% jump was second largest in this sub-category, for an average weekly +36.55% overall. With all sub-categories rising to some extent though, upward pressure from recent febrile political developments appeared to have lingered. That said, the +15.98% ascent by the Culture sub-category was the frothiest. It was fuelled almost entirely by a rush for mascot-emblemed meme coins, led by BONK’s parabolic +107.35% leap, followed by PEPE, +73.71%. A broad-based progression by General Purpose Smart Contract Platforms tokens looked more reliable. Hedera (HBAR), +58.26%, gained most in this segment, following news of the first U.S. filing to list an HBAR ETF, also helping explain the rise by ADA mentioned earlier. Algorand (ALGO), +30.28%, SUI, +16.21%, and EOS, +13.51%, also benefitted.
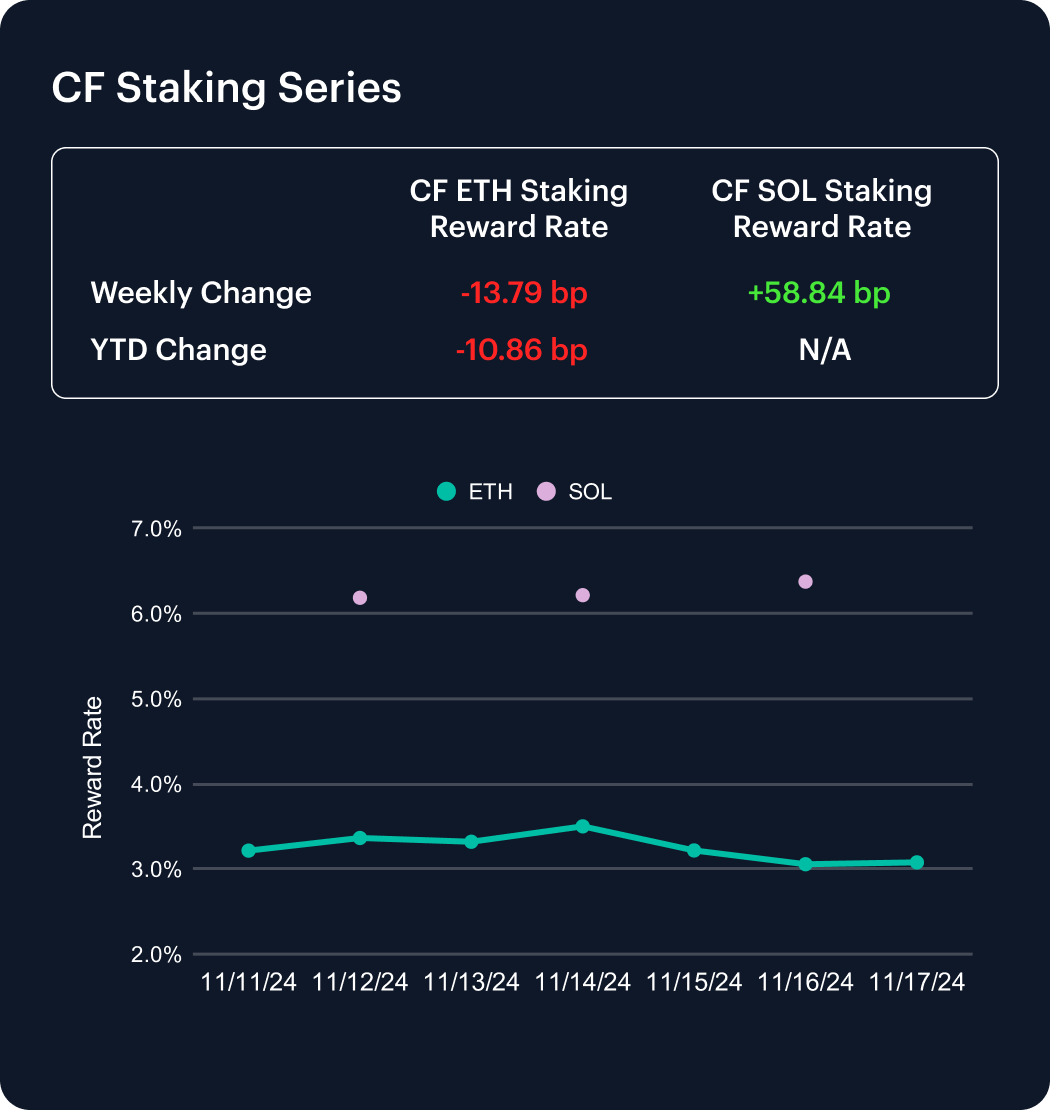
We’re excited to spotlight the addition of the CF SOL Staking Reward Rate Index (SOL_SRR), and the CF SOL Staked Return Index (SOLUSD_SRIC) to our CF Staking Series. Read the launch post here. As for staking rewards tied to the first asset represented within the series, our CF ETH Staking Reward Rate Index continued to indicate deteriorating rewards, as the weekly change moved -13.79 basis points (bp) lower. A similar year-to-date change of -10.86 bp means prospects of 2024 progress by Ethereum staking rewards remain in the balance.
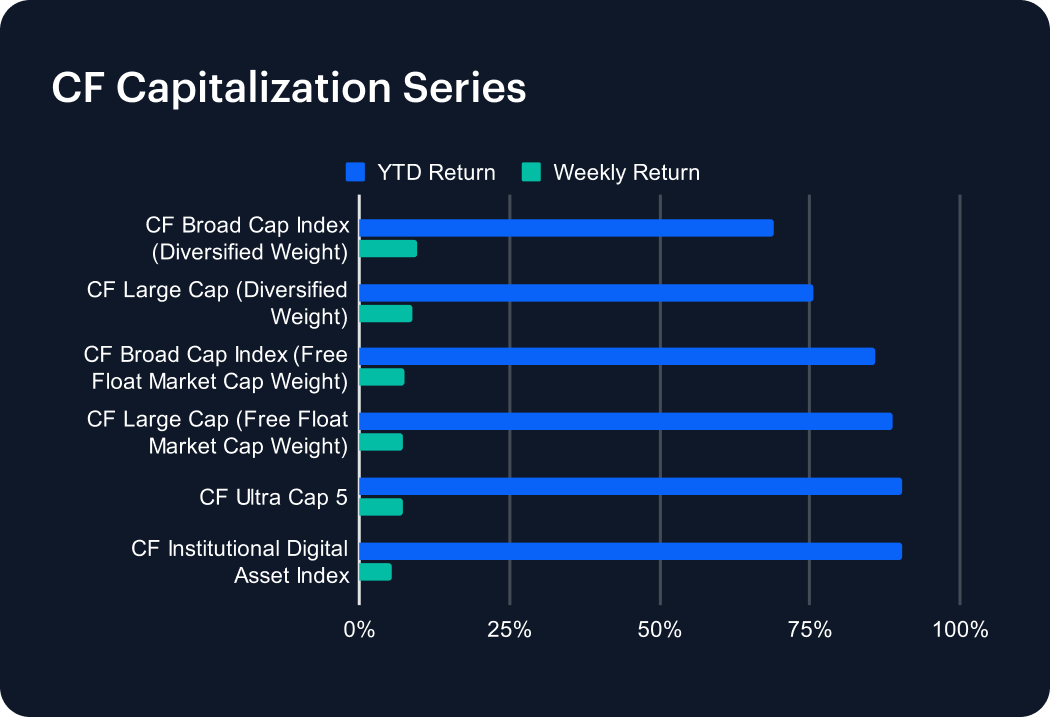
Narrow differentials on a weekly basis within this series point to relatively broad advances across mega cap and large cap tokens, though bereft of the spectacular standouts seen among lesser-capitalized altcoins. Diversified-weight portfolios inched ahead: the CF Broad Cap Index (Diversified Weight) gained +9.66%, and the CF Large Cap (Diversified Weight) added +8.91%. Modest weekly returns by Bitcoin and Ether were reflected by the relative underperformance of the CF Institutional Digital Asset Index, which rose +5.43%.
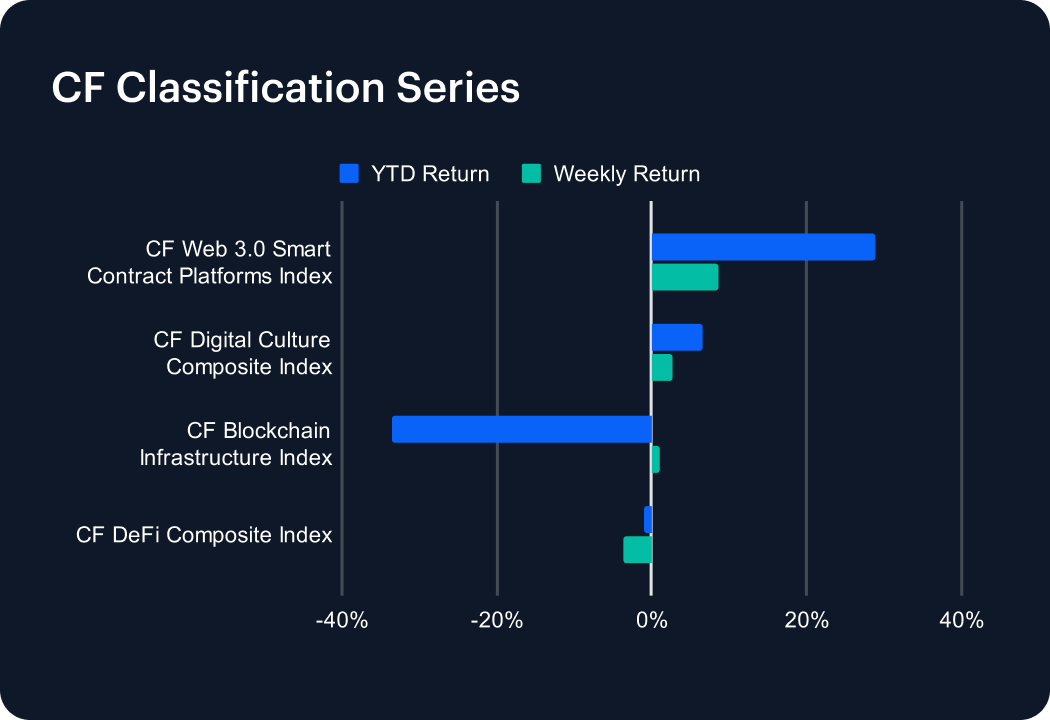
Somewhat static year-to-date (YTD) performances by the CF Digital Culture Composite Index and the CF DeFi Composite Index persist. The former inched forward by +2.70% for the week, extending its still-modest YTD increase to +6.53%. The latter edged -3.59% lower during the week, turning its YTD return mildly negative by -0.99%. The jump by HBAR outlined in the CF DACS section accounts for the CF Web 3.0 Smart Contract Platforms Index’s weekly outperformance, +8.65%, solidifying its YTD series outperformance to +28.87%. Meanwhile, the CF Blockchain Infrastructure Index’s weekly +1.04% gain barely scratched its underperformer status, leaving it down -33.56% for the year.
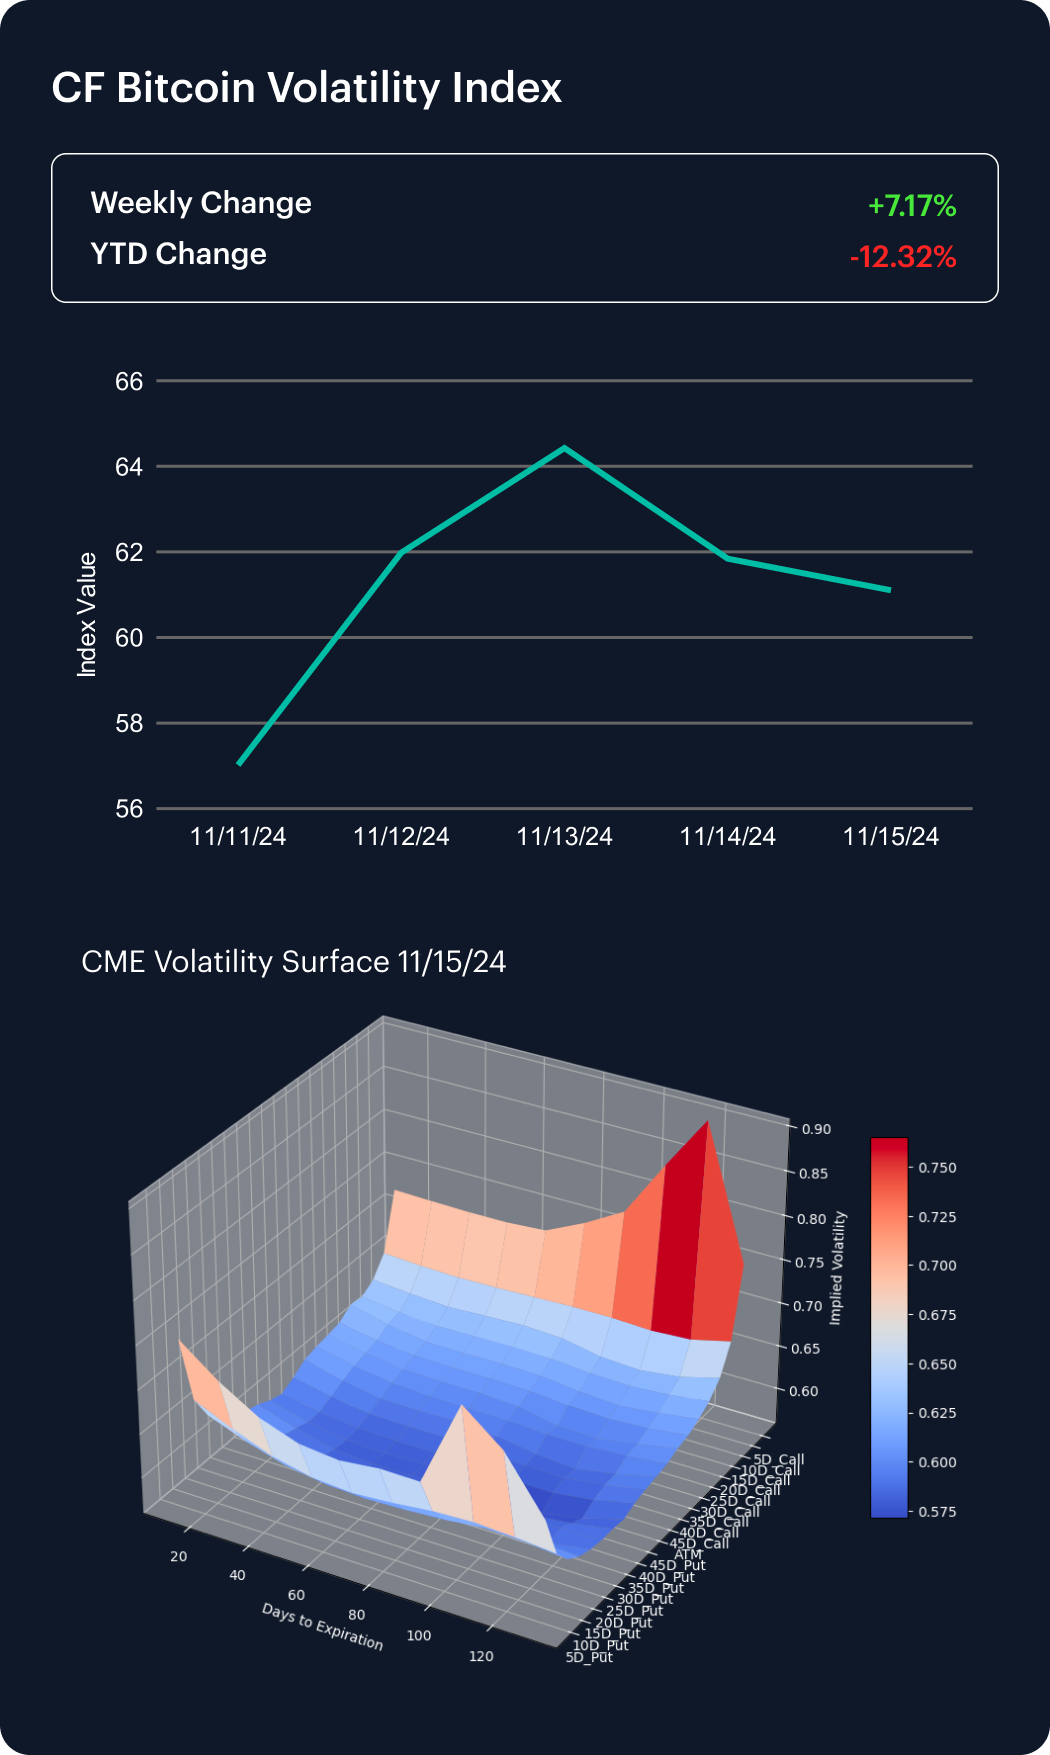
A mild reversion of CME Bitcoin implied volatility was seen over the week, within what is still, almost certainly for now, a medium-term weakening trend. The change of our CF Bitcoin Volatility Index Settlement Rate (BVXS) ended the week +7.17% higher, almost entirely erasing the extent of the negative change posted the previous week. The decline of BVXS’s YTD change was trimmed to -12.32%.
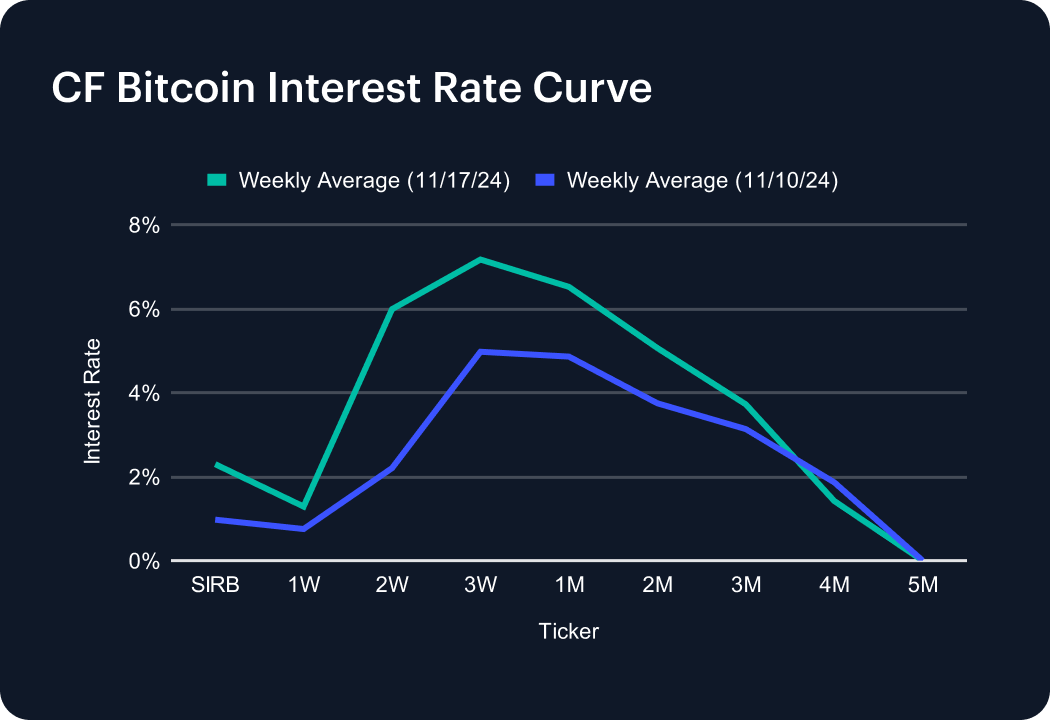
The latest addition to CF Benchmark’s CF Interest Rate Curve Series is the CF USDT Interest Rate Curve, providing a comprehensive benchmark for stablecoin borrowing and lending rates. It is a longstanding component of our CF Bitcoin Interest Rate Curve (BIRC). During the most recent week, operable rates returned to almost all tenors across the CF BIRC term structure, save for the 5-month tenor, where the zero reading extended to a third consecutive week. Notable weekly changes included those by the session rate, which advanced approximately a basis point (bp) to 2.2 bp, the 2-week tenor’s circa 2 bp uptick to almost 6 bp, and a ~2.19 bp rise to around 7.17 bp at the 3-week tenor.
The information contained within is for educational and informational purposes ONLY. It is not intended nor should it be considered an invitation or inducement to buy or sell any of the underlying instruments cited including but not limited to cryptoassets, financial instruments or any instruments that reference any index provided by CF Benchmarks Ltd. This communication is not intended to persuade or incite you to buy or sell security or securities noted within. Any commentary provided is the opinion of the author and should not be considered a personalised recommendation. Please contact your financial adviser or professional before making an investment decision.
Note: Some of the underlying instruments cited within this material may be restricted to certain customer categories in certain jurisdictions.
Changes to the Token Market Price Benchmarks Series - Market Prices – 21 July 2026
The Administrator has confirmed changes to the Token Market Price Family for the period 14 July 2026 to 21 July 2026.

CF Benchmarks
Softer CPI Reprices July Hike Risk & Lifts Digital Assets
Digital assets extended their recovery over the past week as cooler US inflation prints repriced Fed expectations; the bid was broad across the large cap indices, growth factor leadership returned, stablecoin funding repriced lower, and stress stayed isolated in names hit by token-specific news.
Mark Pilipczuk
Notice of the Demising of CF Dai-Dollar Settlement Price and Spot Rate
The Administrator announces that it will demise the CF Dai-Dollar Settlement Price (DAIUSD_RR) and CF Dai-Dollar Spot Rate (DAIUSD_RTI) which are members of the CF Digital Asset Index Family.
CF Benchmarks
By clicking Accept, you consent to CF Benchmarks's use of cookies.
Visit Cookie Settings to learn how CF Benchmarks uses cookies and to adjust your preferences.