
Jan 26, 2026
Weekly Index Highlights, January 26, 2026
Market Performance Update
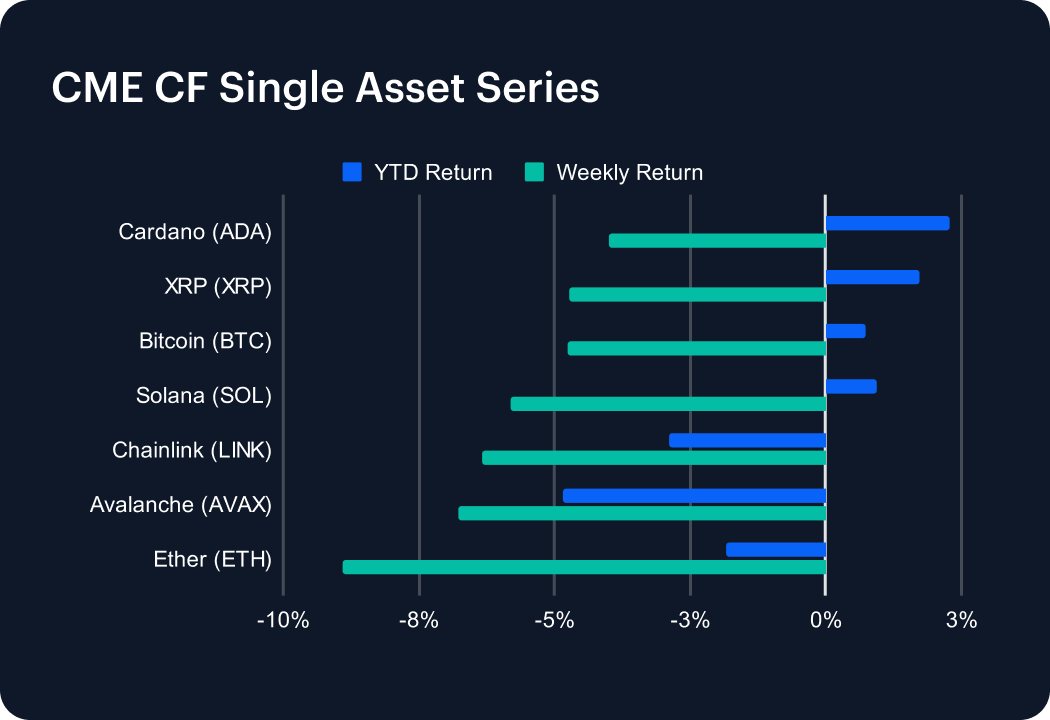
Digital assets reversed sharply week-on-week (w/w) with every CME CF Single Asset Series benchmark declining between -4.0% and -8.9%. Bitcoin fell -4.7% w/w, trimming its year-to-date (YTD) tally even further to just +0.7%, while Ether dropped -8.9% (YTD -1.8%), leaving ETH underperforming BTC by -4.2 percentage points (pp) on the week. Among higher-beta majors, Cardano was the relative ‘defensive’ in a down tape, at -4.0% w/w (+2.3% YTD), while XRP also held within the upper end of the weekly loss band, with -4.7% w/w to stand +1.7% YTD. At the other end of the distribution, Ether was the laggard at -8.9%, reinforcing the notion that the drawdown was not merely a broad risk-off move but also a repricing of platform-beta. The swings versus the prior Weekly Index Highlights edition are material: BTC moved from +4.2% to -4.7% (a -9.0 pp shift), and ETH moved from +7.0% to -8.9% (a -15.9 pp shift). Unfortunately for near-term sentiment, these are consistent with an abrupt compression of risk appetite, much more than a marginal drift lower.
Volatility Analysis
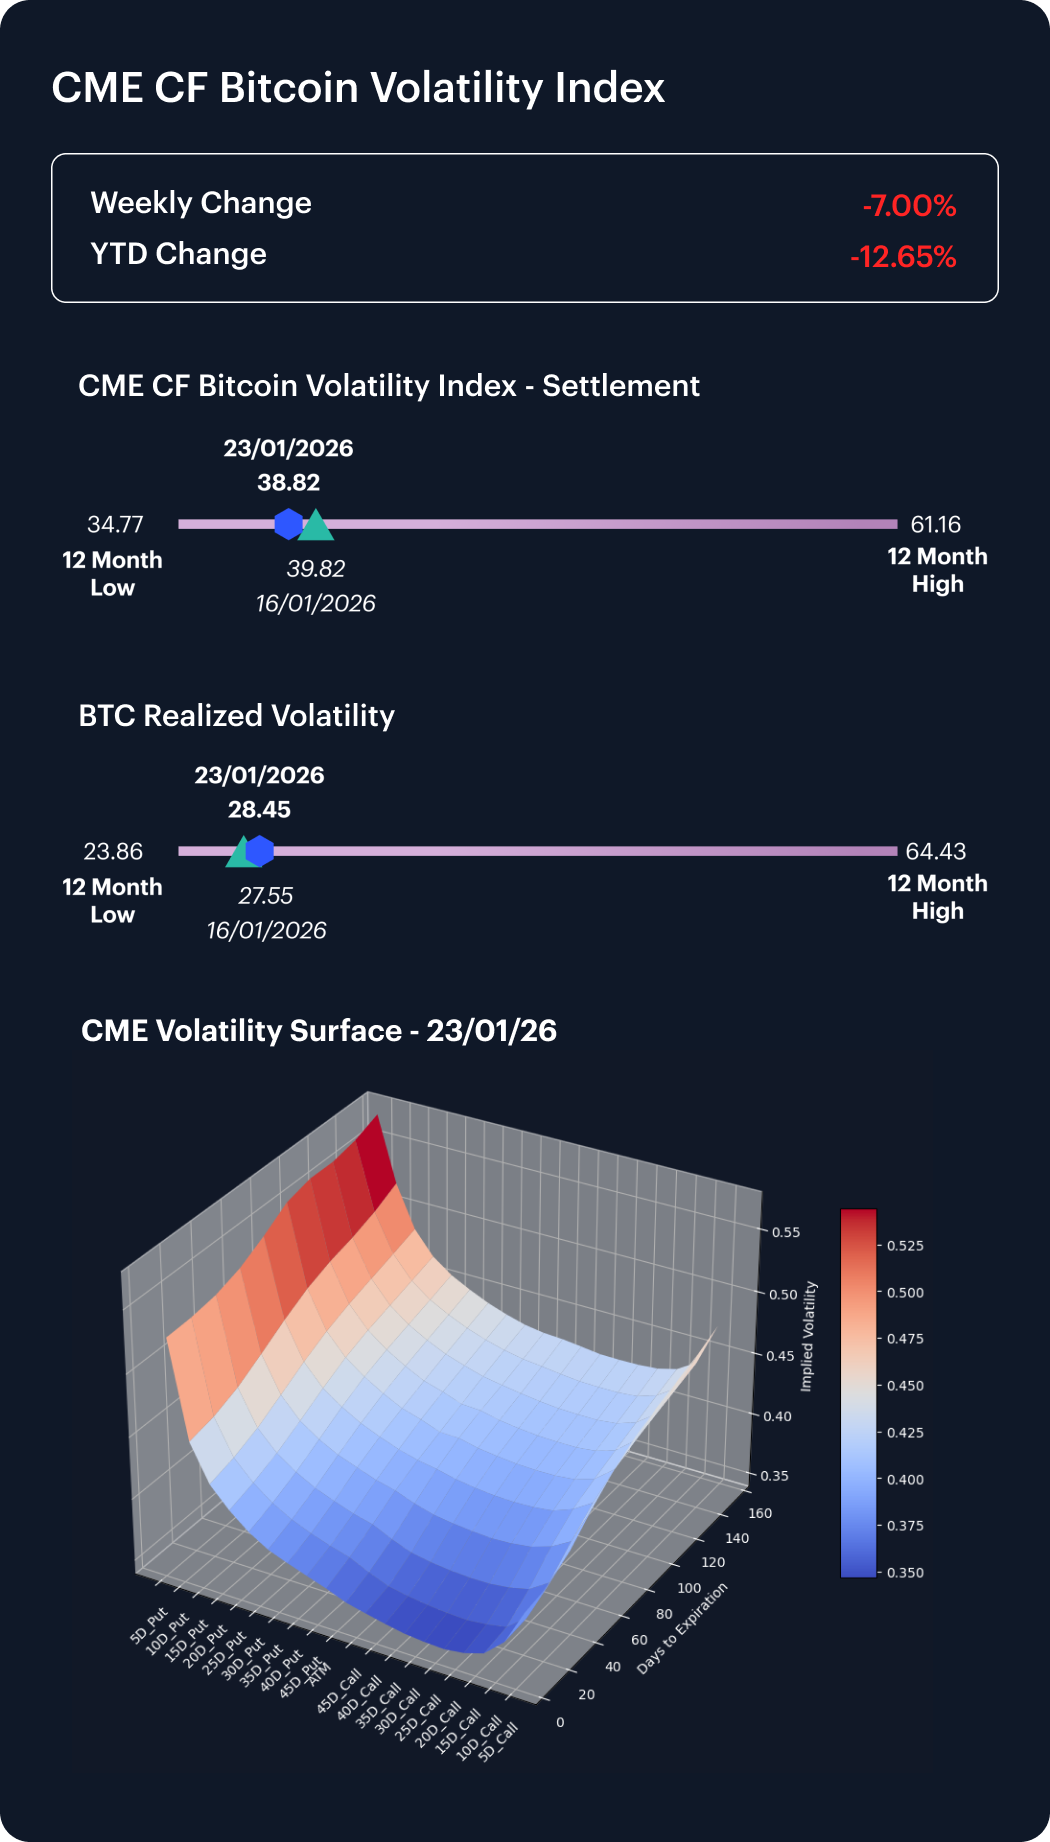
Bitcoin volatility declined Monday 19th through Friday 23rd, possibly reflecting a spillover effect from that Monday being a traditional market holiday, but certainly reflective of the fact that this stretch omits the outbreak of a fresh downdraft over the most recent weekend’s trading. The CME CF Bitcoin Volatility Index – Settlement (BVXS) fell from 41.74 to 38.82, a -2.92 vol. point move, with the path printing consistently lower each session, and the largest step-down into Friday (-1.49 points from Thursday to Friday). BTC realized volatility also eased, from 30.46 to 28.45 (-2.01 vol points), with most of the decline front-loaded earlier in the week (down ~2.01 points by Thursday, then essentially flat into Friday). The implied–realized spread therefore narrowed from 11.28 to 10.37 (-0.91 vol points): implied risk premia remained positive, but they compressed as implied softened slightly more than realized over the window. In levels, both metrics sit near the lower end of their trailing 12-month ranges (BVX 34.77–61.16; realized 23.86–64.43), reinforcing that, despite the broader market drawdown, volatility pricing remained comparatively subdued into the Friday close.
Market Cap Index Performance
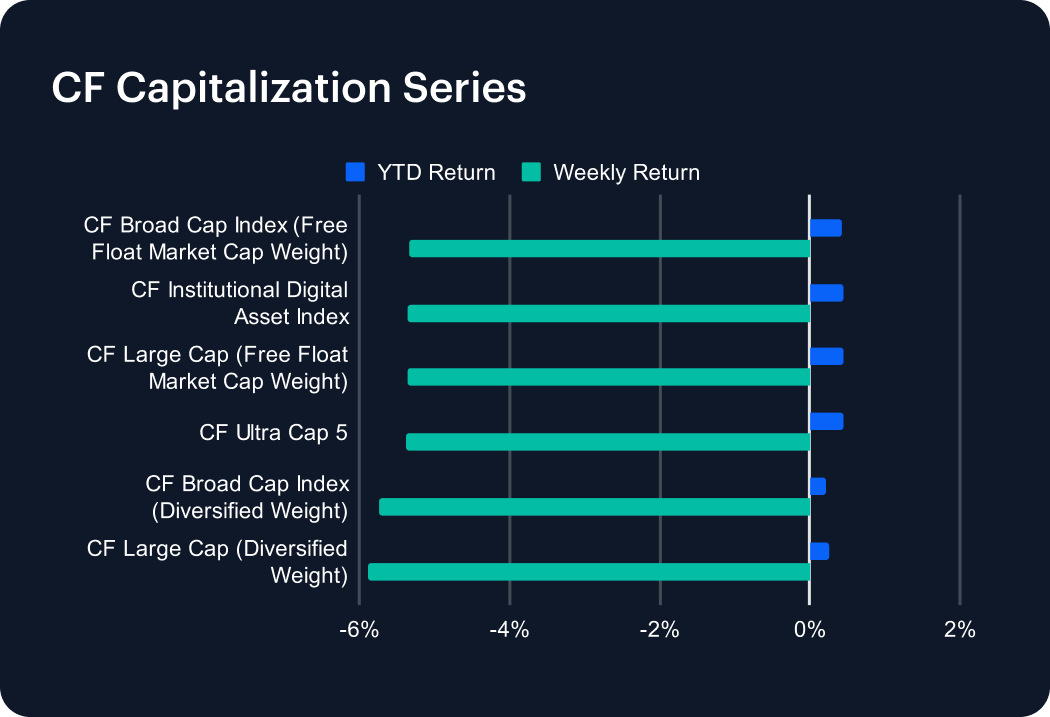
Capitalization indices traded with unusually tight co-movement, with weekly returns clustered in a -5.88% to -5.33% band (0.55 pp of dispersion). The CF Ultra Cap 5 fell -5.37% w/w (YTD +0.45%), while the free-float market-cap-weighted CF Large Cap declined -5.36% w/w (YTD +0.45%) and the CF Broad Cap Index (Free Float Market Cap Weight) fell -5.33% w/w (YTD +0.42%). The CF Institutional Digital Asset Index posted -5.36% w/w (YTD +0.44%), aligning closely with the large-cap complex, while diversified-weight indices leaned marginally weaker, with the CF Broad Cap (Diversified Weight) down -5.73% w/w (YTD +0.22%) and the CF Large Cap (Diversified Weight) down -5.88% w/w (-0.27% YTD). The near-parallelism of weekly returns indicates that the sell-off was expressed more as a market-wide risk reduction than as a strong internal rotation across capitalization tiers, even though ETH’s -8.9% w/w fall (see Market Performance Update above) suggests some differentiation persisted at the single-asset level.
Factors Analysis
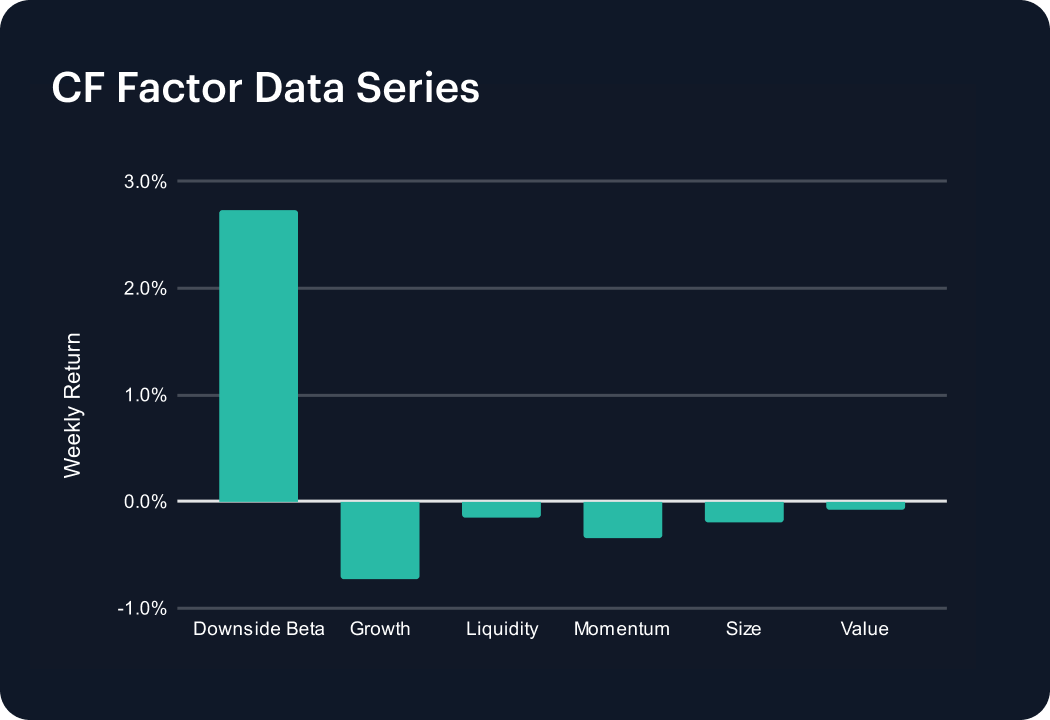
Factor performance showed moderate dispersion over the week, led by a clear upside in Downside Beta alongside broadly negative prints across most other factors. Downside Beta rose +2.74% on a weekly compounded basis, while Liquidity slipped -0.14% and Value edged lower at -0.08%. Momentum and Size declined -0.34% and -0.20%, respectively, and Growth was the laggard at -0.72%. The spread between best and worst factors was therefore 3.46 pp (Downside Beta +2.74% versus Growth -0.72%), indicating rotation. Versus the prior edition, Downside Beta moved from -0.21% to +2.74% (+2.95 pp), while Size swung from +1.12% to -0.20% (-1.32 pp). These moves are consistent with a week that rewarded defensive exposure while compressing the contribution from “size” leadership.
Classification Series Analysis
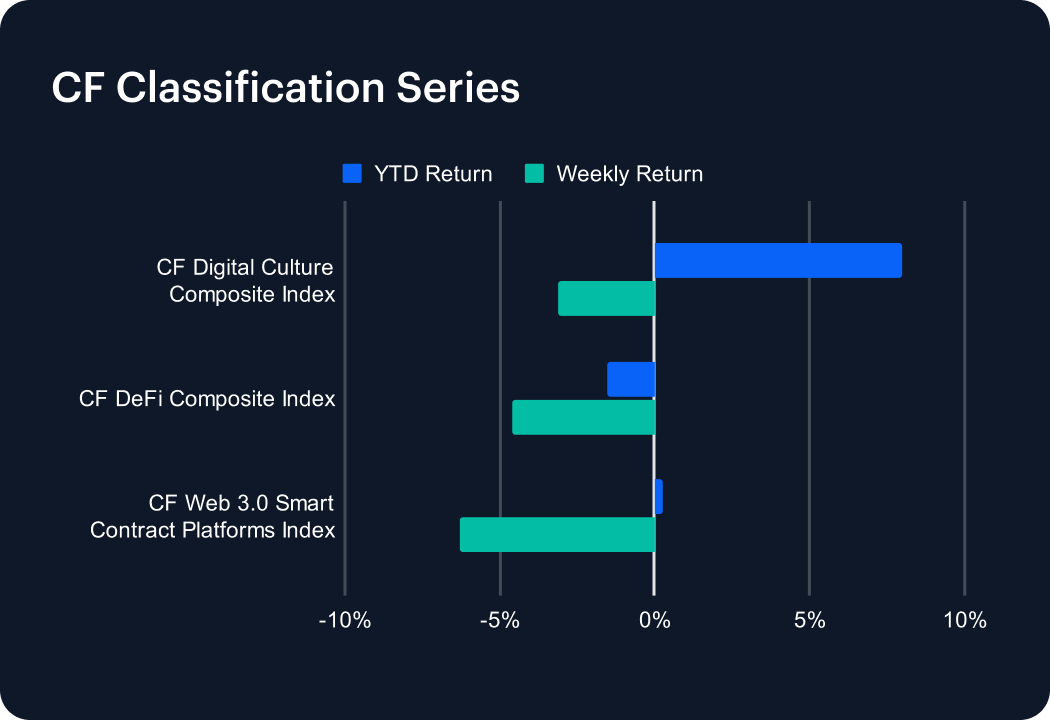
The Classification Series indices echoed the sector-level de-risking, with all three composites negative and the spread between best and worst at 3.2 pp. The CF Digital Culture Composite Index declined -3.1% w/w, the CF DeFi Composite Index fell -4.6% w/w, and the CF Web 3.0 Smart Contract Platforms Index moved lower by -6.3% w/w. The ordering matters: culture-related exposures were comparatively resilient versus DeFi and platform-beta, which tended to sit closer to the lower end of the weekly loss range, consistent with the single-asset picture where ETH underperformed BTC by -4.2 pp. The change versus the prior edition is stark across the board: Digital Culture shifted from +9.9% to -3.1% (a -13.0 pp swing), DeFi from +2.4% to -4.6% (-7.1 pp), and Smart Contract Platforms from +1.9% to -6.3% (-8.2 pp). Taken together, the classification results point to a week where investors paid a larger penalty for complexity and platform-beta than for consumer-facing exposure.
Sector Analysis
CF DACS sector averages also rotated decisively lower, with the best-performing sector still negative: The Culture Sub-Category averaged -2.4% w/w, compared with Infrastructure at -6.0% w/w, producing a cross-sector spread of 3.6 pp. Finance averaged -4.0% and Non-Programmable averaged -3.5%, while Programmable and Utility sat deeper in the drawdown at -5.1% and -5.7%, respectively, indicating that the week’s risk-off impulse was broad but not uniform. Dispersion was more visible at the constituent level: AXS (Culture, Gaming Segment) gained +23.2% w/w even as the overall sector averaged -2.4%, while ICP (Programmable, General Purpose Smart Contract Platforms) fell -14.8% w/w. Relative to the prior edition, Culture moved from +11.6% to -2.4% (a -14.0 pp swing), underscoring how quickly high-beta leadership can unwind once the tape turns.
CF Staking Series
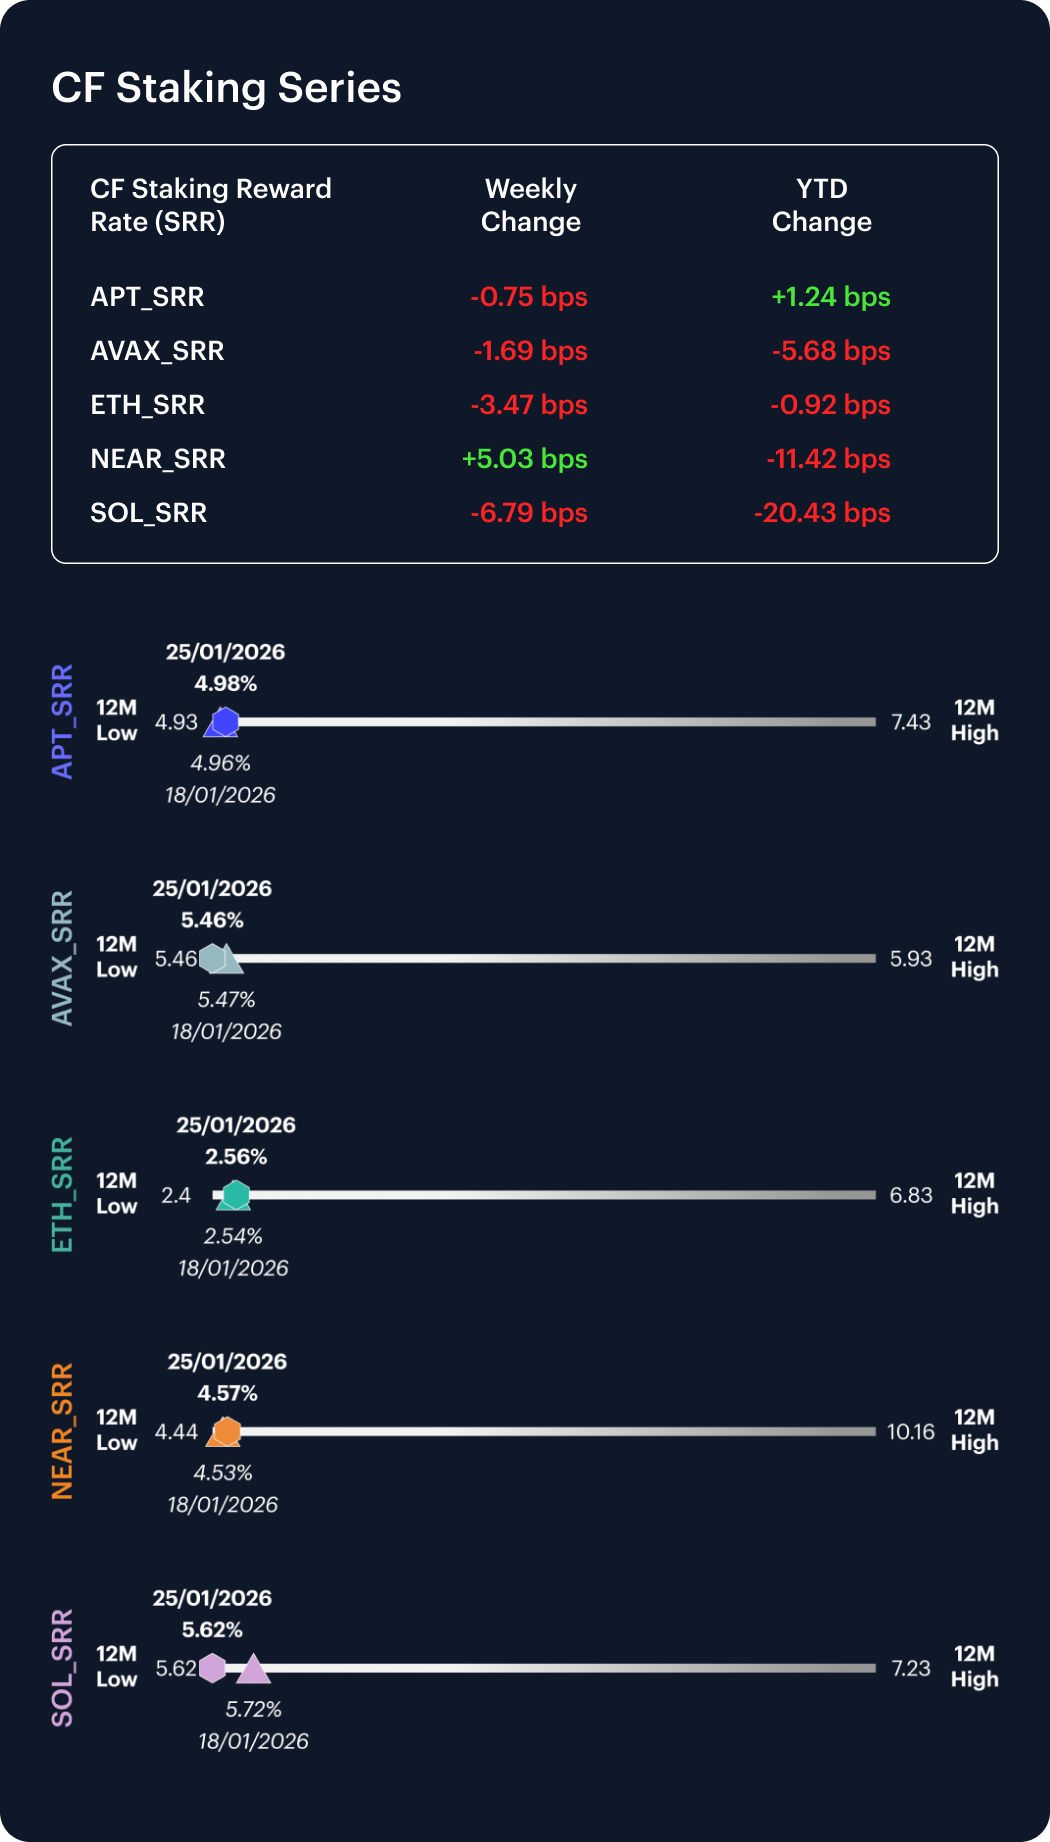
Staking series performance was mixed on a token basis, while reward rates showing measured but meaningful intra-week repricing. On staking total returns, NEAR was the only positive at +1.11% w/w, while ETH and SOL declined -1.34% and -1.19% w/w, and APT and AVAX were modestly negative at -0.15% and -0.31% w/w. Reward-rate levels ended the week at 5.62% for SOL, 5.46% for AVAX, 4.57% for NEAR, 4.98% for APT and 2.56% for ETH. Intra-week (January 19th to January 25th) changes were as follows: NEAR’s reward rate widened by +5.03 bps, while SOL compressed by -6.79 bps, ETH by -3.47 bps, AVAX by -1.69 bps and APT by -0.75 bps. The cross-asset reward-rate dispersion in that intra-week move is therefore 11.82 bps (from +5.03 to -6.79), signaling a week where yield dynamics were not fully synchronized even as price action was broadly risk-off.
Interest Rate Analysis
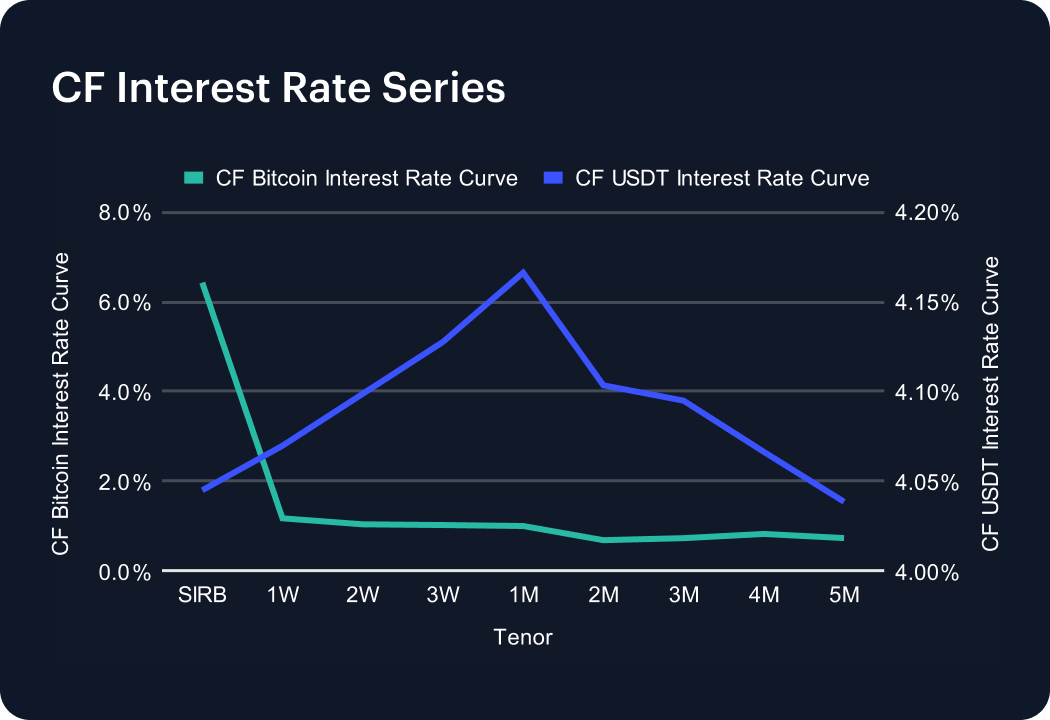
The BIRC curves repriced in opposite directions across BTC and USDT, widening the funding differential. On BTC, SIRB printed 6.43% (down -135 bps versus the prior edition), while 1W printed 1.17% (down -30 bps) and 1M printed 1.00%, producing a steep front-end dislocation where SIRB sits 526 bps above 1W. Longer tenors also moved lower, with declines of roughly -70 bps to -106 bps across 2M to 5M. In contrast, the USDT curve shifted materially higher: 1W ended at 4.07% (up +98 bps) and 1M at 4.17% (up +101 bps), leaving the 1M point about 9.7 bps above 1W and indicating a modestly upward-sloping short end. The 1W USDT–BTC differential widened to 290 bps, a +128 bps expansion versus the prior edition. This is consistent with tighter stablecoin funding conditions even as BTC funding rates eased across the curve.
The information contained within is for educational and informational purposes ONLY. It is not intended nor should it be considered an invitation or inducement to buy or sell any of the underlying instruments cited including but not limited to cryptoassets, financial instruments or any instruments that reference any index provided by CF Benchmarks Ltd. This communication is not intended to persuade or incite you to buy or sell security or securities noted within. Any commentary provided is the opinion of the author and should not be considered a personalised recommendation. Please contact your financial adviser or professional before making an investment decision.
Note: Some of the underlying instruments cited within this material may be restricted to certain customer categories in certain jurisdictions.
Changes to the Token Market Price Benchmarks Series - Market Prices – 21 July 2026
The Administrator has confirmed changes to the Token Market Price Family for the period 14 July 2026 to 21 July 2026.

CF Benchmarks
Softer CPI Reprices July Hike Risk & Lifts Digital Assets
Digital assets extended their recovery over the past week as cooler US inflation prints repriced Fed expectations; the bid was broad across the large cap indices, growth factor leadership returned, stablecoin funding repriced lower, and stress stayed isolated in names hit by token-specific news.
Mark Pilipczuk
Notice of the Demising of CF Dai-Dollar Settlement Price and Spot Rate
The Administrator announces that it will demise the CF Dai-Dollar Settlement Price (DAIUSD_RR) and CF Dai-Dollar Spot Rate (DAIUSD_RTI) which are members of the CF Digital Asset Index Family.
CF Benchmarks
By clicking Accept, you consent to CF Benchmarks's use of cookies.
Visit Cookie Settings to learn how CF Benchmarks uses cookies and to adjust your preferences.