
Mar 09, 2026
CF Benchmarks Quarterly Attribution Reports - March 2026

Liquidation Cascades Collide with Regulatory Gridlock and Geopolitical Escalation
The rebalancing period opened with the FOMC cutting rates by 25 bps, a move that failed to unlock risk appetite as meeting minutes revealed a sharp divide among voting members and BTC oscillated near $90,000. A blurred macro backdrop of stronger than expected GDP alongside softer inflation, with delayed payrolls and retail sales data muddying the growth picture, compounded year-end tax-loss harvesting and seasonally thin liquidity. Flows turned selective, relative strength narrowed to mega-caps, and implied volatility compressed, consistent with low-conviction positioning as investors deferred risk re-engagement pending cleaner data and clearer guidance on the 2026 easing path.
The new year brought no relief. The Federal Reserve held rates steady, but investor attention shifted abruptly to leadership risk when President Trump nominated Kevin Warsh as the next Fed Chair, introducing significant uncertainty around the pace of future rate cuts and the central bank's reaction function. BTC traded defensively, consolidating near the lower end of its range before selling off sharply into month-end, while crypto legislation stalled and geopolitical tensions reinforced a risk-off posture. With policy clarity delayed and macro data distorted by seasonal effects, liquidity thinned and conviction remained low across higher-beta tokens as markets awaited clearer signals on monetary and regulatory direction.
Uncertainty metastasized in February, triggering a liquidation cascade that briefly drove BTC below $60,000 before the market stabilized in the mid-$60,000s, a drawdown severe enough that the CME CF Bitcoin Volatility Index (BVX) registered a four-standard-deviation spike. The Senate confirmation process for Warsh faced early headwinds when Senator Tillis vowed to block the nomination pending a DOJ investigation into the Fed, while the CLARITY Act stalled after two White House-brokered sessions failed to bridge a stablecoin interest payment dispute. Geopolitical risk escalated further when coordinated U.S.-Israeli military strikes on Iran on February 28 spiked uncertainty across global oil markets. With legislative progress frozen and risk-off sentiment entrenched, higher-beta tokens bore the brunt of forced deleveraging as liquidity continued to thin.
Key takeaways:
Liquidity Premia Define Relative Returns
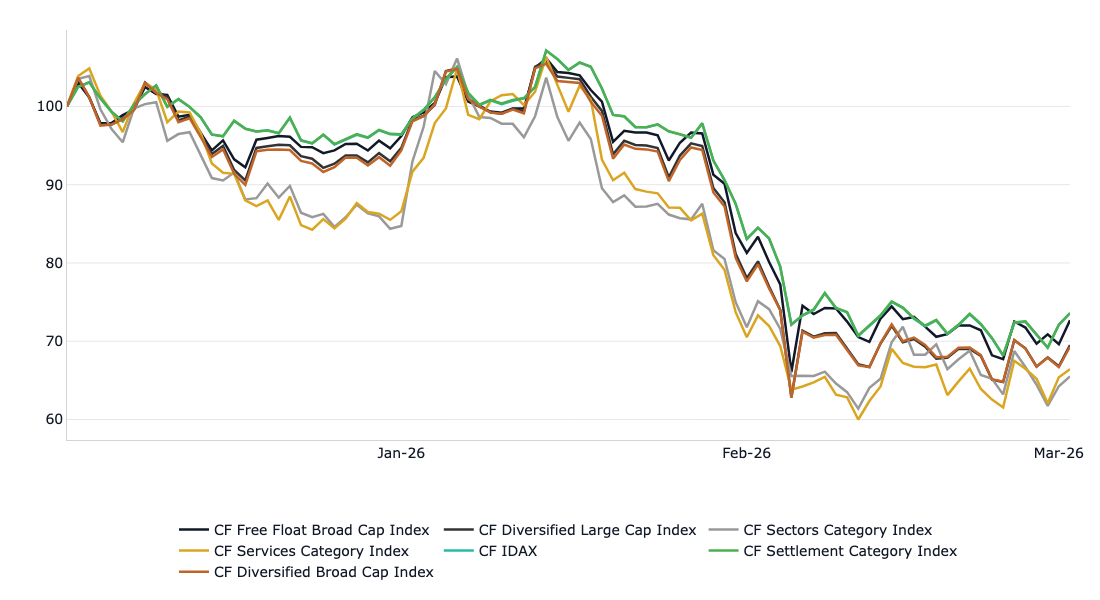
- The CF Free Float Broad Cap Index declined 28.08% over the period, slightly outperformed by the mega-caps in the CF IDAX Index at -27.90%, while the CF Diversified Large Cap Index underperformed modestly at -30.71%, reflecting the outsized drawdown in select large-cap names that bore disproportionate selling pressure during the liquidation cascade. More diversified exposures saw steeper losses: the CF Diversified Broad Cap Index fell 30.87% as smaller caps struggled to absorb outflows.
- This dynamic was further evident across the three CF DACS L1 category indices: the CF Settlement Category Index declined 27.87%, meaningfully outperforming both the CF Services Category Index at -34.60% and the CF Sectors Category Index at -34.74%, a spread of nearly 700 basis points between the most and least defensive categories.
- Cross-asset correlations with equities moderated over the period, with the S&P 500 declining to 0.41 from 0.47 and Nasdaq 100 to 0.46 from 0.51. Fixed income relationships remained stable across Treasury tenors, while commodity and currency correlations weakened. Volatility benchmarks preserved their inverse relationship with digital assets, though both the MOVE Index and VIX moderated, consistent with a compressed rate volatility environment. Overall, diversification benefits versus bonds, currencies, and real assets remained broadly intact.
Normalized Index Performance
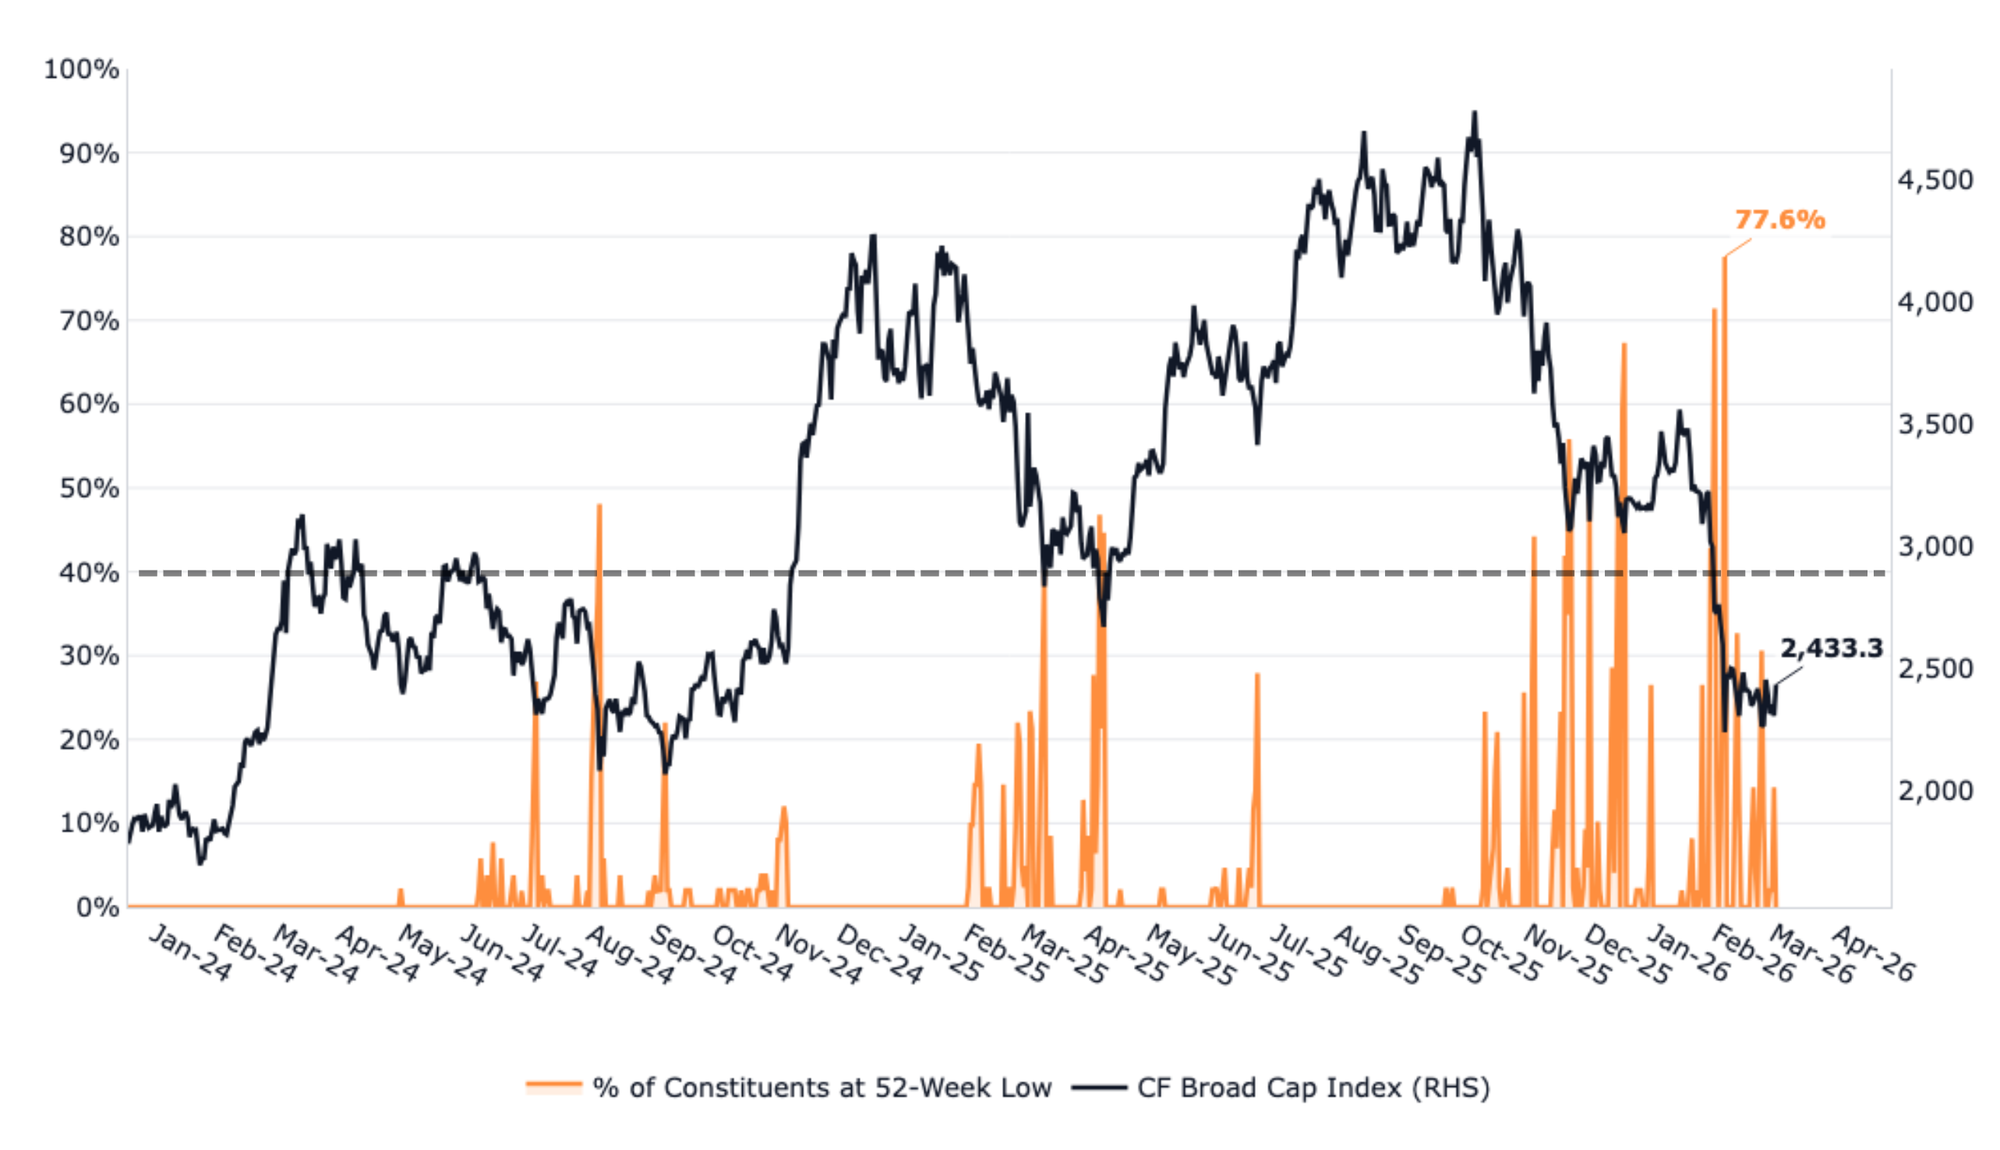
Breadth Deterioration Signals Peak Capitulation
The percentage of CF Broad Cap Index constituents printing 52-week lows reached 77.6% in February 2026, the highest reading in the index's two-year history and a signal of near-total breadth exhaustion. Historically, sustained readings above 40% have coincided with durable market lows: the August 2024 yen carry trade unwind and the April 2025 Liberation Day selloff both resolved higher shortly after this threshold was breached. At 77.6%, the current episode far exceeds all prior stress events in magnitude, suggesting the market has entered a zone of deep capitulation that has historically preceded recovery rather than continued decline. However, the drawdown that started on October 10th proved an exception, where breadth deterioration crossed 40% but failed to mark a durable bottom as macro headwinds and forced deleveraging drove continued selling.
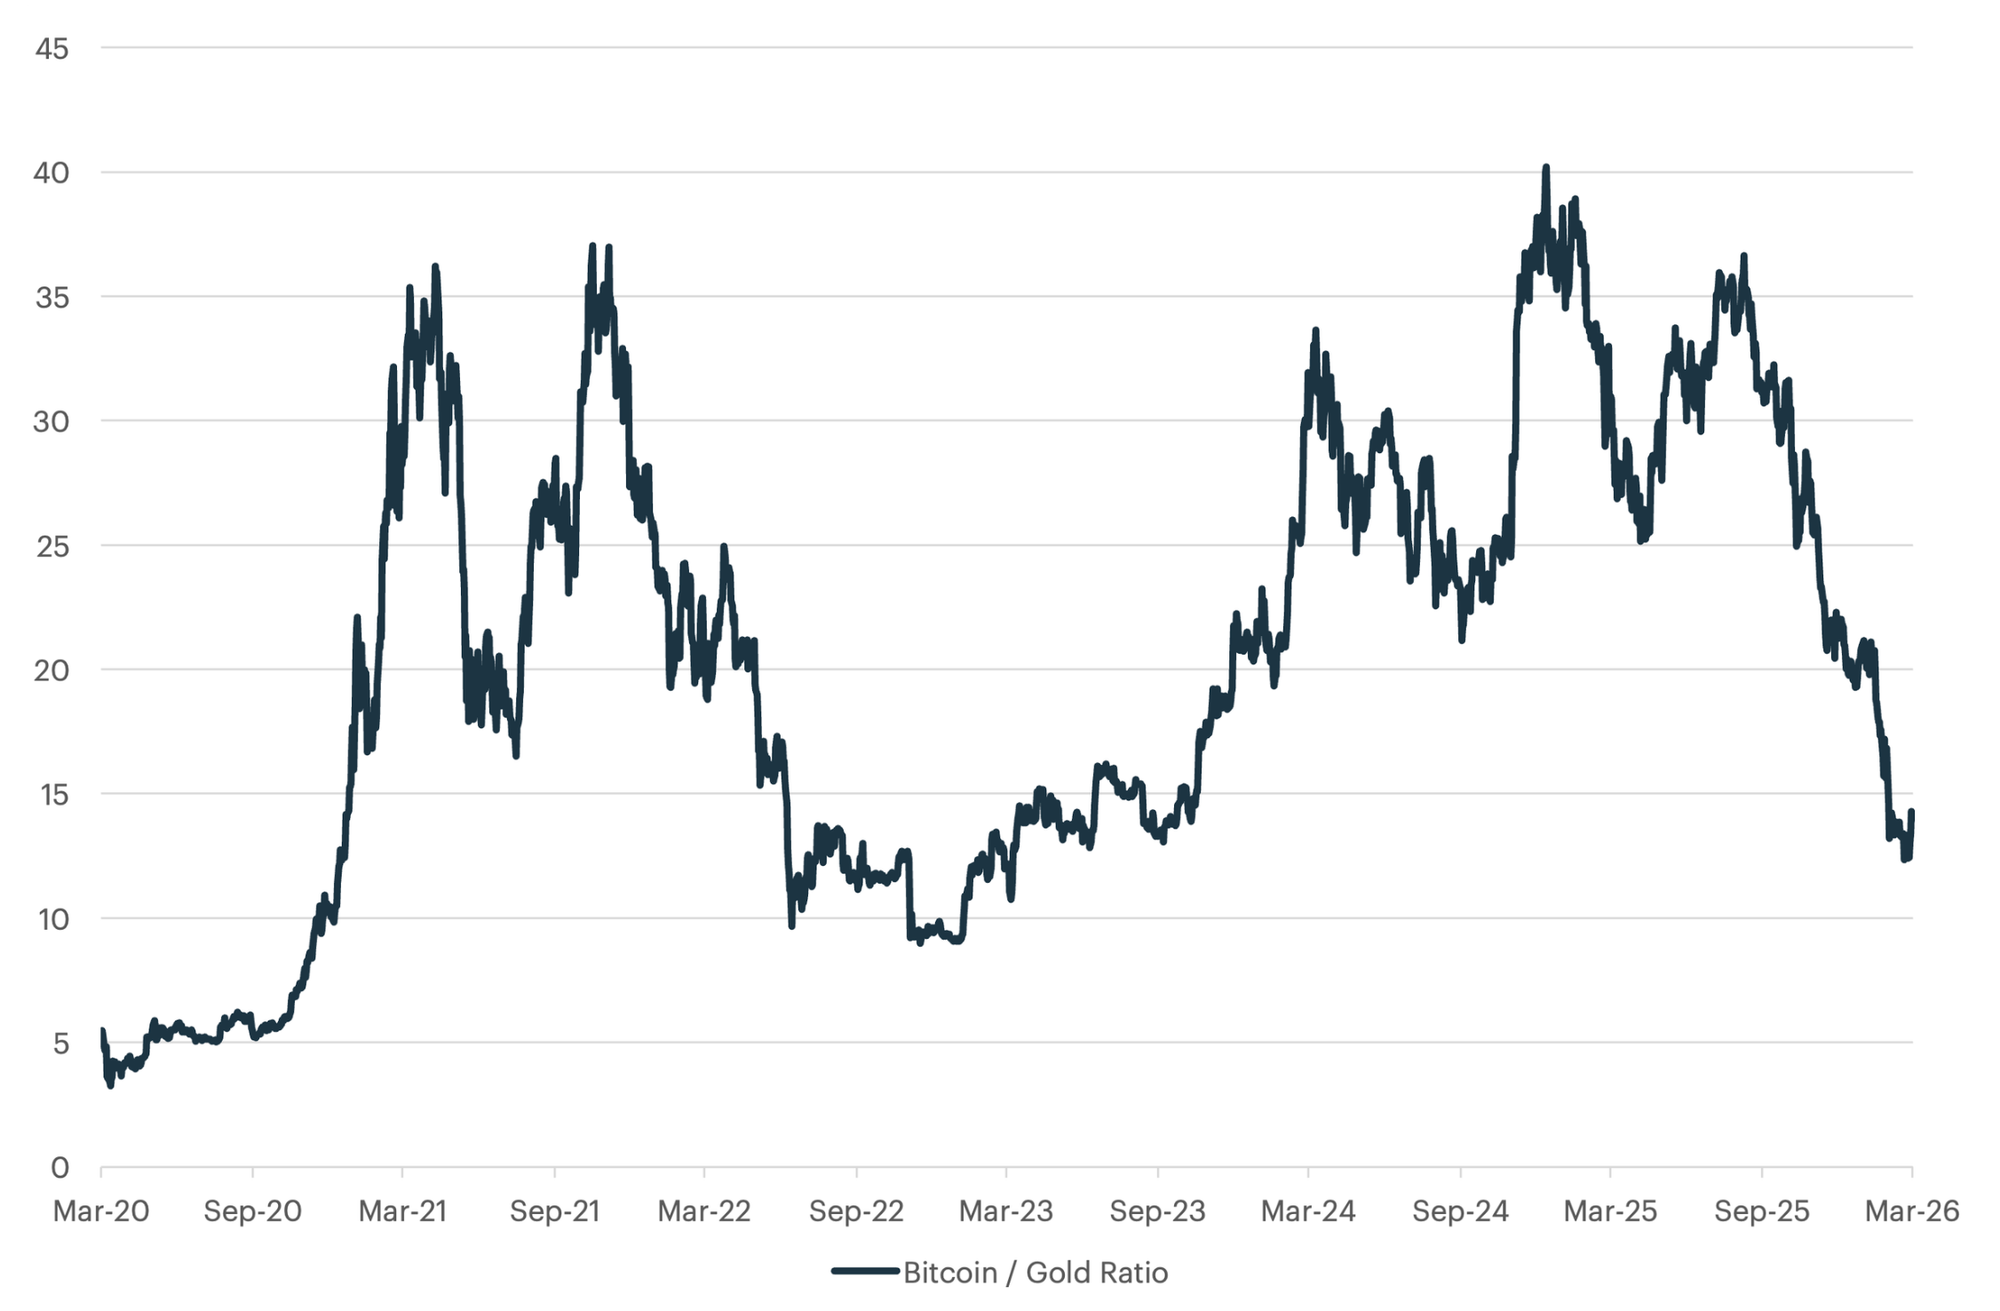
Bitcoin Deeply Undervalued Against Gold
The Bitcoin/Gold ratio has collapsed from a peak of approximately 40 in late 2024 to roughly 13 in March 2026, approaching the 2022 bear market trough of 9 and signaling acute risk-off rotation away from digital assets toward traditional safe havens. Given Bitcoin's dominant weighting within the CF Institutional Digital Asset Index, which declined 27.90% over the period, the ratio's trajectory serves as a direct proxy for the macro conditions facing institutional digital asset allocators: de-risking and gold's ascent above $5,100 per ounce reflect the same flight-to-safety dynamics that weighed on the asset class throughout the rebalancing period. Historically, the ratio has cycled through bear markets lasting approximately 14 months before recovering sharply, and at 13, it is approaching historically significant undervaluation levels, though macro headwinds and geopolitical uncertainty have yet to resolve.
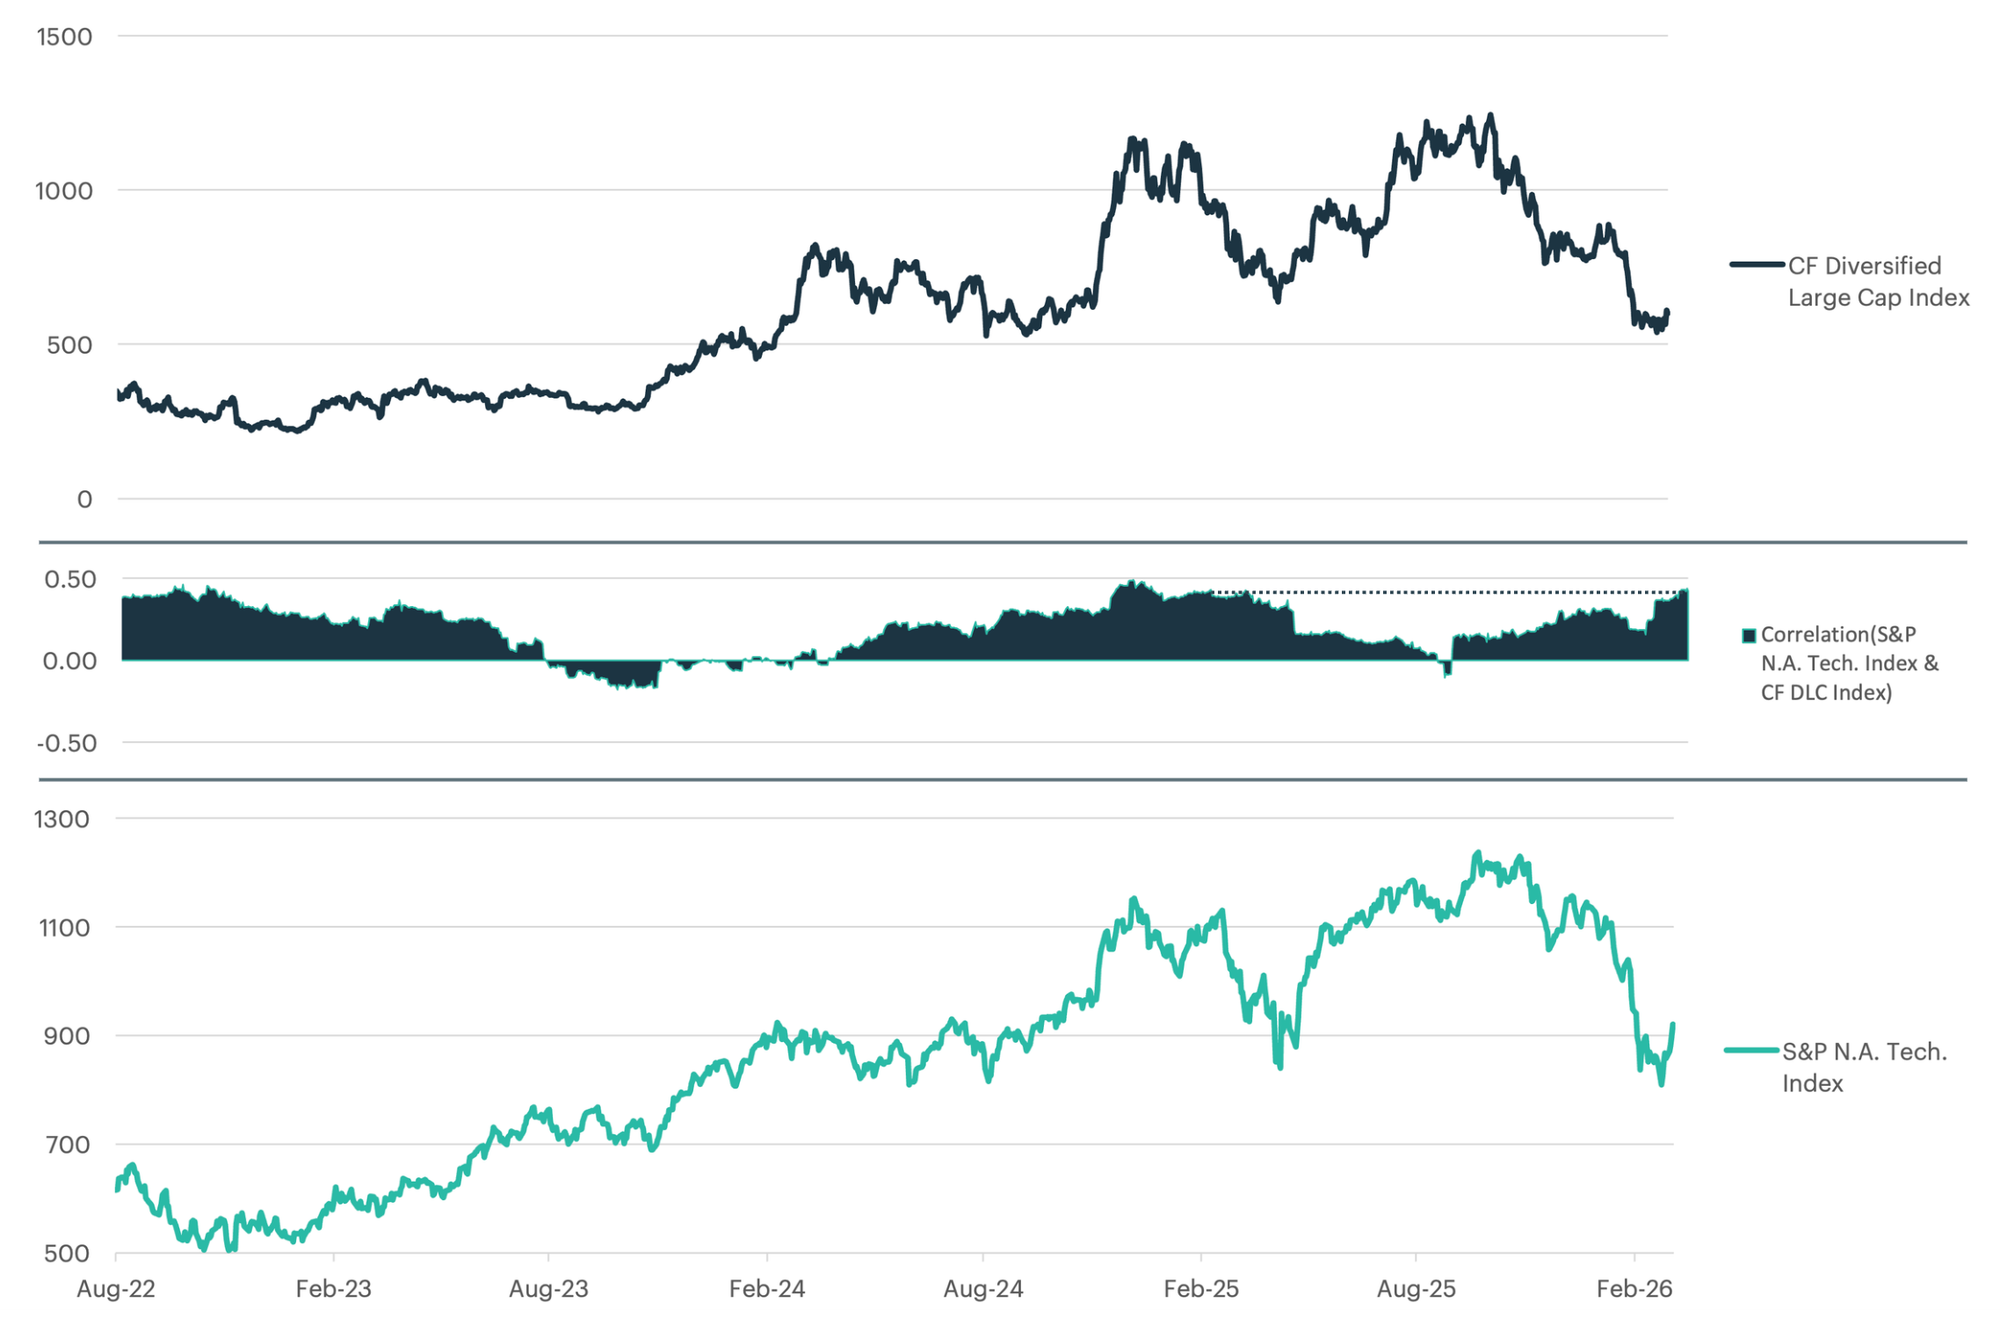
As Tech Rolls Over, Large-Cap Digital Assets Follow
The CF Diversified Large Cap Index and the S&P North America Technology Index have maintained a persistent positive correlation since 2022, reflecting the structural integration of large-cap digital assets into institutional risk frameworks alongside technology equities. Both indices shared the same upward trajectory through 2024 and into early 2025, as accommodative liquidity conditions and institutional adoption drove synchronized gains. The relationship has proven equally binding on the downside: as the S&P NA Technology Index retreated from its early 2025 highs, the CF Diversified Large Cap Index declined in tandem, with large-cap crypto showing pronounced downside skew and falling at a steeper rate as institutional portfolios deleveraged across both asset classes. This shared sensitivity reflects monetary policy expectations, leveraged positioning, and risk appetite rather than fundamental overlap, with both sectors treated as growth-oriented risk assets by institutional allocators. As disappointing Magnificent Seven earnings and rising rate expectations weighed on tech, the correlation served as a direct transmission channel into large-cap digital asset valuations, amplifying drawdowns beyond what macro fundamentals alone would imply.
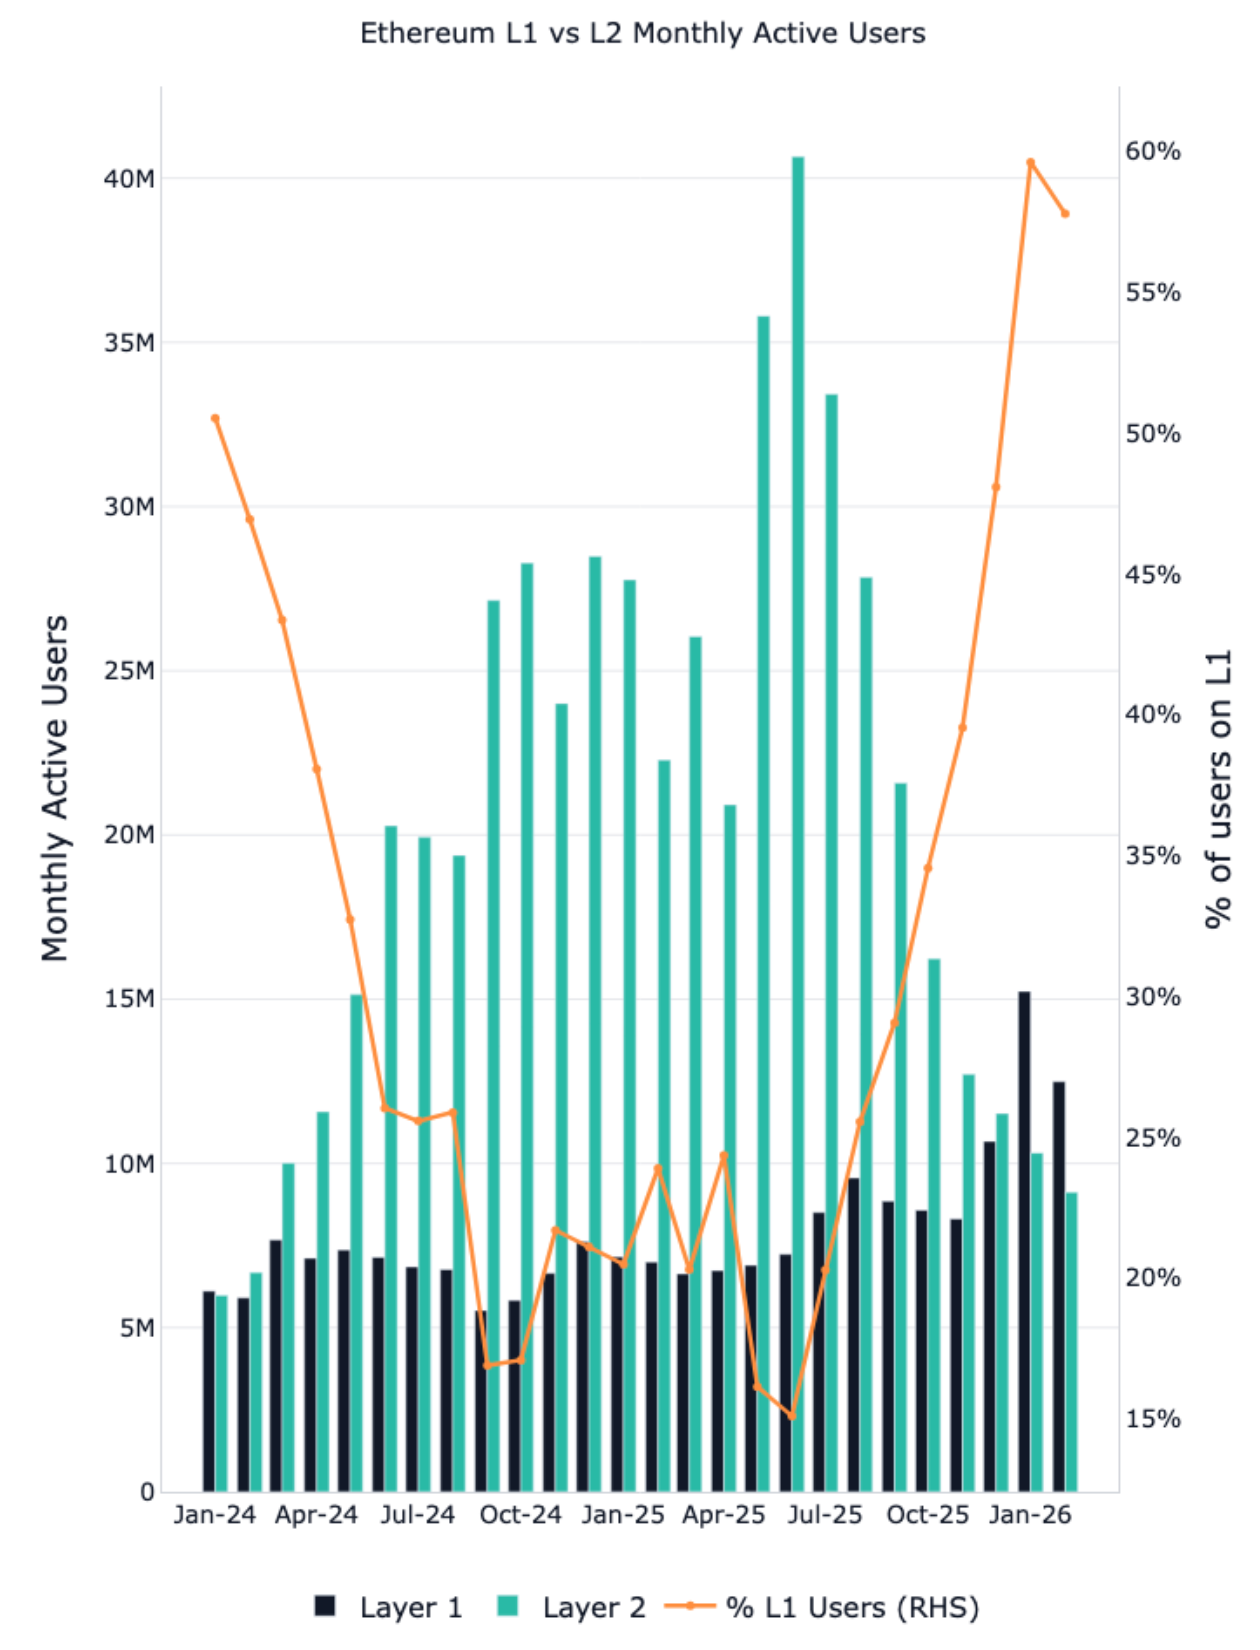
Ethereum's Layer 1 Upgrades Weigh on OP and ARB
The structural compression of Layer 2 token economics proved a significant headwind during the quarter. The Dencun upgrade in March 2024 introduced cheaper L1 storage via blobs, reducing data availability costs for L2 operators by approximately 90%, and the 2025 Pectra upgrade extended this trajectory further. As the spread between L2 user fees and L2 operating costs has narrowed, aggregate fee revenues have declined sharply, reducing the economic activity that governance tokens such as OP and ARB are designed to capture. Optimism declined 60.6%, the weakest performance among all CF Services Category Index constituents, while Arbitrum fell 51.6%. The severity of these drawdowns relative to the broader market reflects an ongoing reassessment of the fundamental value proposition of L2 governance tokens in a world where Ethereum's own L1 is increasingly capable of absorbing greater transaction volumes at lower cost.
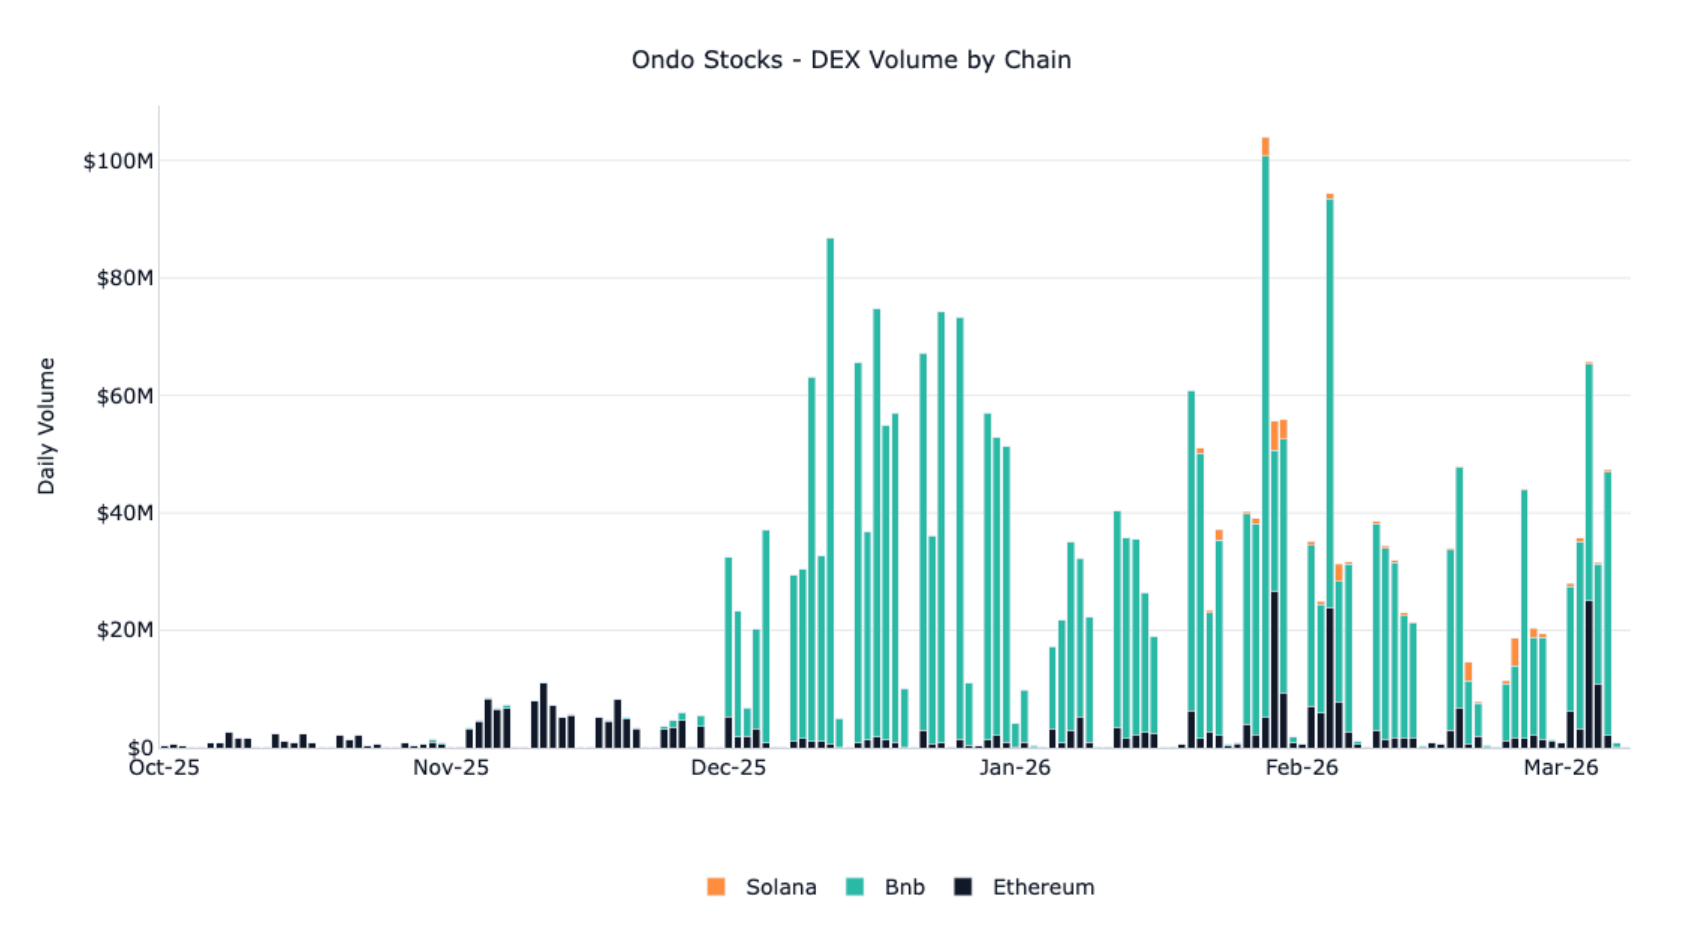
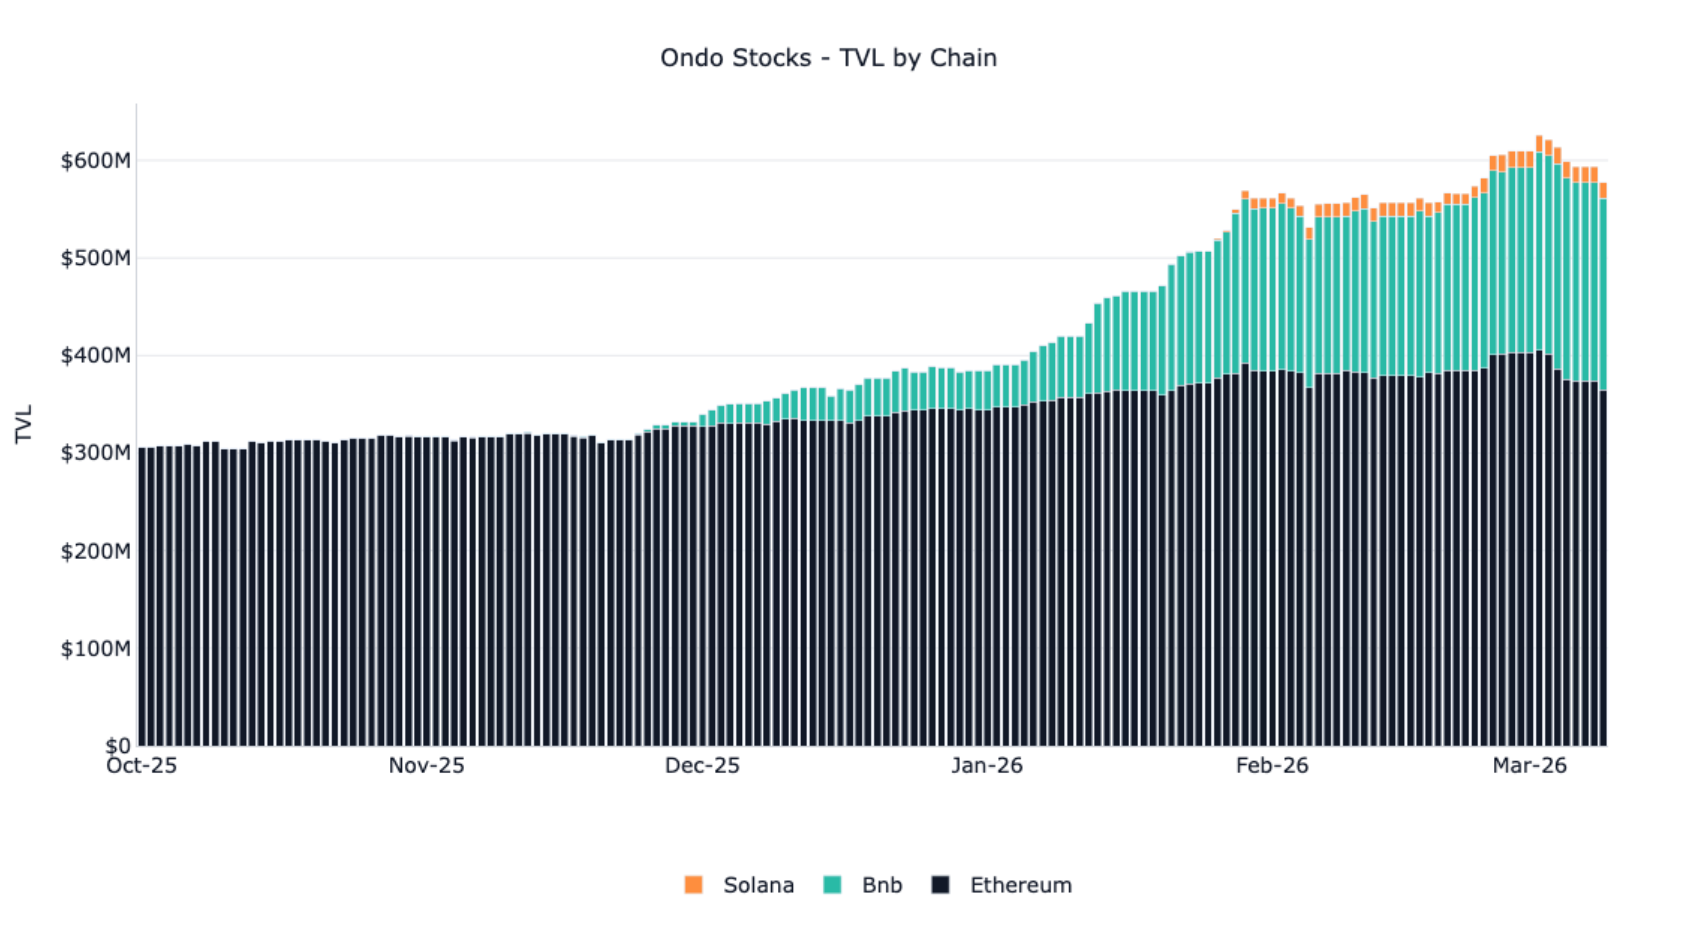
Onchain Fundamentals Diverge from ONDO Price
Ondo Finance's tokenized equity platform demonstrated a notable divergence between token price and product traction over the period. Despite ONDO declining 48.2%, total value locked in Ondo Stocks grew from roughly $300 million in October to approximately $600 million by early March, with BNB Chain driving the bulk of incremental growth. DEX volume followed a similar trajectory, climbing from negligible levels in October into the $40 to $75 million daily range through December and January, then spiking above $100 million on several days in February as Solana came online. Distribution milestones, including Binance's regulated MTF listing and MetaMask's integration of 200+ tokenized securities, have broadened the addressable user base meaningfully. This divergence suggests the market has yet to fully price the platform's emerging utility as tokenized equities move from proof of concept to scalable infrastructure.
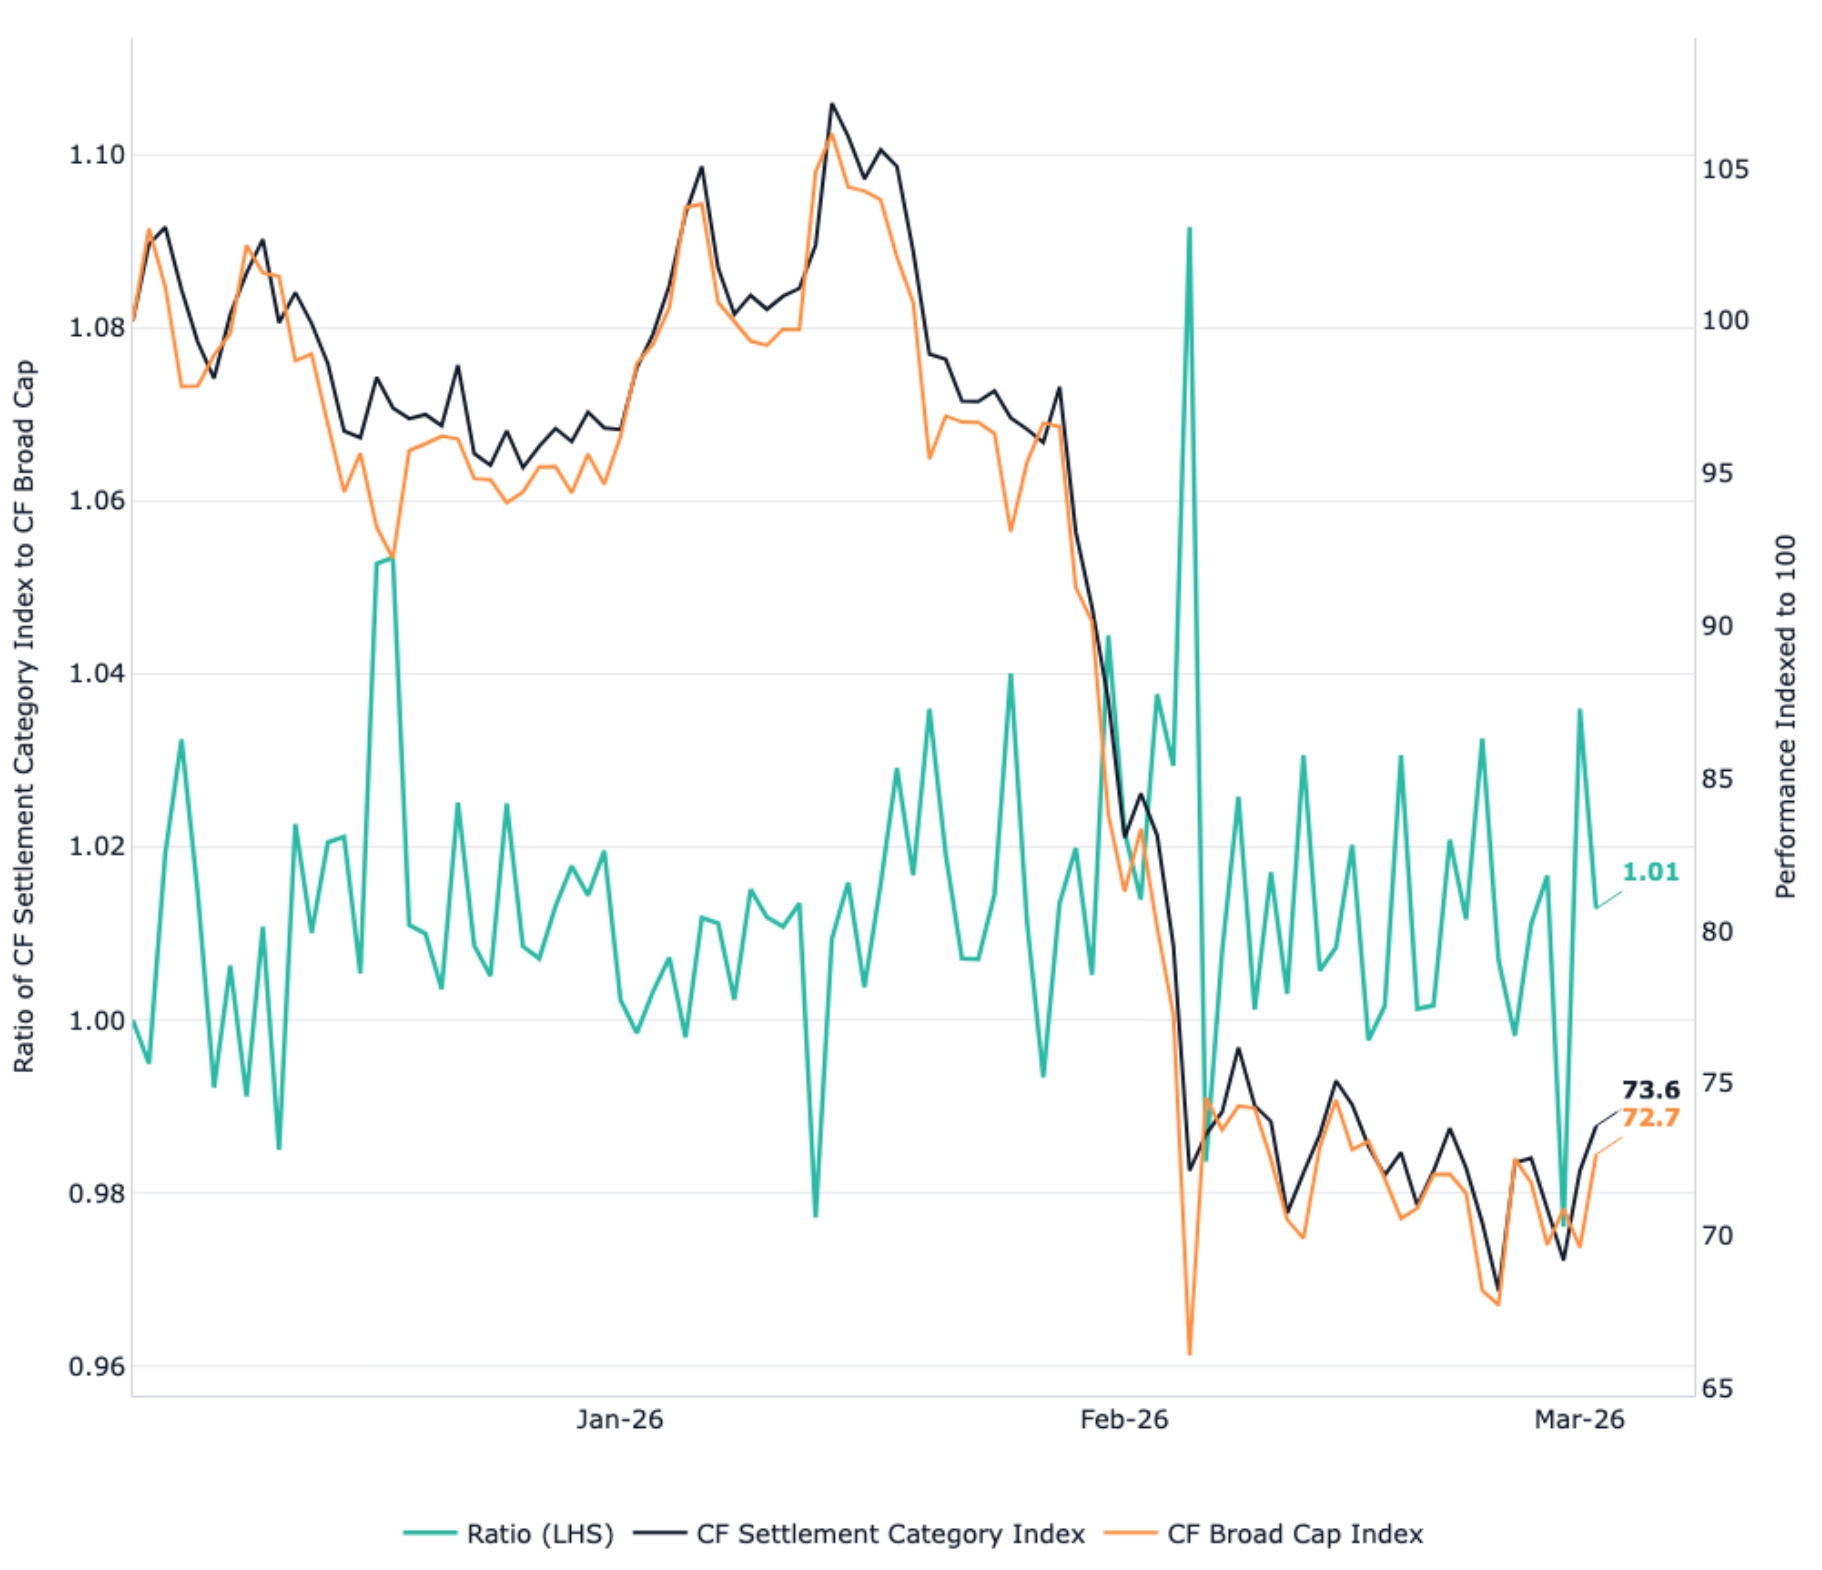
Settlement Category Shows Defensive Edge
The CF Settlement Category Index, anchored by Bitcoin at roughly 74% weight, consistently maintained a slight premium over the CF Broad Cap Index through the quarter's drawdown. Both indices peaked on January 14 before declining roughly 36% to their February 24 troughs, but the performance ratio between the two widened steadily as selling intensified, reaching 1.04 by January 31 during the steepest leg lower. That peak in relative outperformance coincided with the period of greatest stress, precisely when defensiveness is most valuable to allocators. As both indices stabilized through February, the ratio compressed back toward 1.01 by early March. By March 1, the Settlement Category had declined 26.4% versus 27.3% for the Broad Cap, reinforcing its role as a lower-beta expression of digital asset exposure during risk-off episodes.
To read the full report , please click on the respective links below:
Quarterly Attribution Report (PDF Version)
Lastly, our Quarterly Attribution Reports are designed to help investors understand the performance of digital assets through a purpose-centric lens called the CF Digital Asset Classification Structure (CF DACS). To learn more about CF DACS, please utilize our interactive CF DACS Token Explorer.
Contact Us
Have a question or would like to chat? If so, please drop us a line to:
The information contained within is for educational and informational purposes ONLY. It is not intended nor should it be considered an invitation or inducement to buy or sell any of the underlying instruments cited including but not limited to cryptoassets, financial instruments or any instruments that reference any index provided by CF Benchmarks Ltd. This communication is not intended to persuade or incite you to buy or sell security or securities noted within. Any commentary provided is the opinion of the author and should not be considered a personalised recommendation. Please contact your financial adviser or professional before making an investment decision.
Note: Some of the underlying instruments cited within this material may be restricted to certain customer categories in certain jurisdictions.
Changes to the Token Market Price Benchmarks Series - Market Prices – 21 July 2026
The Administrator has confirmed changes to the Token Market Price Family for the period 14 July 2026 to 21 July 2026.

CF Benchmarks
Softer CPI Reprices July Hike Risk & Lifts Digital Assets
Digital assets extended their recovery over the past week as cooler US inflation prints repriced Fed expectations; the bid was broad across the large cap indices, growth factor leadership returned, stablecoin funding repriced lower, and stress stayed isolated in names hit by token-specific news.
Mark Pilipczuk
Notice of the Demising of CF Dai-Dollar Settlement Price and Spot Rate
The Administrator announces that it will demise the CF Dai-Dollar Settlement Price (DAIUSD_RR) and CF Dai-Dollar Spot Rate (DAIUSD_RTI) which are members of the CF Digital Asset Index Family.
CF Benchmarks
By clicking Accept, you consent to CF Benchmarks's use of cookies.
Visit Cookie Settings to learn how CF Benchmarks uses cookies and to adjust your preferences.