
Mar 06, 2026
Factor Friday - March 6, 2026
Value Outperforms as the Market Stages a Rally
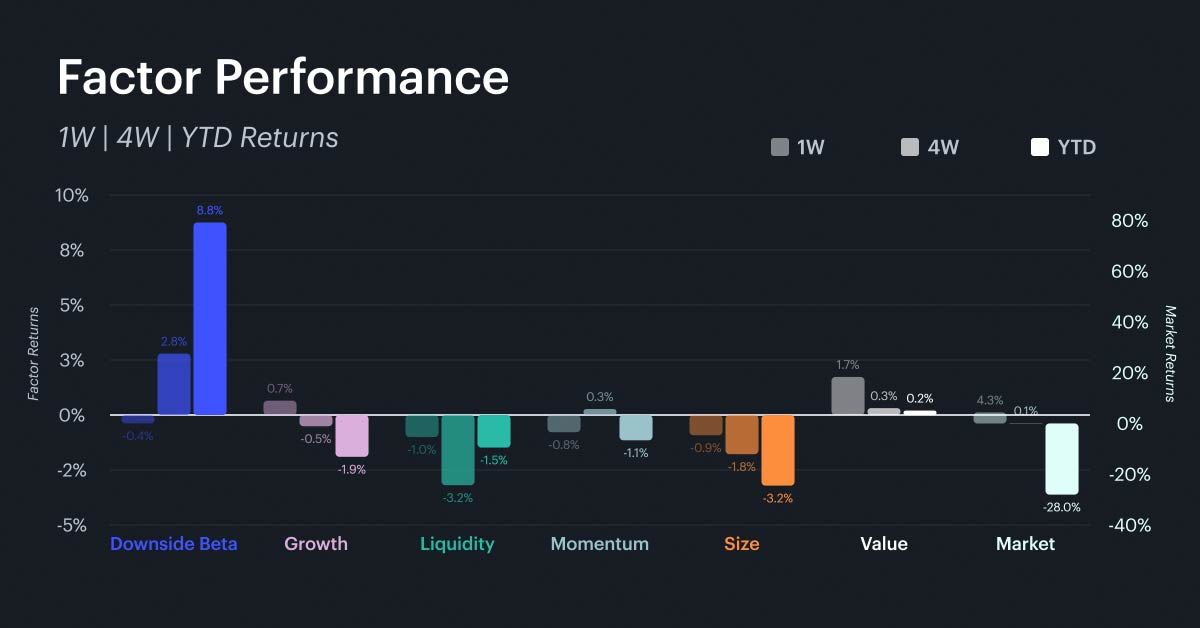
The market posted its strongest weekly gain of the year, rising 4.3%, bringing its year-to-date loss to 28.0%. For the first time since the drawdown began, value has emerged the top performer, gaining 1.7% on the week and turning marginally positive year to date at +0.2%. Downside beta, while still the dominant factor in 2026 at +8.8% year to date, posted its first negative weekly return of the year at -0.4%, suggesting that the relative outperformance that defensive tokens enjoyed is temporarily abating. Growth also showed signs of life, gaining 0.7% on the week, though it remains in negative territory at -1.9% year to date. Size and liquidity continued to lag, both down 3.2% on the year, and momentum faded to -1.1% year to date after briefly showing strength in the prior week. The question for investors is whether value's emergence and downside beta's first downturn represent the beginning of a factor rotation or simply a reversion trade within a still-bearish regime.
Rolling Factor Rankings and Rotation
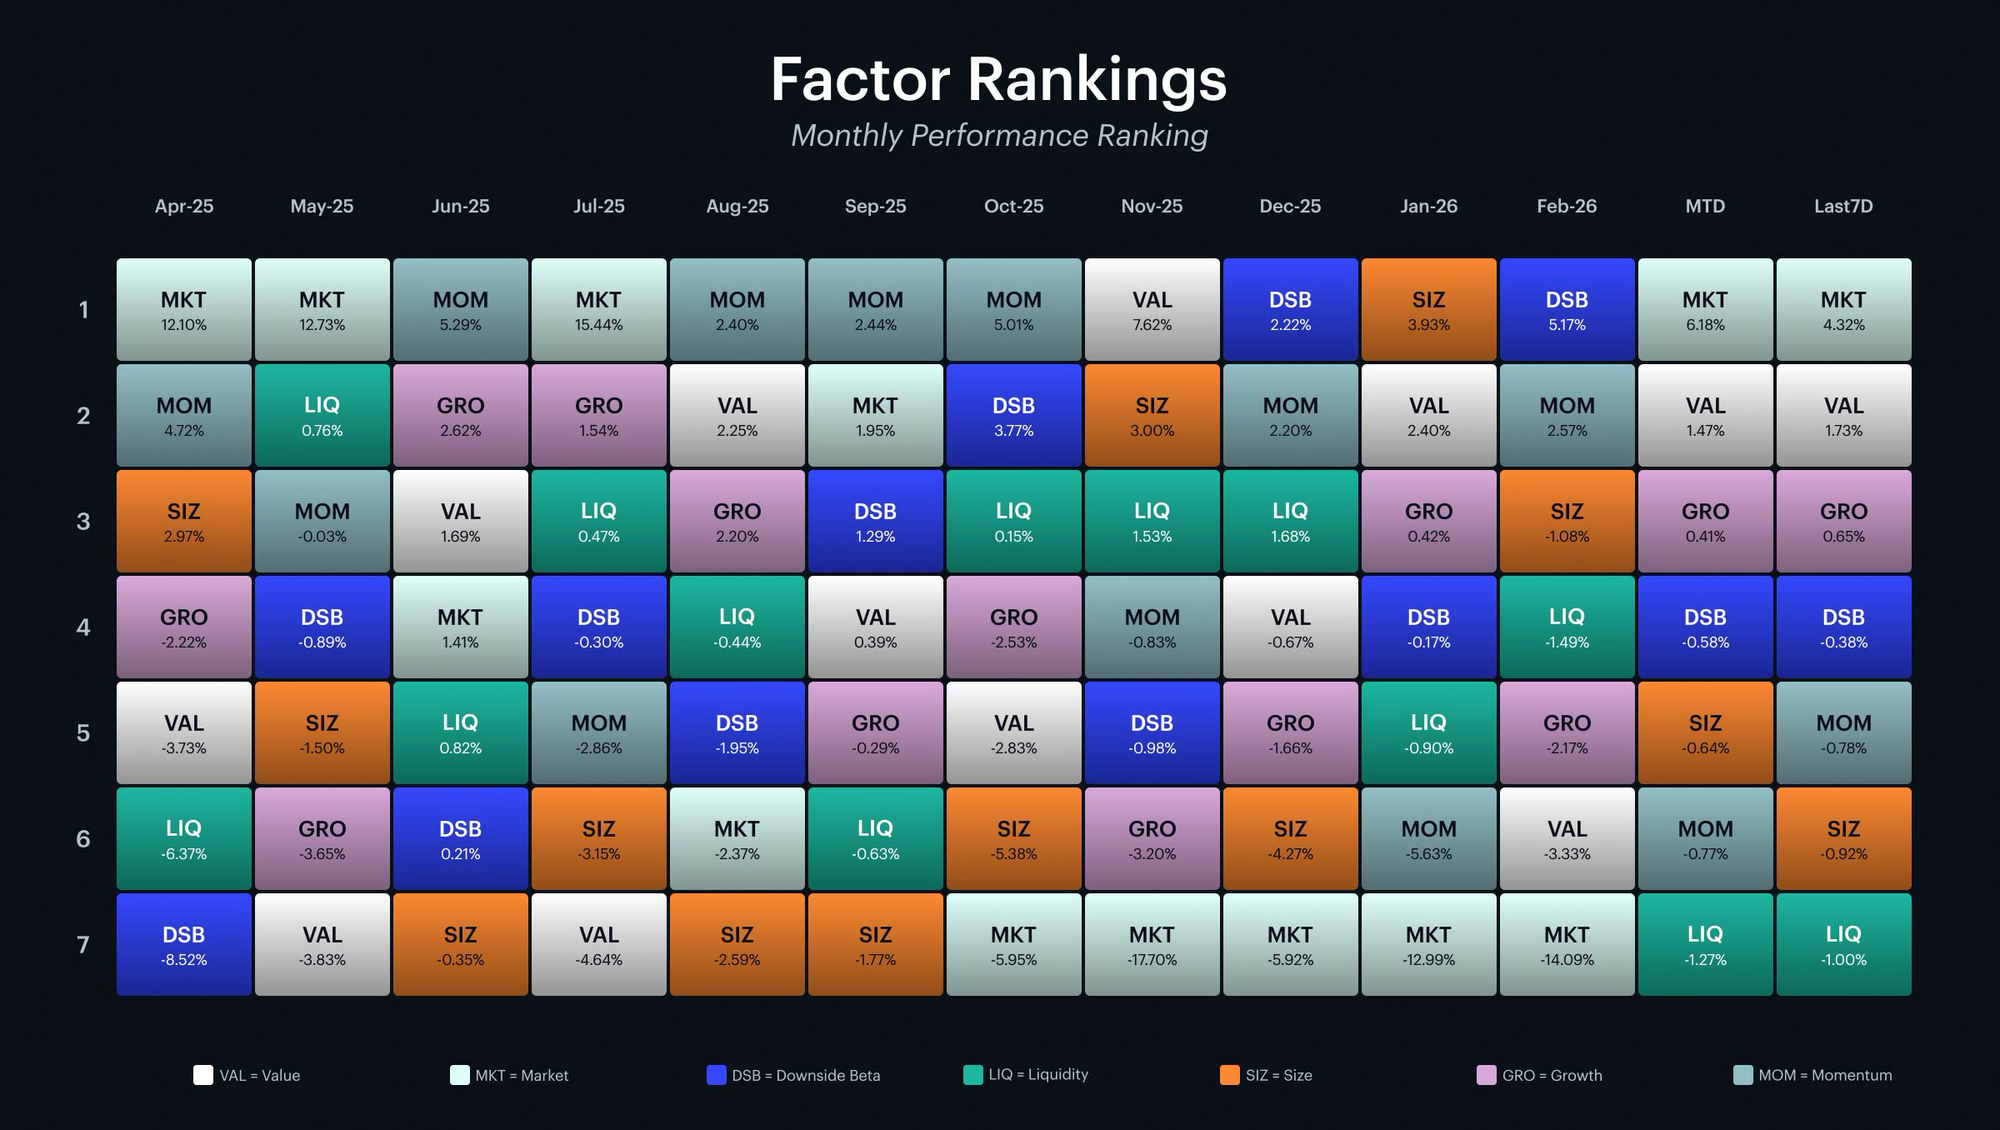
The long-term performance quilt shows that the factor landscape is beginning to shift at the margin. For the first time since the sell-off began in October, the market factor ranks first in both the beginning of March and over the last seven days, displacing downside beta from the top spot it had held since December. Value has climbed to second in both the month-to-date and weekly rankings, a notable move from its persistent position near the bottom through most of the drawdown. Notably, downside beta has slipped to fourth over the trailing week. This does not invalidate the broader defensive regime as downside beta still leads comfortably on a year-to-date basis, but the short-term rotation toward market and value is the clearest signal yet that risk appetite is beginning to return in pockets of the market. Investors should watch whether this shift sustains in the coming weeks; if value continues to lead, it could mark the first credible regime change since October.
Market and Key Factor Betas
Market Beta
The high-beta cohort continues to be dominated by meme coins, newer layer-1 and layer-2 platforms, and DeFi infrastructure tokens, all clustered between 1.5 and 1.6. These are the names that amplify both rallies and drawdowns most aggressively, and in a week where the market gained 4.3%, they were the primary beneficiaries. In terms of downside risk, however, these assets remain the most vulnerable to selling pressure. The low-beta end of the spectrum tells a more interesting story for positioning. It is anchored by governance tokens alongside established store-of-value and infrastructure names. The market beta of of BTC at 0.9 reinforces its structural role as the least volatile major asset in the market. For investors looking to stay allocated to digital assets through continued volatility, the low-beta group offers a way to maintain market exposure with dampened drawdown risk. In a market that remains down 28% year to date, prioritizing lower-beta allocations continues to be the more prudent approach until a sustained rotation towards risk is confirmed.


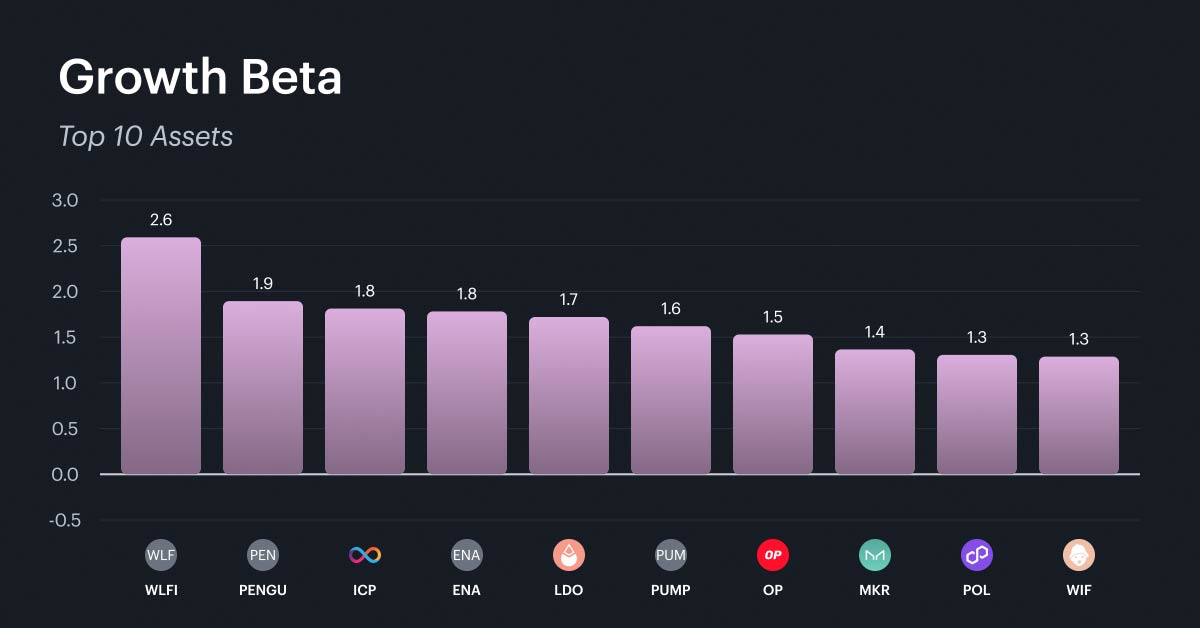
Growth
Growth posted its best weekly return in several weeks at +0.7%, and the top-10 growth beta rankings are dominated by layer-2s and DeFi-adjacent tokens experiencing real adoption. The highest growth betas generally belong to tokens with accelerating fee generation and user activity, many of which are in active expansion. Investors considering growth exposure should recognize that many of the highest-growth names also carry elevated market beta, meaning that the growth trade in this environment comes with significant directional risk attached. A more selective approach would be to focus on growth names that also appear in the lower half of the market beta rankings, as these offer a better risk-adjusted way to capture network expansion while mitigating drawdown risk.
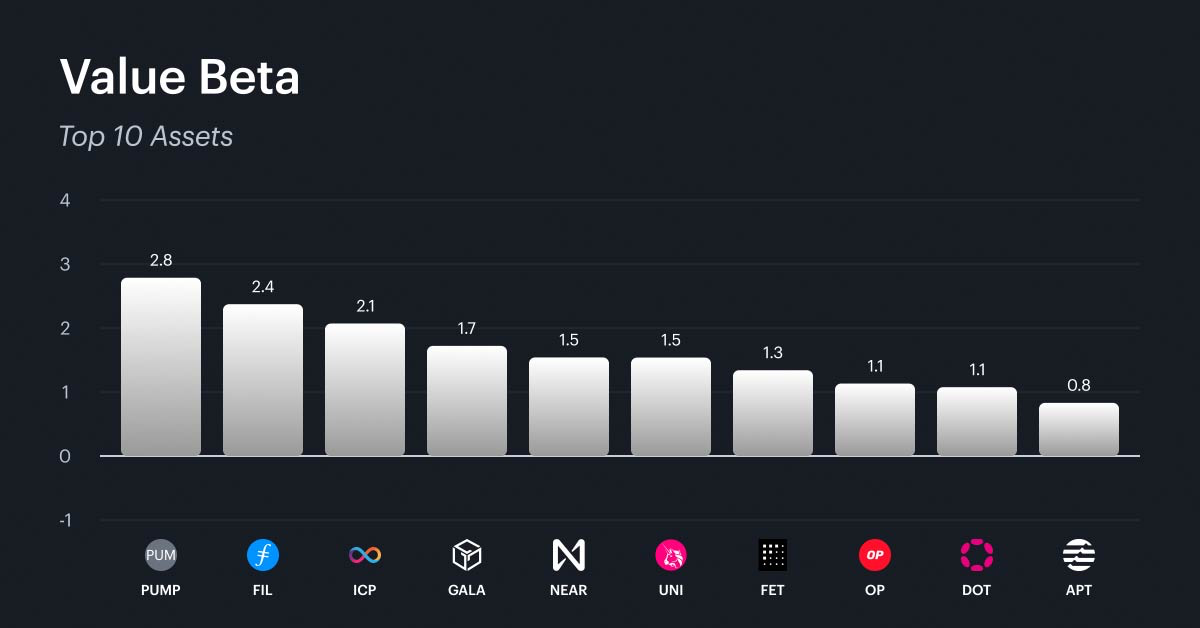
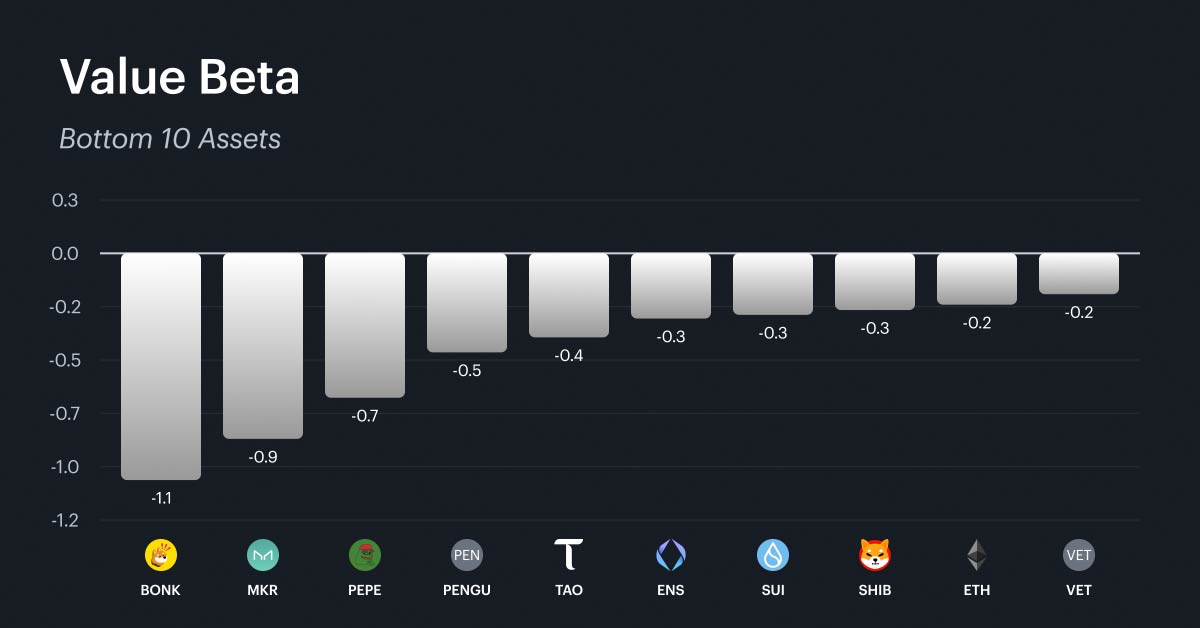
Value
Value's move to +0.2% year to date, from -3.7% just two weeks ago, is the most significant single-factor shift in recent months and deserves attention. The top of the value beta rankings is populated by mid-cap protocols generating high fee revenue relative to their capital base with matching user engagement metrics. These are tokens where on-chain fundamentals, rather than narrative or speculation, are driving price. Infrastructure platforms, decentralized exchanges, and data-layer protocols are all featured on this list. The bottom of the value rankings presents a near-mirror image: meme coins, governance tokens, and speculative names with minimal fee-generating activity dominate the lowest scores. Notably, ETH appears in the bottom half at -0.2, reflecting its lower fee yield on a market-cap-adjusted basis relative to smaller, higher-throughput networks. For investors, the widening spread between top and bottom value names is actionable. If this rotation continues, allocating toward protocols with strong fee generation, active user bases, and efficient capital utilization it creates the potential to position for a fundamental-driven recovery.
What Factors are Driving Markets
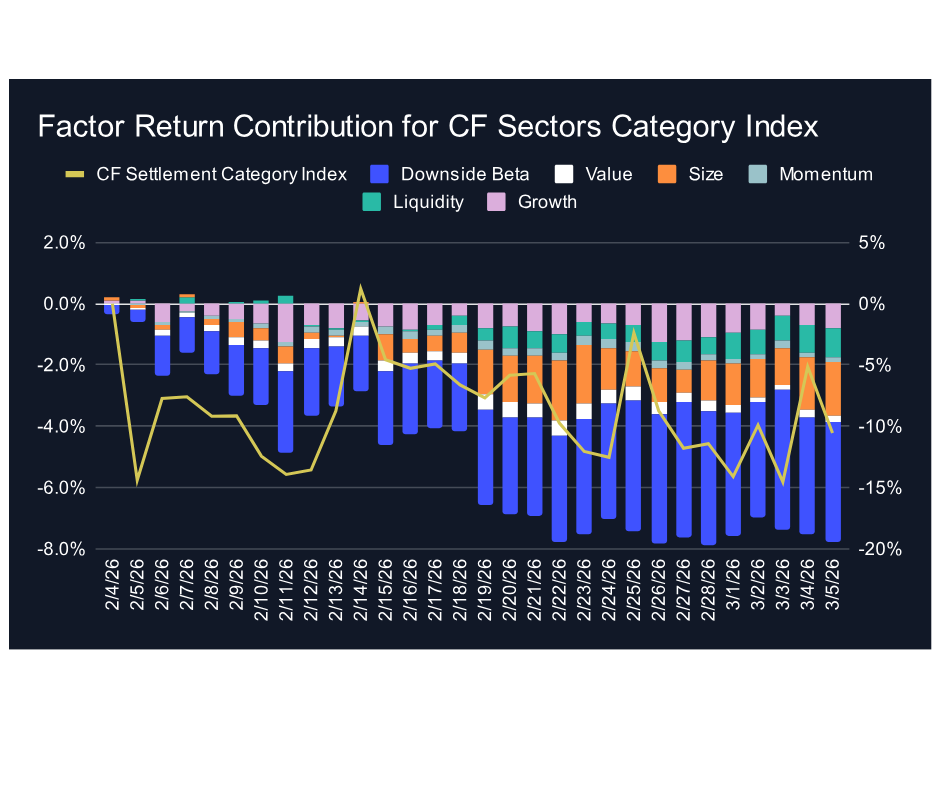
The Sectors index factor contribution chart reveals a striking dynamic: the cumulative negative contribution from individual factors exceeds the actual decline of the index itself. Downside beta and size have been the largest negative contributors, with growth also detracting persistently throughout February and into early March. The sum of factor headwinds has been more severe than the index's total return, implying that the contribution from the broader market has been positive. In practical terms, sector-oriented tokens have performed somewhat less poorly than their factor exposures alone would predict, though the overall picture remains negative. Investors should not interpret this cushion provided by the market as a sign of strength; it simply reflects how exceptionally broad the factor headwinds have been.
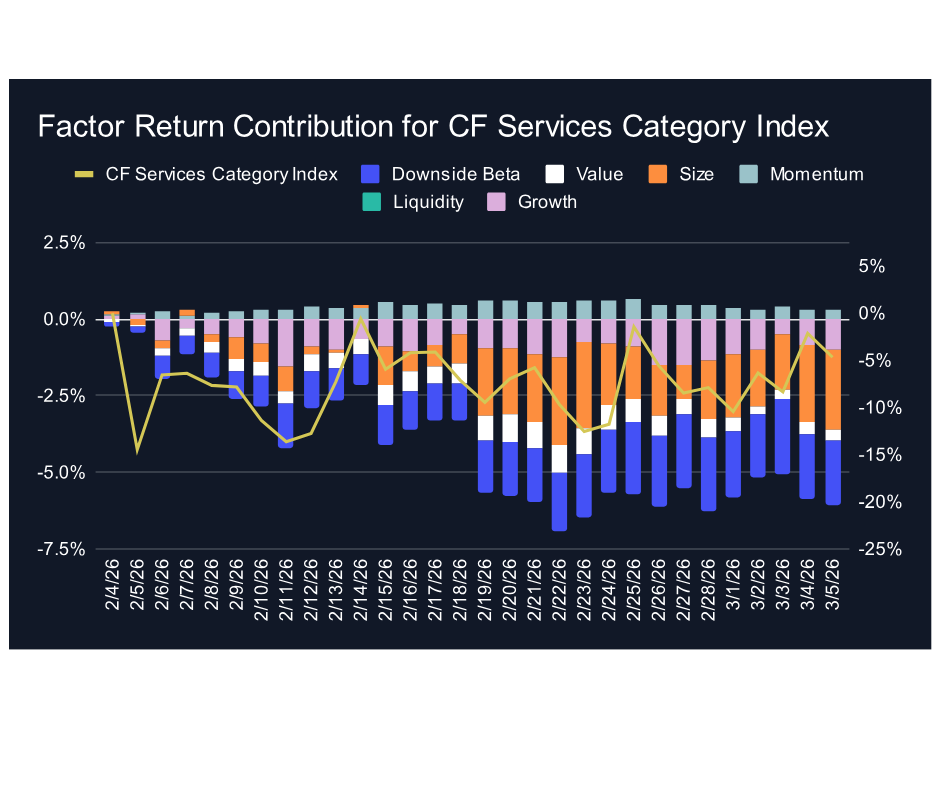
The Services index shows a similar pattern, with cumulative factor contributions summing to a more negative value than the index's own performance. Downside beta and size are again the primary detractors, with growth compounding the drag. The gap between the total factor contribution and the actual index decline is visible in the divergence between the stacked bars and the index performance line. The factor model is over-explaining the decline: every measured risk factor has been a headwind, and the fact that the index has not fallen as far as the factors would imply suggests some degree of idiosyncratic support in select names. Momentum has offered marginal positive contribution on certain days but has not been sufficient to offset the broader factor drag.
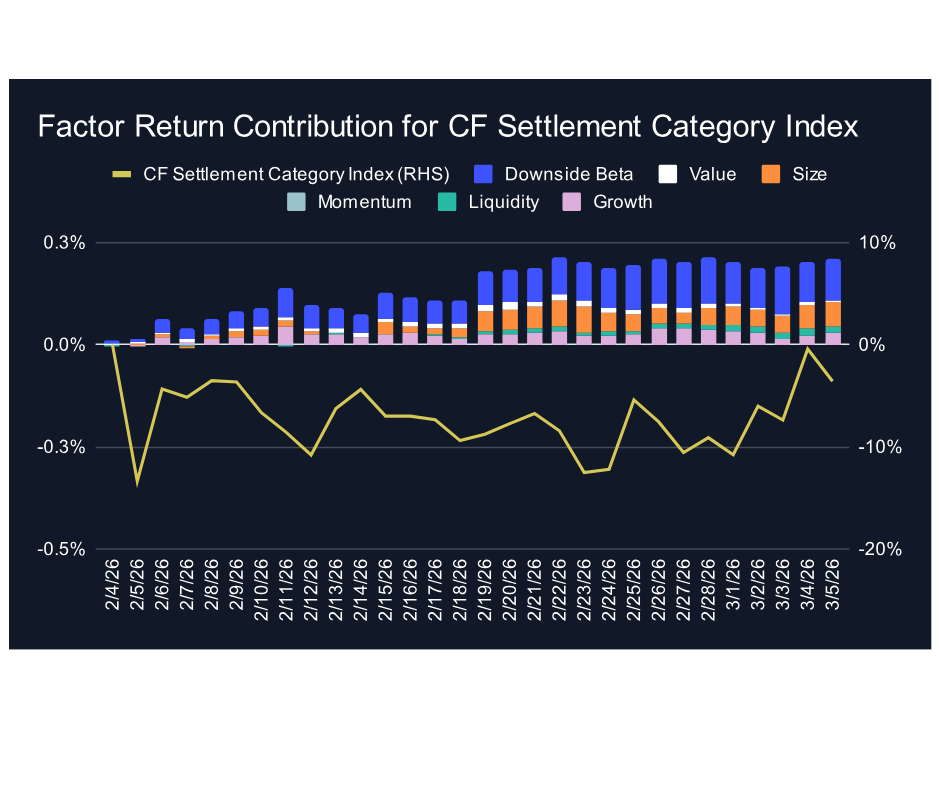
The Settlement index tells a fundamentally different story. Factor contributions have been consistently positive throughout the period, with downside beta as the leading contributor and size and growth also adding modestly. This stands in stark contrast to Sectors and Services, where the same factors have been headwinds. The explanation is compositional: Settlement is dominated by large-cap blue chips like Bitcoin and Ether, which carry outsized weight in the category index. The broad market factor, which reflects the full cap-weighted universe including significant small-cap altcoin exposure, contributes more negatively than all other factors combined in Sectors and Services. Within Settlement, the concentration in blue-chip names insulates the category from that small-cap drag, allowing the positive factor contributions to come through. The Settlement index line has turned upward in recent sessions, consistent with the broader market rally favoring large-cap names. For investors navigating continued volatility, the divergence across category indices reinforces the case for maintaining a Settlement-heavy allocation.
Appendix: CF Factor Methodology
Market Factor
The market factor captures the broad, systematic risk that permeates the digital asset ecosystem. It reflects aggregate influences such as macroeconomic conditions, investor sentiment, and overall market volatility. As such, this factor is defined by the daily returns of the CF Broad Cap (Free Float Market Cap Weight) Index, offering a comprehensive and capitalization-weighted representation of the asset class.
Size Factor
The size factor captures the return differential associated with asset scale, reflecting the hypothesis that smaller-cap digital assets tend to outperform their larger-cap counterparts. This effect is understood to compensate for elevated operational and financial risks while exploiting potential market inefficiencies. In this framework, the size factor is defined by each asset’s fully diluted market capitalization. The value is sign-inverted so that higher z-scores are assigned to smaller assets and vice-versa.
Value Factor
The value factor reflects a protocol’s ability to generate economic output relative to its capital base and market valuation, combining measures of both efficiency and user engagement. It is constructed as the average z-score of two key ratios: transaction fees relative to total value locked (Fees/TVL) and daily active users relative to market capitalization (DAU/MCap). This composite metric captures how productively a protocol utilizes its resources while also serving as a proxy for user-driven demand. A higher combined score indicates efficient resource utilization and strong user engagement.
Momentum Factor
The momentum factor captures short-term price persistence by identifying assets that have recently exhibited strong performance. It is computed as the average z-score of two metrics: the 2 weeks cumulative performance and the 2 weeks risk-adjusted cumulative performance. This approach aligns with established findings in traditional financial literature and demonstrates empirical relevance in digital assets, where price trends tend to exhibit momentum over short horizons.
Growth Factor
The growth factor captures the expansion of a protocol’s network activity and user adoption. In the context of digital assets, it reflects metrics such as fee generation and user engagement, which serve as indicators of increased platform utilization and operational scale. The factor is defined as the average z-score of 30-day fee growth and 30-day weekly active user growth, thereby identifying assets exhibiting consistent and measurable increases in underlying network usage.
Downside Beta
The downside beta factor captures an asset’s sensitivity to adverse market conditions by isolating its behavior during periods of negative market returns. Empirical evidence shows that assets with lower downside beta tend to outperform their higher-beta counterparts over the long-term, due to their reduced participation in market drawdowns and more stable return profiles during periods of elevated volatility. As such, it is estimated through a regression of the asset’s daily returns over the most recent four-week period against market returns observed exclusively during negative sessions. The resulting value is sign-inverted to ensure that assets with lower downside exposure are assigned higher z-scores.
Liquidity Factor
The liquidity factor captures the ease with which a digital asset can be traded without significantly impacting its price. Empirical evidence shows that illiquid assets tend to command a higher risk premium than their more liquid counterparts, serving as compensation for trading friction and price volatility. To quantify this, the factor is measured using token turnover, defined as trading volume as a percentage of circulating supply. The value is sign-inverted such that higher z-scores are assigned to less liquid assets.
For further detail, view the CF Factors Methodology Document, the CF Factor Data Suite, and Our paper “A Factor Model for Digital Assets” in Springer Nature’s Mathematical Research for Blockchain Economy
The information contained within is for educational and informational purposes ONLY. It is not intended nor should it be considered an invitation or inducement to buy or sell any of the underlying instruments cited including but not limited to cryptoassets, financial instruments or any instruments that reference any index provided by CF Benchmarks Ltd. This communication is not intended to persuade or incite you to buy or sell security or securities noted within. Any commentary provided is the opinion of the author and should not be considered a personalised recommendation. Please contact your financial adviser or professional before making an investment decision.
Note: Some of the underlying instruments cited within this material may be restricted to certain customer categories in certain jurisdictions.
Factor Friday - July 3, 2026
The broad market rebounded 5.22% this week after the prior week's selloff, but style factors mostly sat out the bounce. Value was the only factor in positive territory at 1.42%, extending its four-week gain to 3.67% while the Market remains down 2.24% over that span.

Mark Pilipczuk
Hawkish Fed & Geopolitical Fragility Broaden Drawdown
A hawkish Fed, a 4.2% CPI print, and fragile Iran diplomacy drove a broad, steep drawdown across digital assets in June. Every CF Benchmarks index fell, fund outflows hit a 2026 high near $4.1 billion, and investors stayed defensive as rate-cut hopes faded and the war premium lingered.
Mark Pilipczuk
Changes to the Token Market Price Benchmarks Series - Market Prices – 30 June 2026
Changes to the Token Market Price Benchmarks Series - Market Prices – 30 June 2026.
CF Benchmarks
By clicking Accept, you consent to CF Benchmarks's use of cookies.
Visit Cookie Settings to learn how CF Benchmarks uses cookies and to adjust your preferences.