
Mar 09, 2026
Weekly Index Highlights, March 9, 2026
Market Performance Update
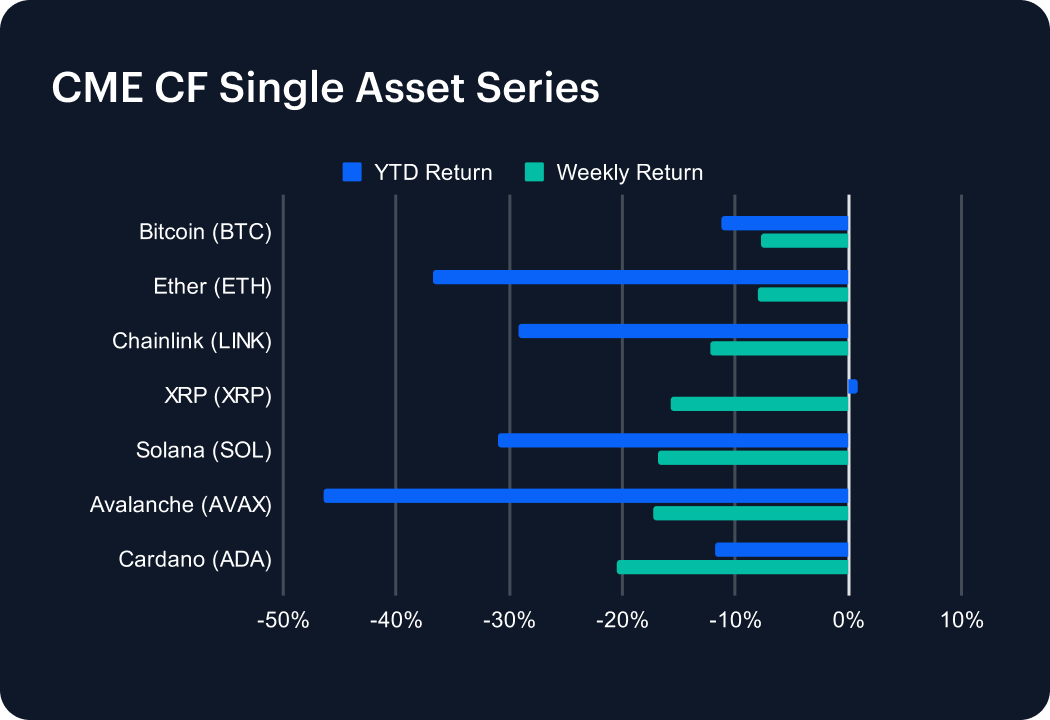
Bitcoin captured the tone of market tension in reaction to continuing geopolitical turmoil by closing the most recent week down 2.1%, leaving it down 23.5% for the year to date (YTD), while Ether lost 4.5% week-on-week (w/w) for a 34.9% YTD decline. Likewise, XRP lost a moderate -3.8%, but the pressure clearly increased further down the market cap stack: Avalanche (AVAX) fell 4.7%, Chainlink (LINK) 5.5% and Solana 6.5%. Cardano (ADA) was the clear laggard at -12.0% on the week, leaving its weekly drawdown 9.9 percentage points wider than Bitcoin’s. The group therefore ran from -2.1% to -12.0% w/w, with the three best outcomes all sitting in Bitcoin, XRP and Ether, while the two weakest sat in Solana and Cardano. That 9.9 percentage point spread points to a defensive pecking order inside a negative tape. Lower-beta, more liquid exposure lost 2.1% to 4.5%, while higher-beta layer-1 and alt exposure lost 4.7% to 12.0%. YTD readings tell the same story: Ether at -34.9% and Solana at -34.1% remain deeper in drawdown than Bitcoin at -23.5%.
Volatility Analysis
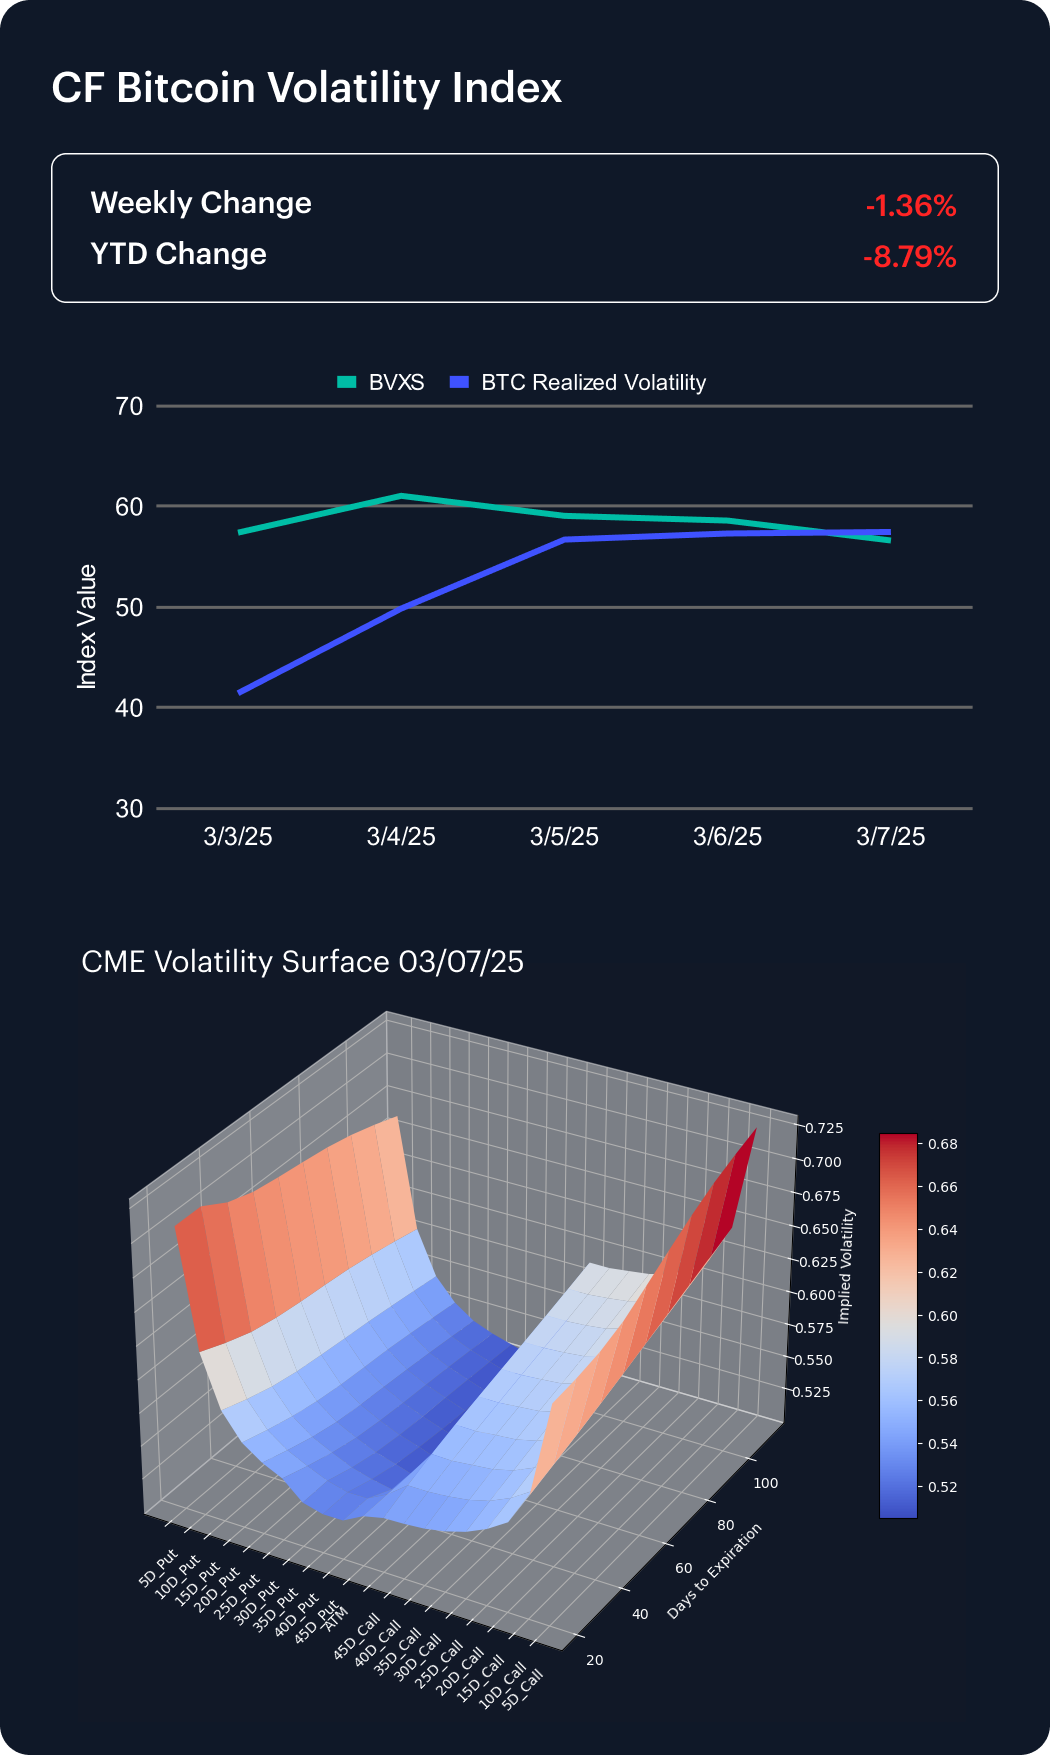
Bitcoin volatility moved higher through the business week, with our CME CF Bitcoin Volatility Index - Settlement (BVXS) benchmark up 1.70 vol. points for the intraweek stretch and realized volatility up 5.80 vol. points. By the Friday close, realized volatility was 5.69 vol. points above BVXS, compared with a gap of 1.03 vol. points a week earlier, on February 27th, when BVXS stood at 53.55, and realized volatility at 54.58. The spread therefore widened by 4.66 vol. points further into negative territory over the week. So, the options market did reprice higher by 1.70 points, but spot outcomes moved 5.80 points, which left options trailing realized conditions. When implied volatility rises 1.70 points and realized volatility rises 5.80 points in the same window, the cleanest read is that spot conditions became more unstable faster than options prices adjusted, potentially indicating more of a wait-and-see stance among risk traders than in the broader Bitcoin market.
Market Cap Index Performance
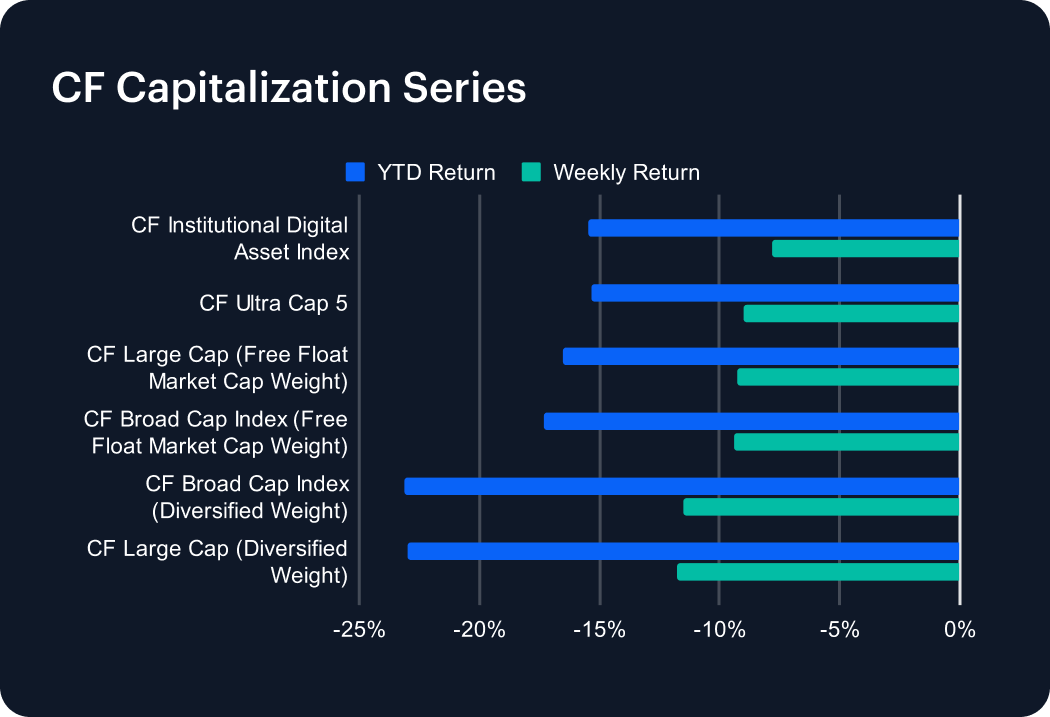
Market-cap benchmarks also remained under pressure, but the drawdown turned out to be fairly tight across the complex at 2.7% to 4.0%. CF Ultra Cap 5 fell 2.7% w/w, and the CF Institutional Digital Asset Index fell 2.8%, while CF Large Cap and CF Broad Cap in free-float form lost 2.8% and 2.9%. Diversified-weight versions were weaker at 3.8% and 4.0% for Large Cap and Broad Cap. The full weekly range across the six capitalization indices therefore ran from -2.7% to -4.0%, a band of 1.28 percentage points. Ultra Cap 5 outperformed Broad Cap (Diversified Weight) by 1.28 percentage points, and it outperformed Large Cap (Diversified Weight) by 1.09 percentage points. A 1.28 percentage point gap is large enough to show where the pressure sat. The best relative outcomes clustered in the 2.7% to 2.9% losses of the concentrated large-cap exposures, while the weakest outcomes sat in the 3.8% to 4.0% losses of the broader diversified baskets. Even with all 6 capitalization lines negative, it’s still clear breadth has continued to be a relative drag on performance.
Factor Analysis
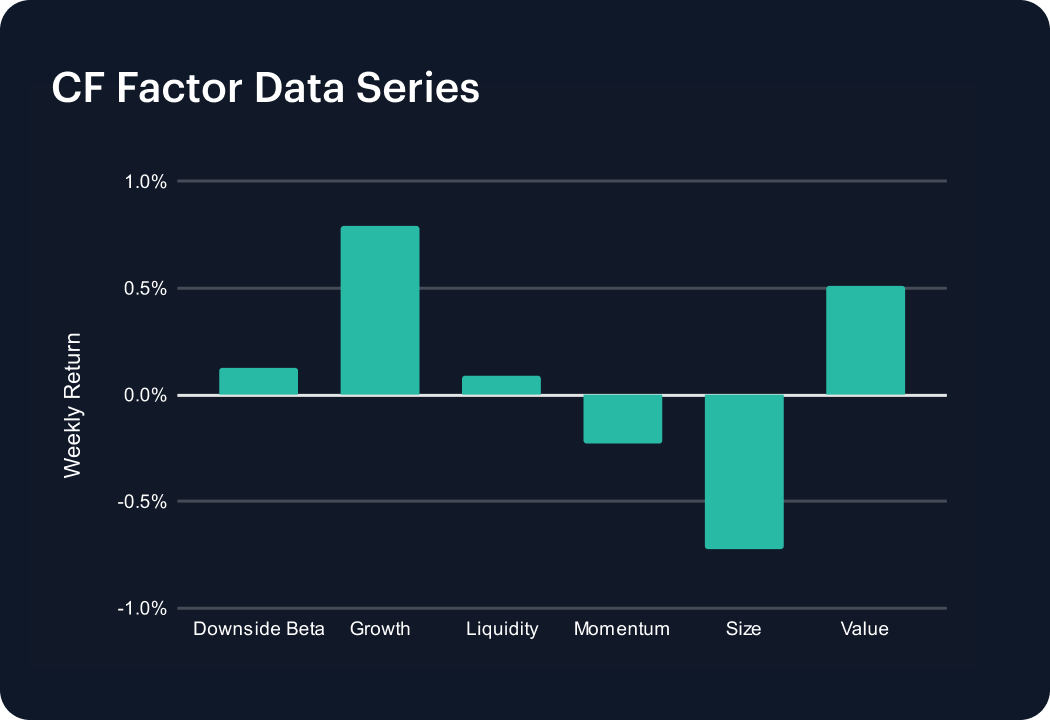
Factor returns shifted again over the latest week, with Liquidity improving by 0.98 percentage points and Size falling by 1.53 percentage points. Downside Beta eased from 0.66%, in the week ending March 1st, to 0.12% in the week ending March 8th, a fall of 0.54 percentage points. Growth improved from 0.43% to 0.79%, while Liquidity moved from -0.88% to 0.09% and Momentum improved from -1.26% to -0.23%. Size went the other way, swinging from 0.81% to -0.72%, a decline of 1.53 percentage points. Value stayed positive at 0.51%, but that was down from 2.34% a week earlier, a slowdown of 1.84 percentage points. The current week’s factor set therefore ran from -0.72% in Size to 0.79% in Growth. Liquidity turning from -0.88% to 0.09% and Momentum improving from -1.26% to -0.23% suggests ‘cleaner’ trading conditions, in terms of sentiment, while Size flipping from 0.81% to -0.72% shows that investors were still unwilling to extend risk further down the capitalization curve.
Classification Series Analysis
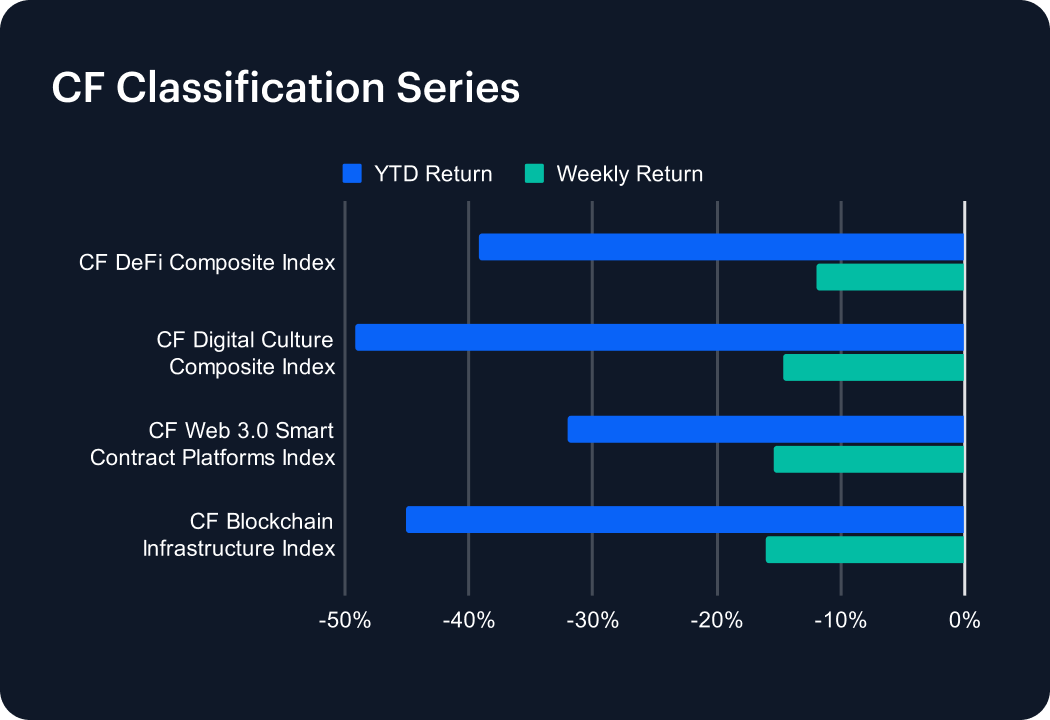
The classification baskets all finished lower, with weekly returns clustered from -6.1% to -8.1%. The CF DeFi Composite Index fell 6.1% w/w while the CF Web 3.0 Smart Contract Platforms Index lost 7.3% w/w, and the CF Digital Culture Composite Index fell 8.1%. On that basis, DeFi outperformed Digital Culture by 1.94 percentage points and outperformed Web 3.0 platforms by 1.20 percentage points. Even so, the whole thematic block remained negative, leaving the YTD picture deeper in the red, with -26.2% for DeFi, -31.0% for Web 3.0 and -29.8% for Digital Culture. While DeFi had the best weekly print at -6.1%, there was no positive theme in absolute terms because all 3 baskets finished below 0%. All told, it looks like investors trimmed risk across all three sleeves, and the pressure was heaviest in the higher-beta culture basket, where the weekly loss reached 8.1%.
Sector Analysis
Performance across the CF Digital Asset Classification Structure (CF DACS) taxonomy showed a clear split, with the best major group at -3.45% and the weakest at -8.70%. The Non-Programmable Sub-Category led the main tiers with an average return of -3.45% w/w, supported by Bitcoin at -2.07% and Bitcoin Cash at -0.35%. Infrastructure followed at -6.43%, while Finance printed -6.69%, spanning from BAL at +15.38% to KNC at -16.79%. Culture was the weakest major Sub-Category averaging -8.70%. Inside that sleeve, CHZ rose 3.10%, but the positive print was overwhelmed by WIF at -14.17%, AXS at -14.07% and APE at -13.89%. The spread between the best and worst major Sub-Category averages therefore came to 5.25 percentage points, from -3.45% in Non-Programmable to -8.70% in Culture. That 5.25 percentage point spread directionally echoes the single-asset tape, where Bitcoin fell 2.1% and Cardano fell 12.0%. Through the DACS lens, tokens closest to store-of-value and payment use cases printed an average loss of -3.45%, while culture and meme-linked names lost 8.70% on average; and as much as 14.17% (WIF). The positive outlier in Culture, CHZ, at +3.10%, for CHZ, and in Finance, BAL, with +15.38%, did not change the sector-level order because the median move stayed negative in every group.
CF Staking Series
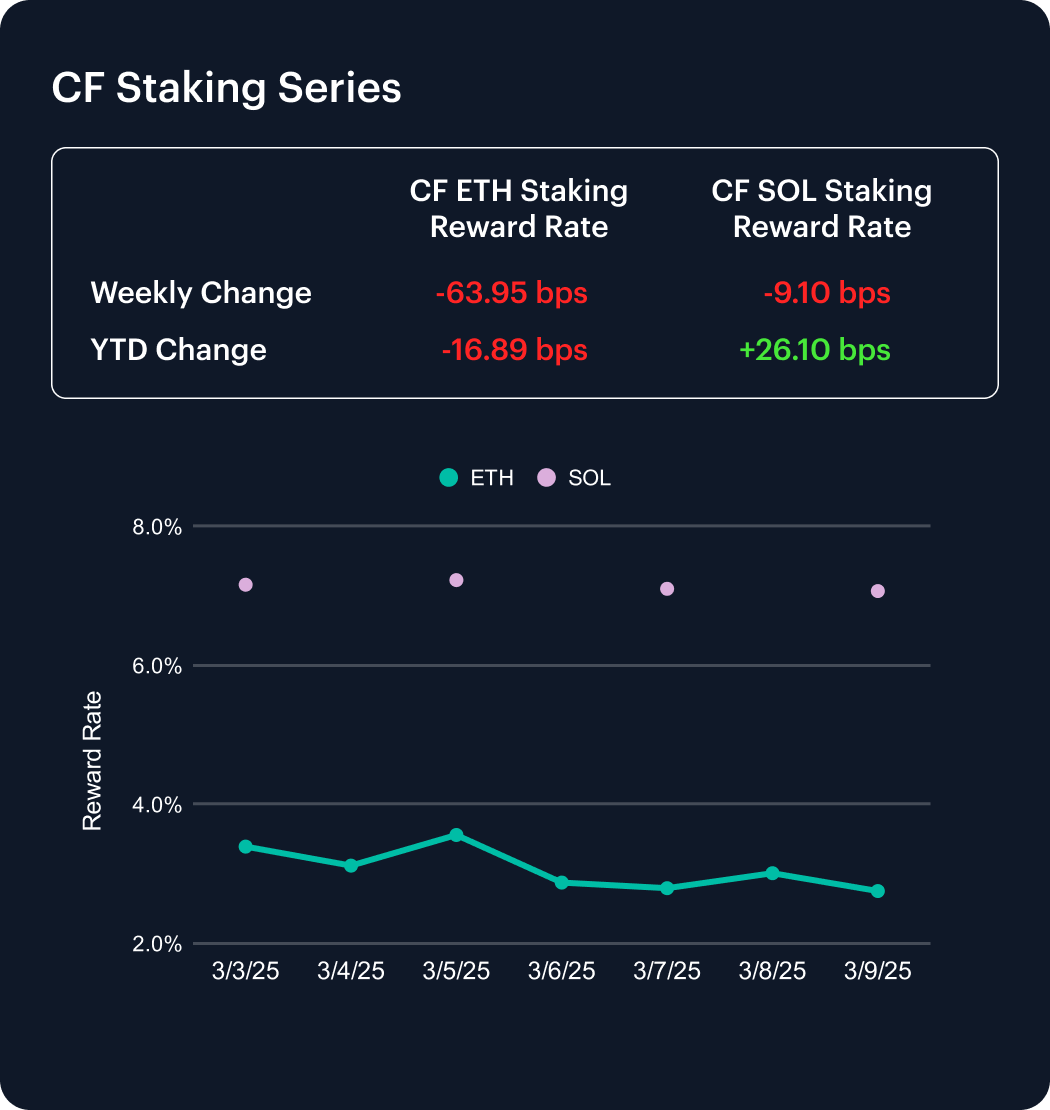
The staking complex was mixed on price, with weekly returns running from -5.7% in ETH Staking, to 1.5% for SOL Staking. Among the week’s de minimis prints, APT Staking returned -0.2% w/w, with its reward rate moving from Monday, March 2nd, to Sunday, March 8th, from 4.9997% to 4.9915%, a downtick of -0.82 bps. AVAX Staking returned -0.1% w/w, equating to its reward rate moving down -0.37 bps. ETH Staking returned -5.7% w/w as its reward rate fell -15.24 bps. NEAR Staking’s return was more stable in comparison, -1.0% w/w, down -4.56 bps. And SOL Staking posted a just-positive return of +1.5% w/w, a gain of 8.50 bps. Across the five series then, intra-week reward-rate changes ran from -15.24 bps to +8.50 bps. ETH was the clear outlier with a 5.7% weekly decline, while the other 4 names stayed inside a reward-rate band of -4.56 bps to +8.50 bps.
Interest Rate Analysis
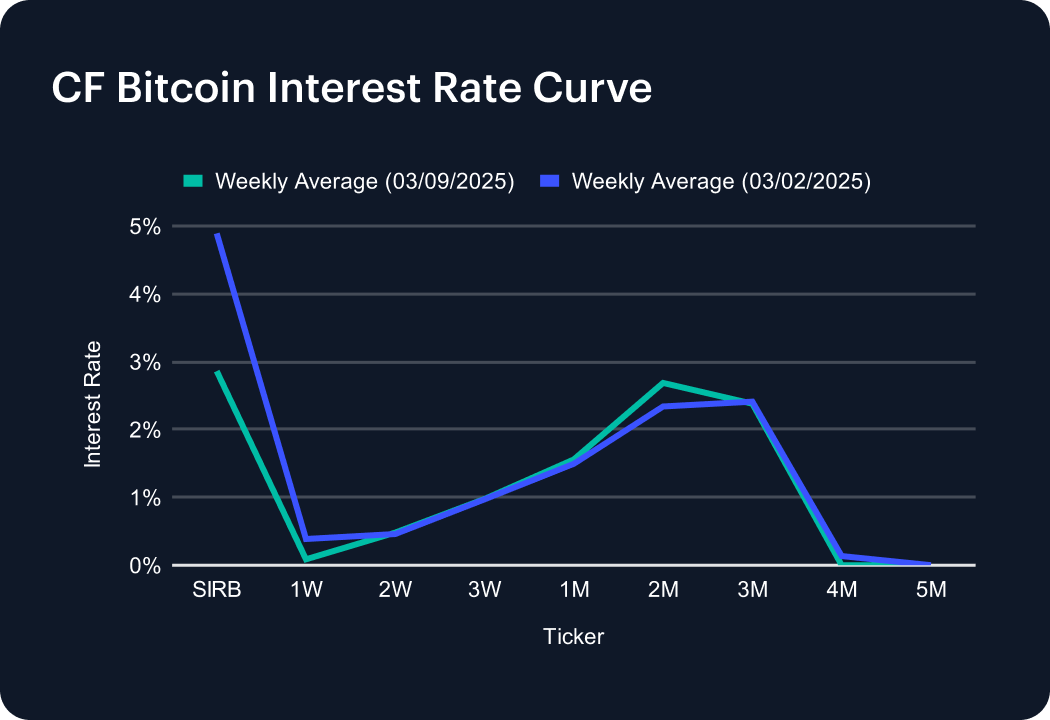
Funding curves moved higher over the week, with the sharpest change concentrated in the front of the Bitcoin curve at 109.5 bps for 1-week BTC. The Session Interest Rate for Bitcoin (SIRB) rose from 4.50% to 4.79%, a move of 29.2 bps. Its 1W tenor jumped from 0.30% to 1.40%, up 109.5 bps, while BTC 3M moved from 0.89% to 0.73%, down 16.2 bps. Those 2 tenors left what amounts to a front-end ‘shock’ for the week and a softer back end in the same curve. Meanwhile, USDT shifted higher in a steadier way, with its SIRB rising from 2.19% to 2.65%. Its 1W-to-3M sector moved from 2.20% and 2.21% to 2.66% and 2.67%, which works out to gains of 45.9 bps and 46.3 bps. So, across both curves, tenor-by-tenor changes ran from -16.2 bps to +109.5 bps. The result was a sharper near-term funding premium in BTC, and a broader upward reset in USDT, with BTC spanning -16.2 bps to +109.5 bps and USDT spanning +43.5 bps to +46.7 bps. In practical terms, near-dated funding tightened faster than medium-dated funding, especially on the Bitcoin side, where 1W rose 109.5 bps and 3M fell 16.2 bps.
The information contained within is for educational and informational purposes ONLY. It is not intended nor should it be considered an invitation or inducement to buy or sell any of the underlying instruments cited including but not limited to cryptoassets, financial instruments or any instruments that reference any index provided by CF Benchmarks Ltd. This communication is not intended to persuade or incite you to buy or sell security or securities noted within. Any commentary provided is the opinion of the author and should not be considered a personalised recommendation. Please contact your financial adviser or professional before making an investment decision.
Note: Some of the underlying instruments cited within this material may be restricted to certain customer categories in certain jurisdictions.
Changes to the Token Market Price Benchmarks Series - Market Prices – 21 July 2026
The Administrator has confirmed changes to the Token Market Price Family for the period 14 July 2026 to 21 July 2026.

CF Benchmarks
Softer CPI Reprices July Hike Risk & Lifts Digital Assets
Digital assets extended their recovery over the past week as cooler US inflation prints repriced Fed expectations; the bid was broad across the large cap indices, growth factor leadership returned, stablecoin funding repriced lower, and stress stayed isolated in names hit by token-specific news.
Mark Pilipczuk
Notice of the Demising of CF Dai-Dollar Settlement Price and Spot Rate
The Administrator announces that it will demise the CF Dai-Dollar Settlement Price (DAIUSD_RR) and CF Dai-Dollar Spot Rate (DAIUSD_RTI) which are members of the CF Digital Asset Index Family.
CF Benchmarks
By clicking Accept, you consent to CF Benchmarks's use of cookies.
Visit Cookie Settings to learn how CF Benchmarks uses cookies and to adjust your preferences.