
Feb 16, 2026
Weekly Index Highlights, February 16, 2026
Market Performance Update
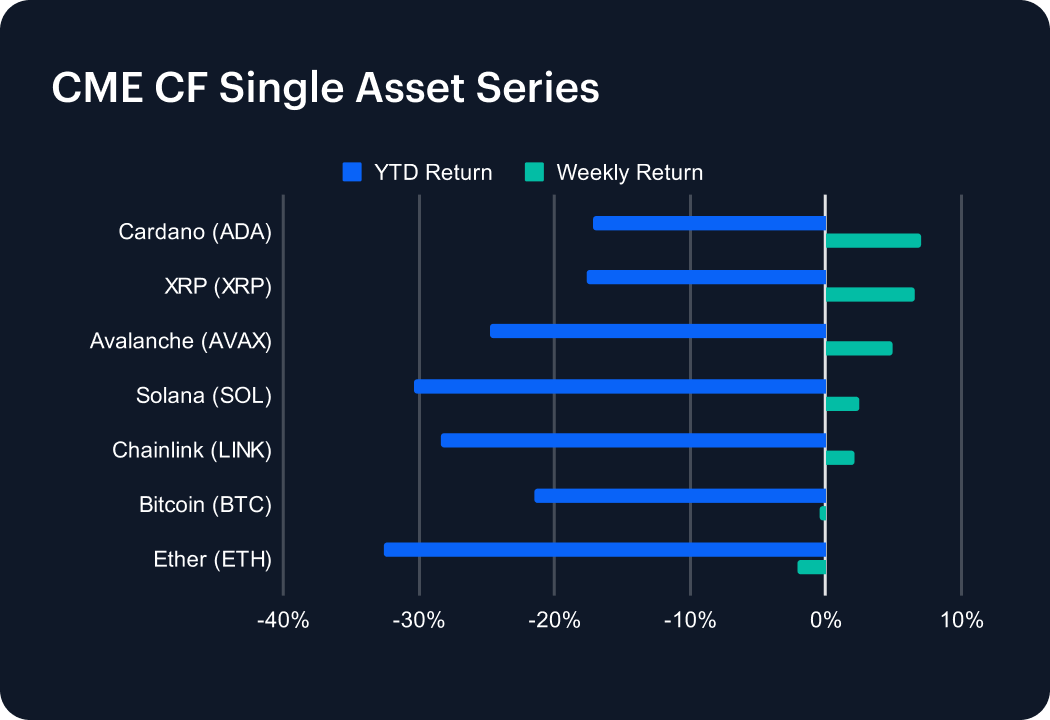
Digital asset markets steadied week-on-week (w/w) after the prior week’s drawdown, with performance rotating toward higher-beta assets. Among the large- and mega-cap coins populating our CME CF Single Asset Series, Cardano gained 7.0% and XRP rose 6.6%, while Avalanche added 4.9% and Solana advanced 2.5%. Bitcoin was essentially unchanged, down just 0.4%, and Ether softened by 2.1%. The shift in leadership is clearer in context: the prior week saw broad declines, with Bitcoin down 9.4% and Ether down 10.5%. This week’s dispersion indicates selective risk appetite rather than a uniform market-wide re-rating, with altcoin strength offset by softness in the largest two assets. Year-to-date (YTD), the single-asset basket remains negative across the series, reinforcing that the recovery has been partial and largely concentrated in the week’s strongest performers.
Volatility Analysis
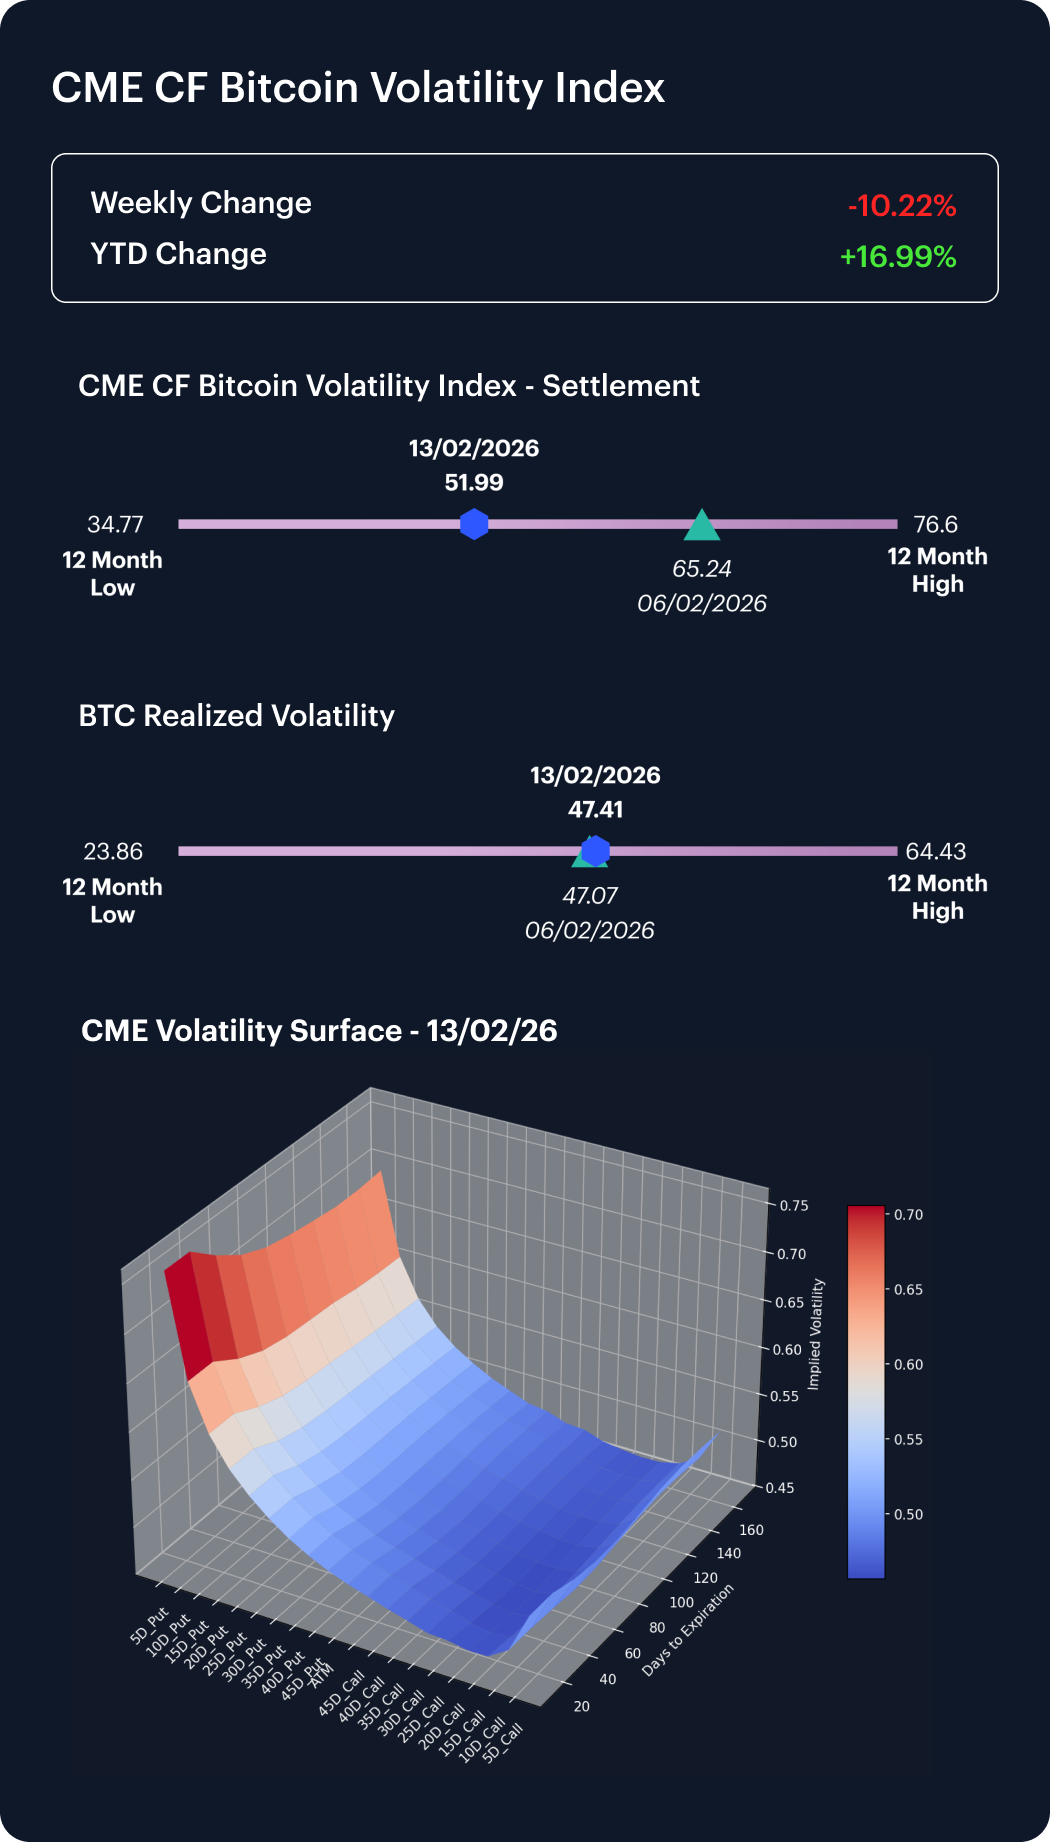
Implied Bitcoin volatility retraced meaningfully over the week, aligning with the broader stabilization in spot performance. Our CME CF Bitcoin Volatility Index (BVXS) fell to 51.99 as of Friday 13th, down 20.31% versus the prior Friday’s 65.24. The magnitude of the decline indicates a rapid unwind of the previous week’s volatility premium, consistent with improved near-term risk pricing, even as leadership rotated toward higher-beta assets.
Market Cap Index Performance
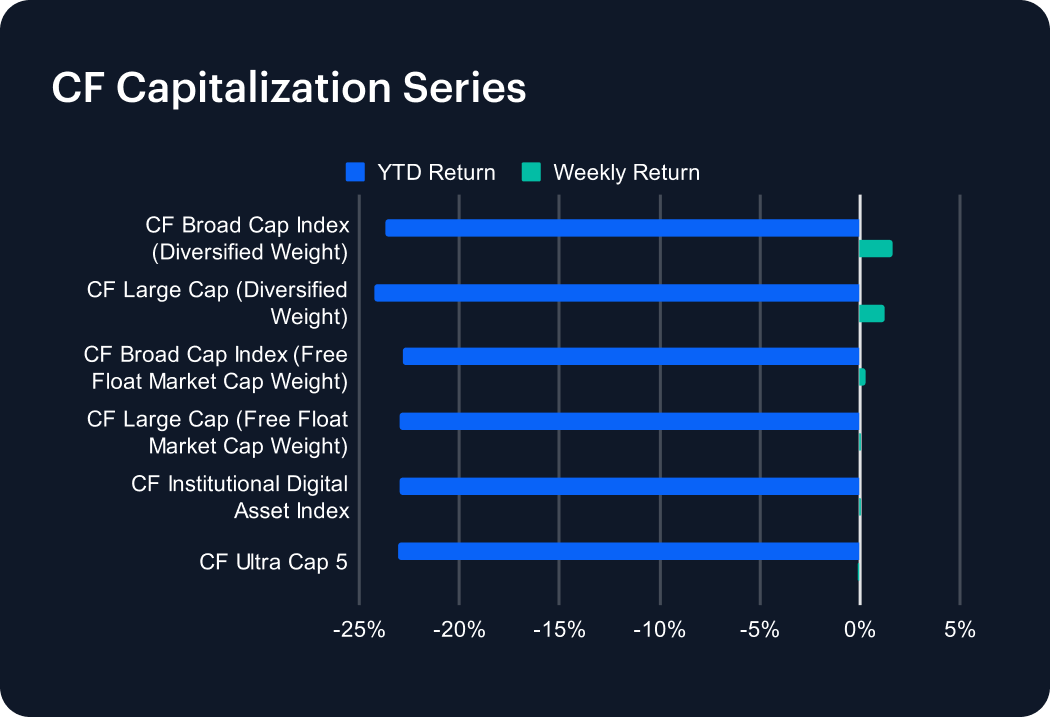
CF Capitalization series returned to positive territory w/w, with diversified-weight indices leading. The Broad Cap (Diversified Weight) gained 1.7% and the Large Cap (Diversified Weight) rose 1.2%. Free-float market-cap-weighted counterparts were closer to flat: Broad Cap (Free Float) increased 0.3% and Large Cap (Free Float) rose 0.1%. The Institutional Digital Asset Index also edged up approximately 0.1%. The Ultra Cap 5 was fractionally lower at -0.1%. The pattern contrasts with the prior week’s near-uniform declines of roughly 9.9% to 10.8% across the capitalization suite. Outperformance in the diversified-weight indices is a moderate indication that the week’s recovery was broader-based below the largest constituents, even as the ultra-cap segment lagged.
Factors Analysis
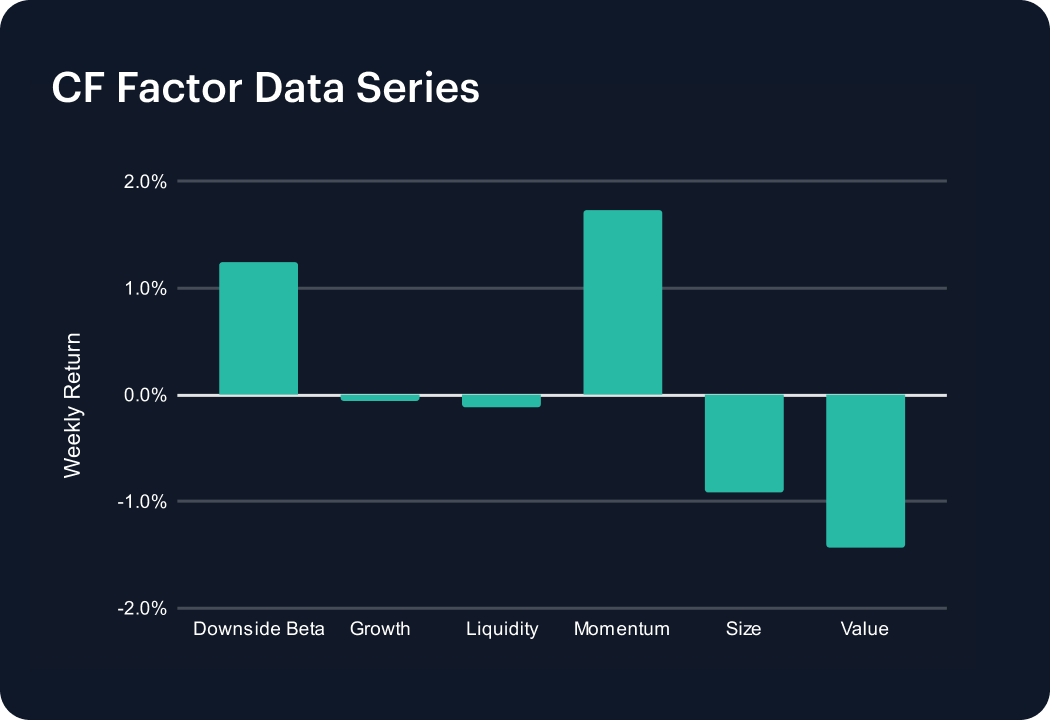
Factor leadership remained uneven over the week, with momentum again positive and value continuing to detract. Momentum delivered a cumulative 1.74% across the week’s daily series, while Downside Beta added 1.24%. Growth was close to flat at -0.06% and Liquidity slipped -0.11%. In contrast, Size fell -0.92% and Value declined -1.42%. The continued negative contribution from Value and Size is consistent with a preference for higher-beta segments of the market.
Classification Series Analysis
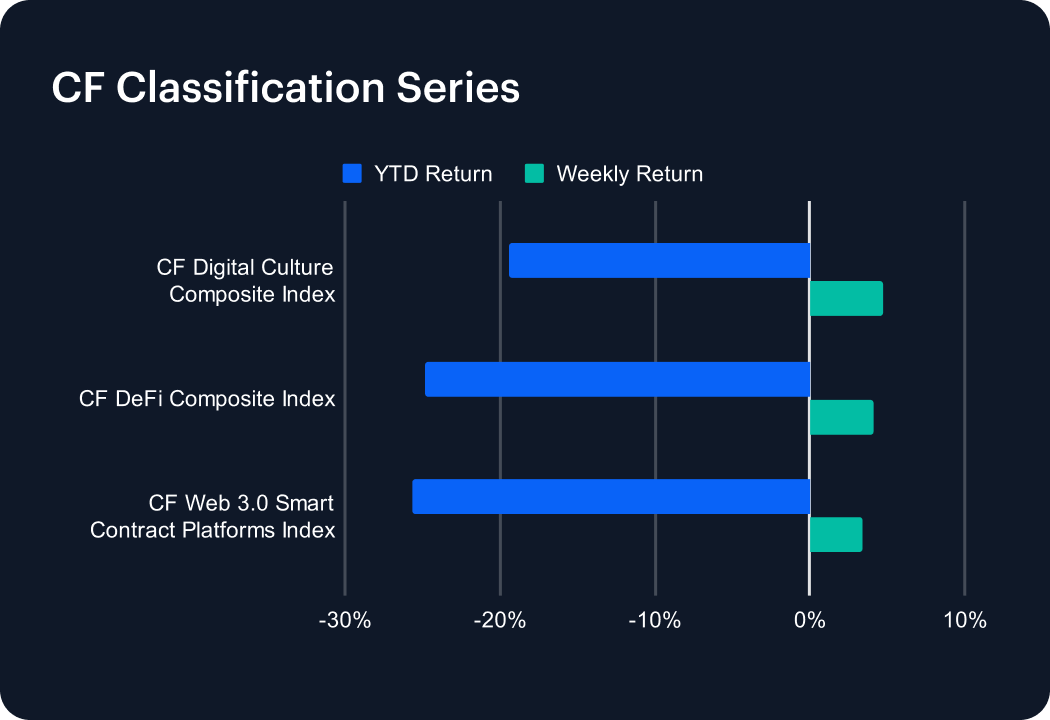
The CF Classifications series also turned higher w/w, with the Digital Culture Composite Index up 4.8%, the DeFi Composite Index up 4.2%, and the Web 3.0 Smart Contract Platforms Index up 3.4%. These moves follow a sharp prior-week pullback, when each classification declined by roughly 11% to 12.6%. In this context, the latest gains are suggestive of a stabilization phase rather than a full retracement of the earlier sell-off. Leadership from Digital Culture and DeFi suggests renewed appetite for application-layer and financial-primitive exposures, while the positive performance in smart contract platforms points to improving sentiment toward the core infrastructure stack.
Sector Analysis
CF Digital Asset Classification Structure (CF DACS) sub-categories staged a broad rebound w/w, with all reported categories posting positive average returns after last week’s synchronized decline. The Infrastructure Sub-Category of Services led at +8.4% on average, followed by the Culture Sub-Category at +6.5%. Non-Programmable advanced 4.8% on average, while the Utility Sub-Category gained 4.2%. Meanwhile, Finance added 2.8% overall. The magnitude of the overall reversal is notable: in the prior week, tiers across our CF DACS taxonomy fell between 8.4% and 11.9%, implying double-digit percentage-point swings in several pockets of the market. The breadth of gains hints at a return of risk appetite across both infrastructure and application themes, with the strongest momentum concentrated in categories that typically exhibit higher beta to sentiment shifts.
CF Staking Series
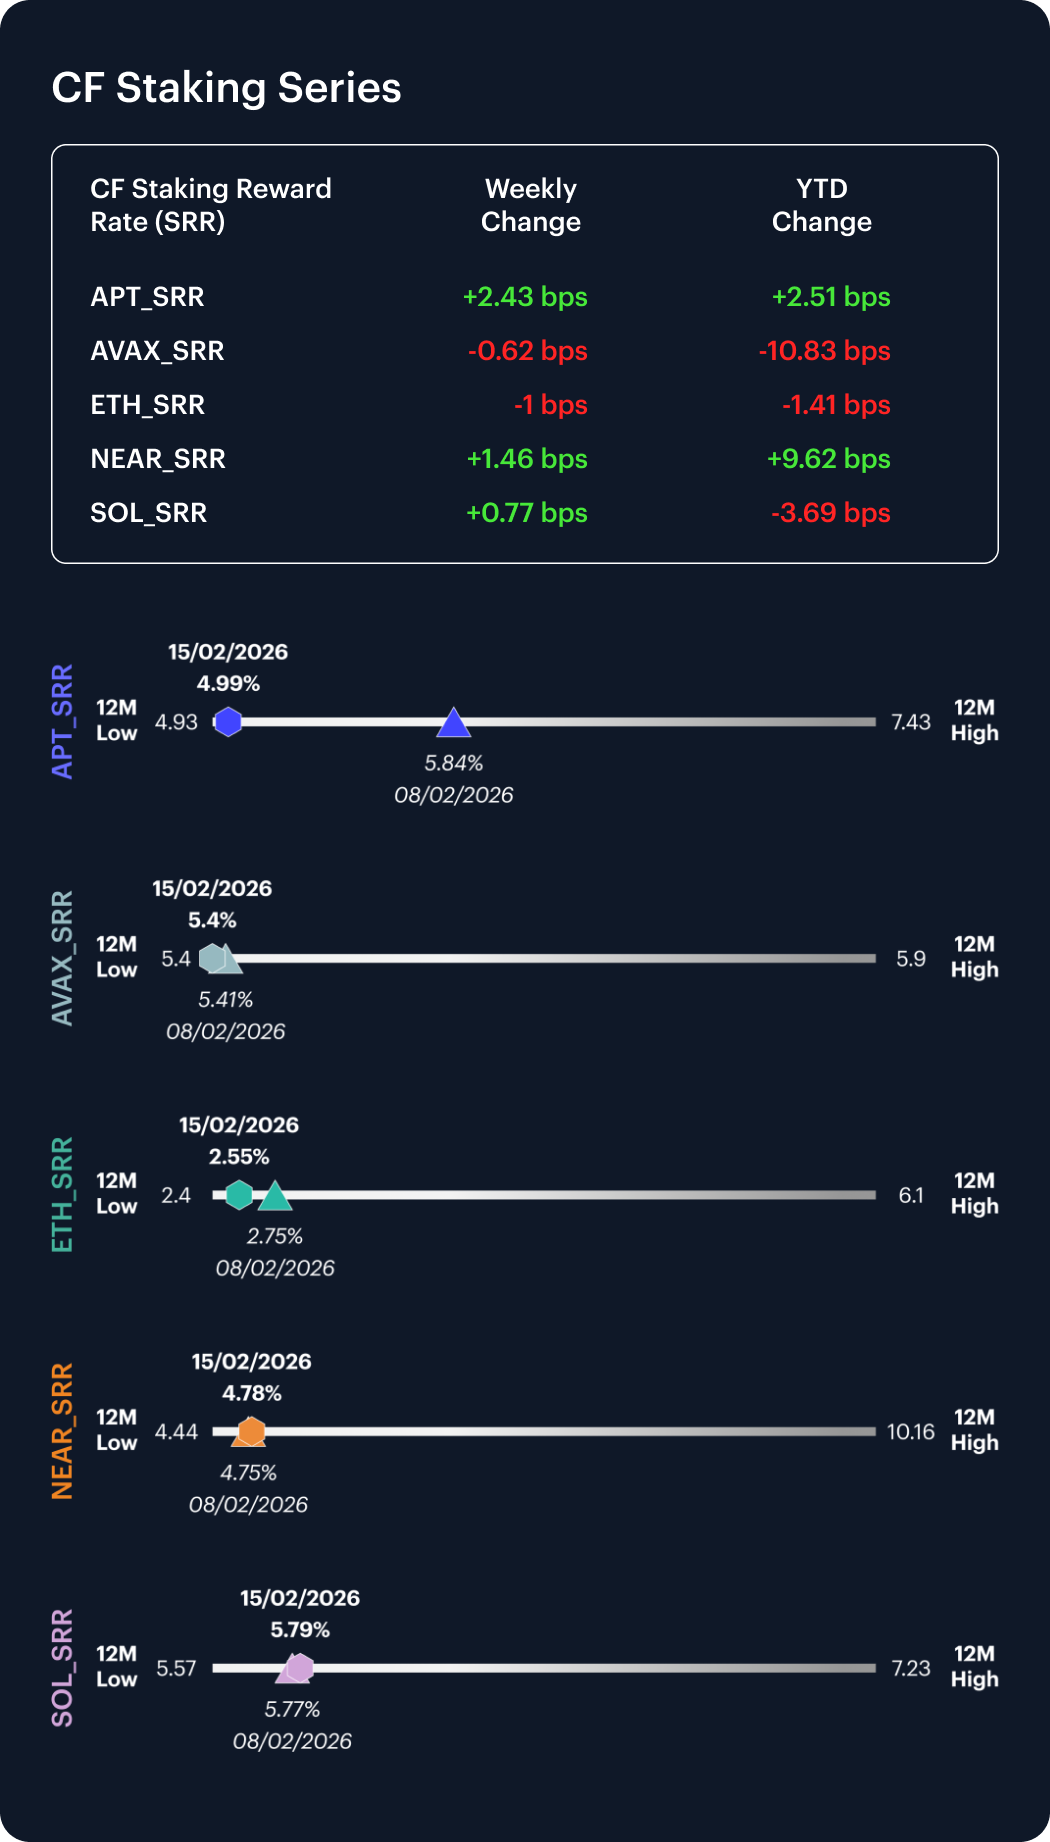
Within the CF Staking Series, performance was mixed w/w and generally more muted than last week’s moves. APT returned 0.49% w/w as its reward rate edged up 2.43 bps. NEAR returned 0.31% as its reward rate rose 1.46 bps. SOL returned 0.13% as its reward rate rose 0.77 bps. On the downside, AVAX returned -0.11% in step with its reward rate falling 0.62 bps, while ETH Staking printed a -0.39% return equating to a 1.00 bp reward rate fall. Overall, staking spot returns clustered close to flat and tracked only modest intra-week reward-rate moves, reinforcing a comparatively stable income backdrop versus the larger swings seen in broader risk assets.
Interest Rate Analysis
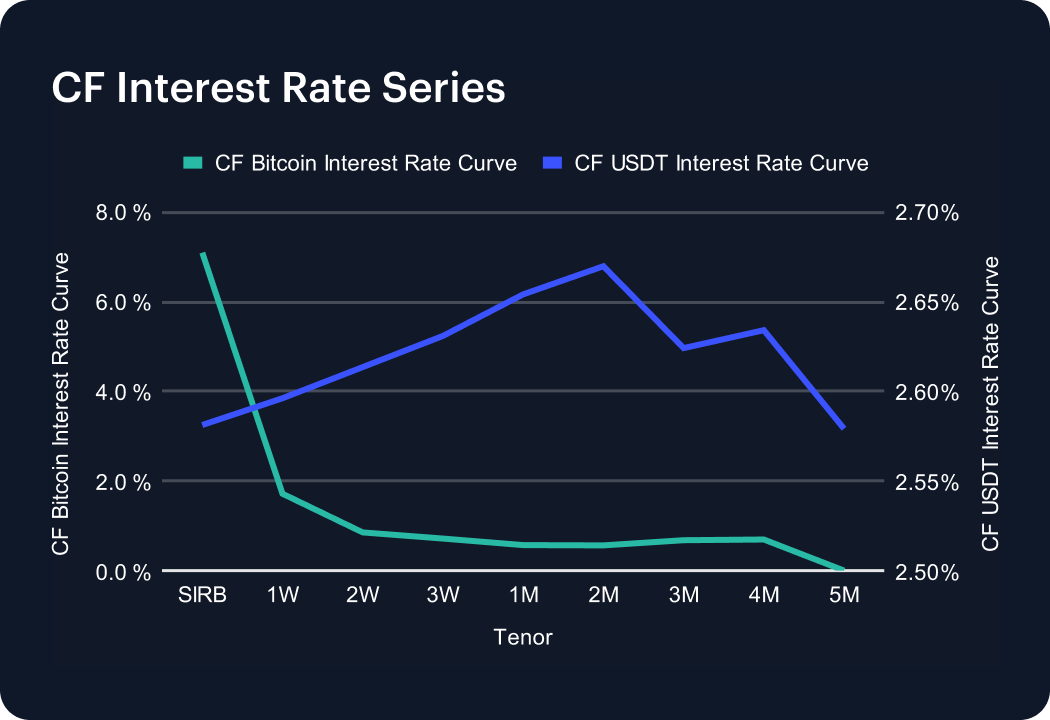
Front-end funding conditions eased sharply on the CF Bitcoin Interest Rate Curve w/w, while USDT funding firmed. The SIRB point fell from 22.94% to 7.10%, a move of 1,584 bps, and the 1W tenor declined from 3.31% to 1.72%, down 159 bps. Further out the curve, the 1M rate moved from 1.32% to 0.57% (down 75 bps) and the 3M rate eased from 1.07% to 0.68% (down 39 bps). By contrast, USDT rates rose across the same tenors: SIRB increased from 2.25% to 2.58% (up 33 bps) and 1W moved from 2.26% to 2.60% (up 34 bps). The net effect was a meaningful compression in the BTC front end alongside a modest upward shift in stablecoin funding costs.
The information contained within is for educational and informational purposes ONLY. It is not intended nor should it be considered an invitation or inducement to buy or sell any of the underlying instruments cited including but not limited to cryptoassets, financial instruments or any instruments that reference any index provided by CF Benchmarks Ltd. This communication is not intended to persuade or incite you to buy or sell security or securities noted within. Any commentary provided is the opinion of the author and should not be considered a personalised recommendation. Please contact your financial adviser or professional before making an investment decision.
Note: Some of the underlying instruments cited within this material may be restricted to certain customer categories in certain jurisdictions.
Changes to the Token Market Price Benchmarks Series - Market Prices – 21 July 2026
The Administrator has confirmed changes to the Token Market Price Family for the period 14 July 2026 to 21 July 2026.

CF Benchmarks
Softer CPI Reprices July Hike Risk & Lifts Digital Assets
Digital assets extended their recovery over the past week as cooler US inflation prints repriced Fed expectations; the bid was broad across the large cap indices, growth factor leadership returned, stablecoin funding repriced lower, and stress stayed isolated in names hit by token-specific news.
Mark Pilipczuk
Notice of the Demising of CF Dai-Dollar Settlement Price and Spot Rate
The Administrator announces that it will demise the CF Dai-Dollar Settlement Price (DAIUSD_RR) and CF Dai-Dollar Spot Rate (DAIUSD_RTI) which are members of the CF Digital Asset Index Family.
CF Benchmarks
By clicking Accept, you consent to CF Benchmarks's use of cookies.
Visit Cookie Settings to learn how CF Benchmarks uses cookies and to adjust your preferences.