
Dec 09, 2024
Weekly Index Highlights, December 9, 2024
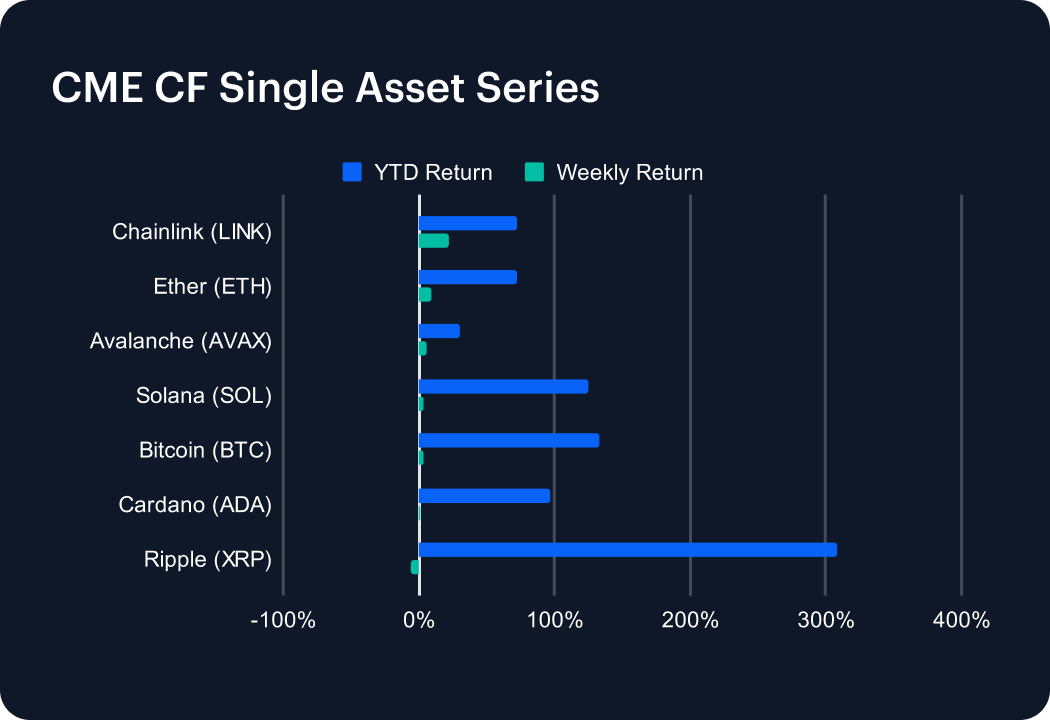
Crypto participants broadly opted for increased caution immediately following Bitcoin’s $100,000 milestone. Note the week closed with ETH’s somewhat less celebrated retaking of $4,000 for the first time since March, and news of the highest ever monthly inflows into U.S. listed BTC and ETH ETFs. Our CME CF Bitcoin Reference Rate (BRR) steadied below $100k after marking its record peak at $102,378.21 on December 5th; its relatively modest weekly pace of +3.02% underscoring the careful progression. ETH, +8.69%, was less constrained, though Chainlink (LINK) +22.13%, was the week’s outperformer in this series. LINK’s year-to-date (YTD) return now stands at +72.30%, fractionally below ETH’s at +72.51%. Compare these to series underperformer on a YTD basis, Avalanche (AVAX), +30.38%; and YTD outperformer, XRP, +307.97%, after ticking down a weekly -5.85%.
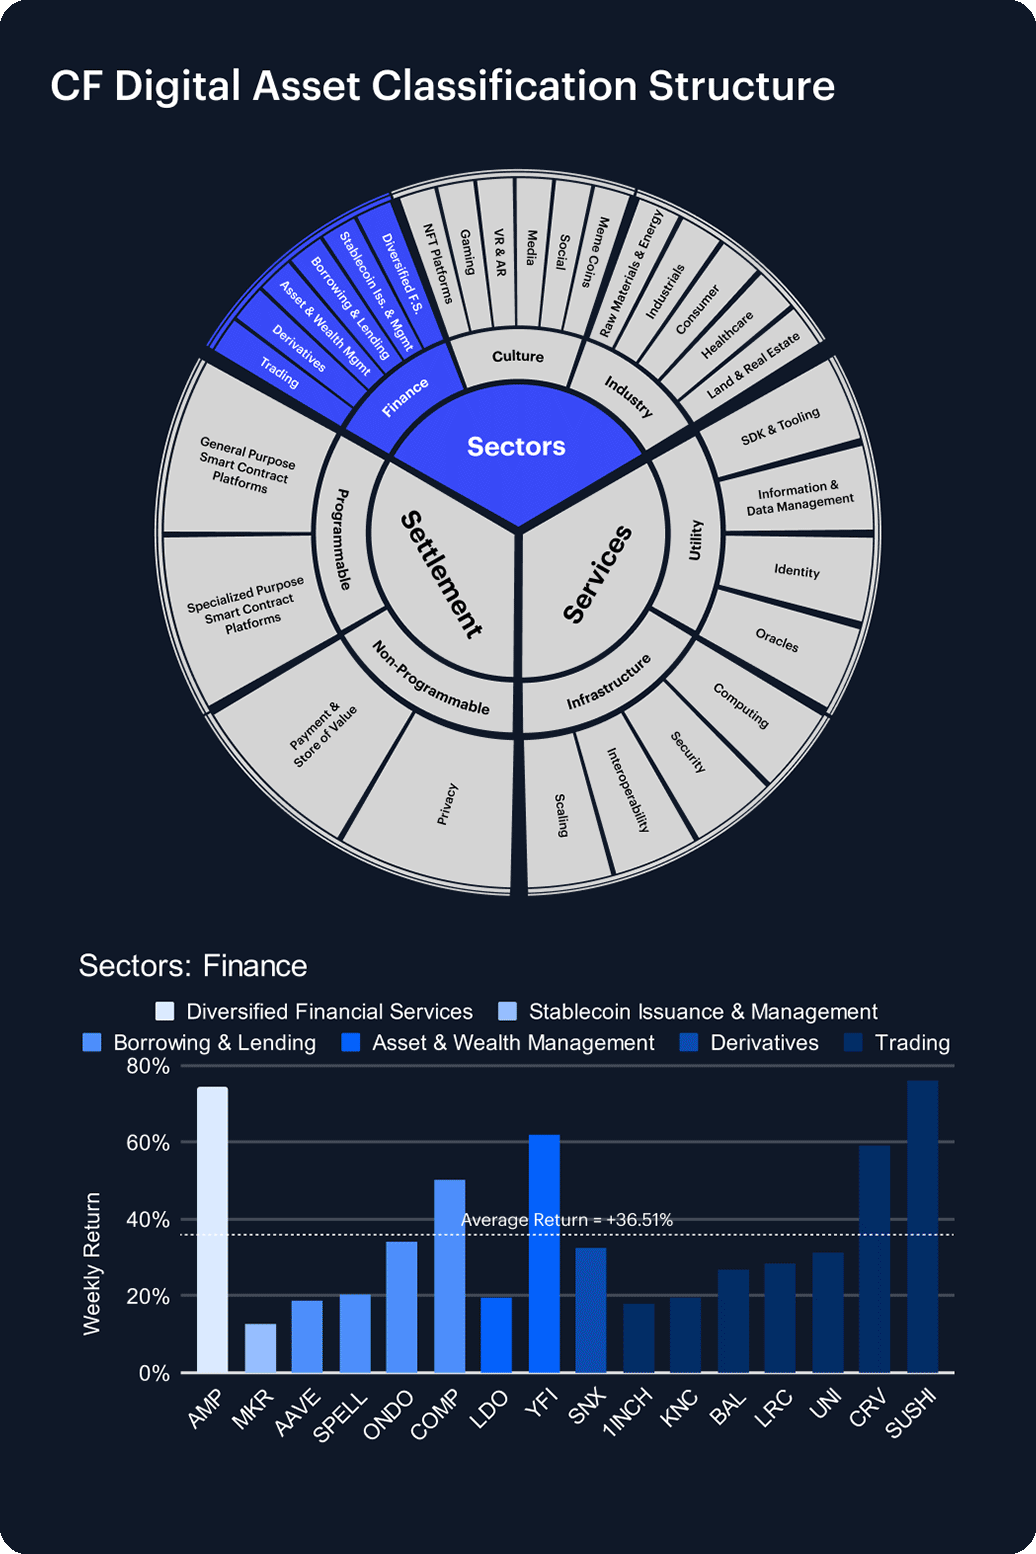
A swing in favor for DeFi, as this sub-category closed +36.51% better, on average. SUSHI was its best contributor, leaping +76.12%, with most of that gain occurring on Friday after the Sushi DAO issued a treasury diversification proposal. All Trading segment tokens followed in SUSHI’s wake, eg, CRV +58.97%, and UNI + 31.37%. yearn.finance (YFI), in the Asset & Wealth Management segment, was second-strongest DeFi performer though, +62.01%. The Gaming segment resumed its recent lead over the Culture sub-category, led by SUPER, +46.96%, and GALA, +40.90%. VR and AR protocol The Sandbox (SAND) was also specifically targeted within Culture, advancing +41.64%. RARI outperformed Meme Coins, up +44.78%, vs. DOGE and SHIB which managed +7.27% and +8.23% respectively.
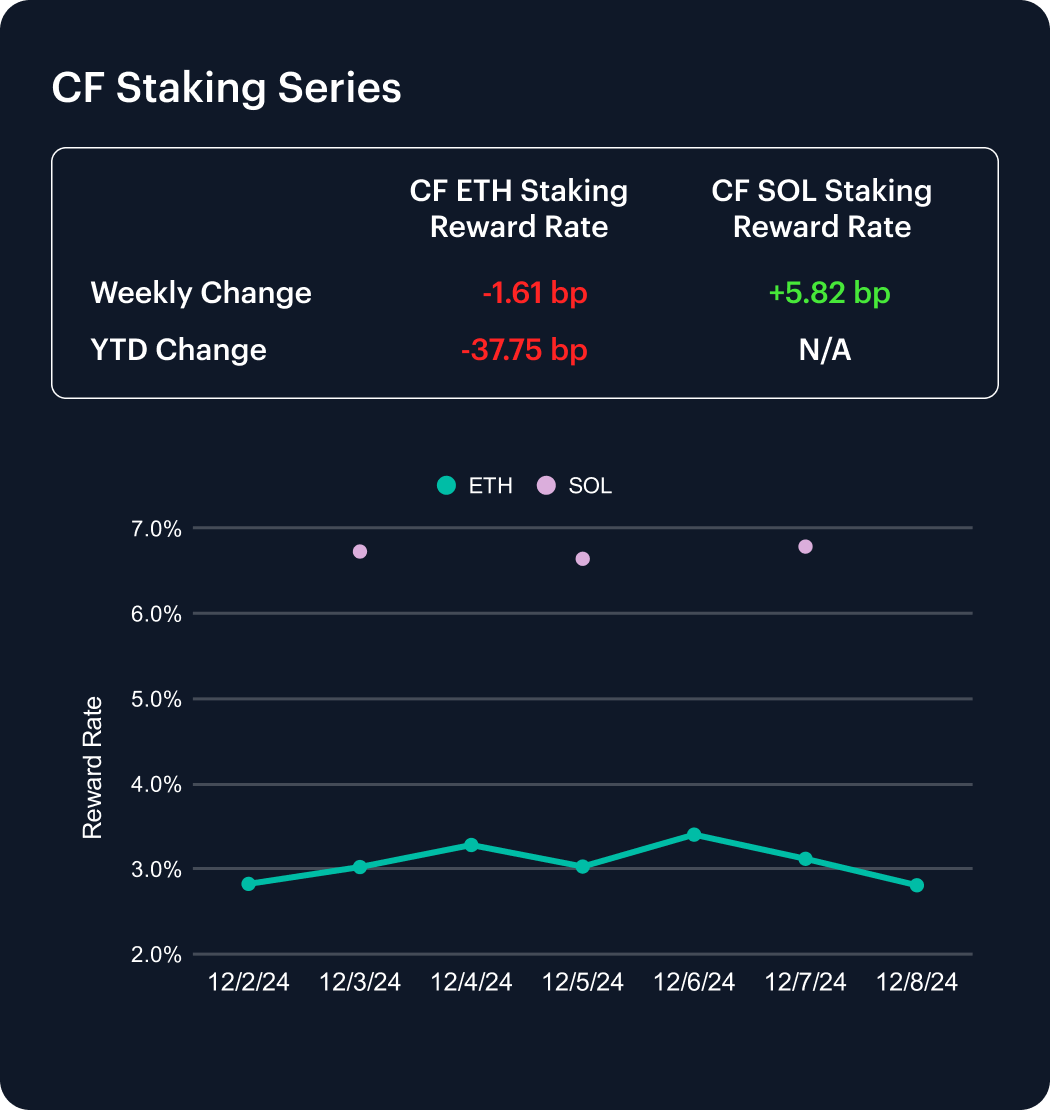
Hopes for a positive year-on-year change for ETH staking rewards in 2024 receded further by the end of last week. The CF ETH Staking Reward Rate Index (ETH_SRR) weekly change closed a further -1.61 bp lower, taking the current YTD change to -37.75 bp. Progress for Solana staking rewards continued their recent favorable comparison with those of Ethereum. The CF SOL Staking Reward Rate Index (SOL_SRR) gained +5.82 bp for the week. Our SOL_SRR web page indicates the index has risen approximately 14 percentage points over the last month. CF Benchmarks launched the CF SOL Staking Reward Rate Index (SOL_SRR) as the second benchmark in this series in mid-November 2024.
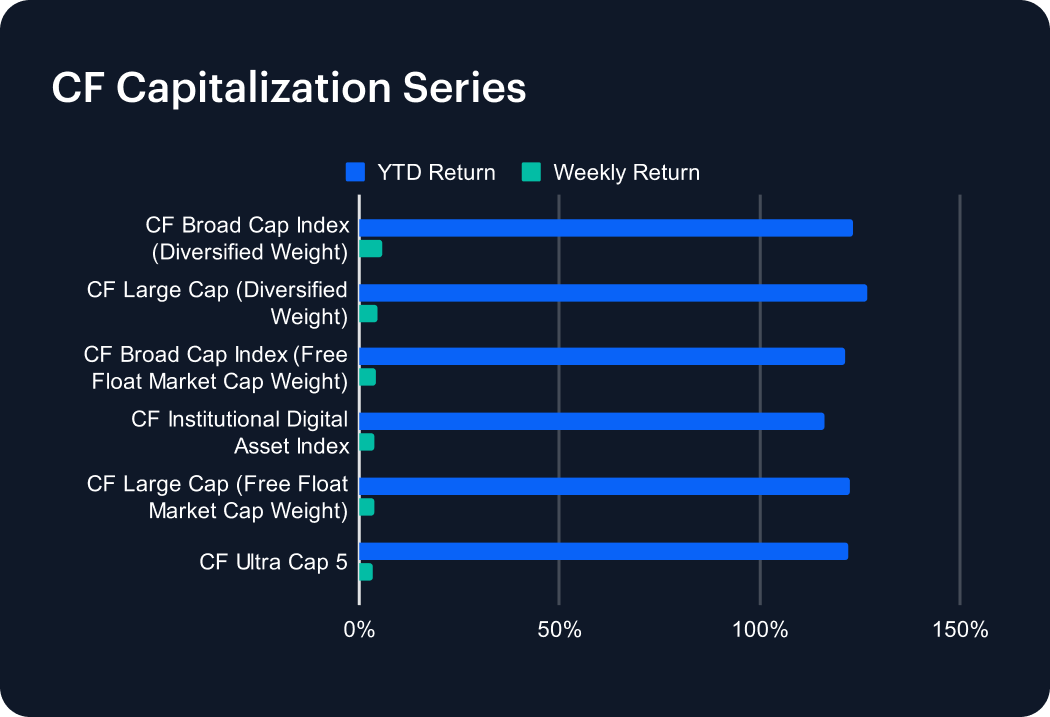
Differentials narrowed further across CF Capitalization Series Indices. Notional outperformer, the CF Broad Cap Index (Diversified Weight) added +5.56% for the week, compared to the +3.33% uptick for the weakest performer, the CF Ultra Cap 5. Bitcoin and Ether on aggregate, denoted by the CF Institutional Digital Asset Index, rose +3.85%.
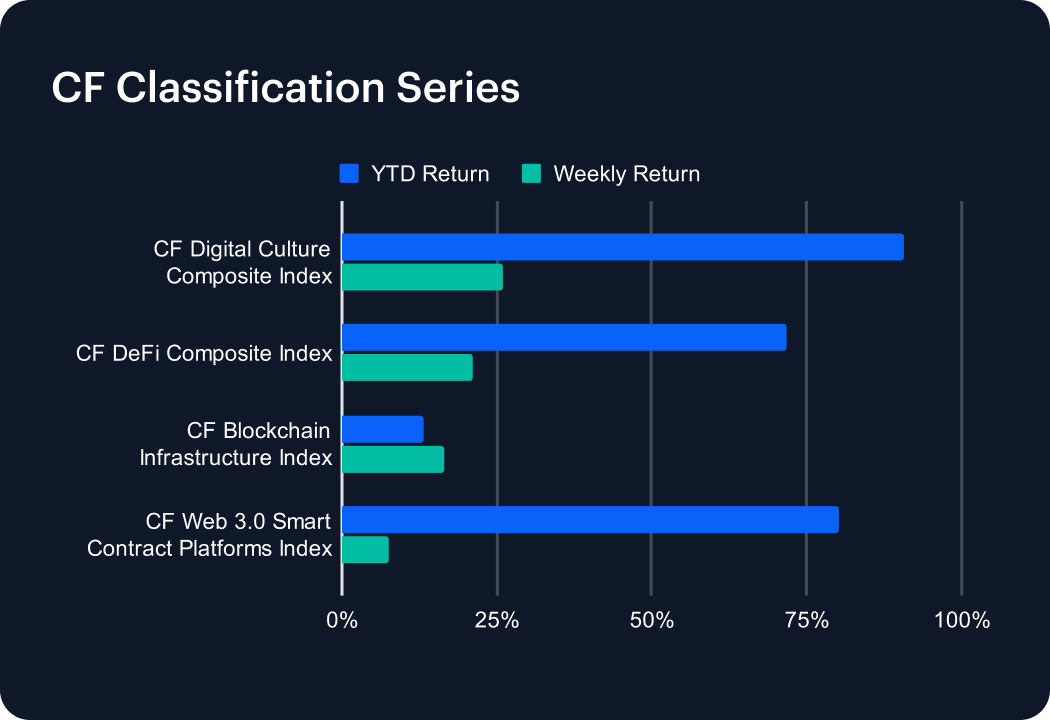
The CF Digital Culture Composite Index posted the standout advance of the week in this series, jumping +25.89%, and extending its best-in-series outperformance YTD to +90.78%. The CF DeFi Composite Index followed with a +21.15% weekly return, while maintaining its position as third-best series outperformer YTD, up +71.70%. With a gain of +80.24%, the CF Web 3.0 Smart Contract Platforms Index is next best YTD performer after the CF Digital Culture Composite Index, though the former only rose a modest +7.61% last week. (See the CF DACS section for additional color on the strong showing during the week for Culture and DeFi protocols.)
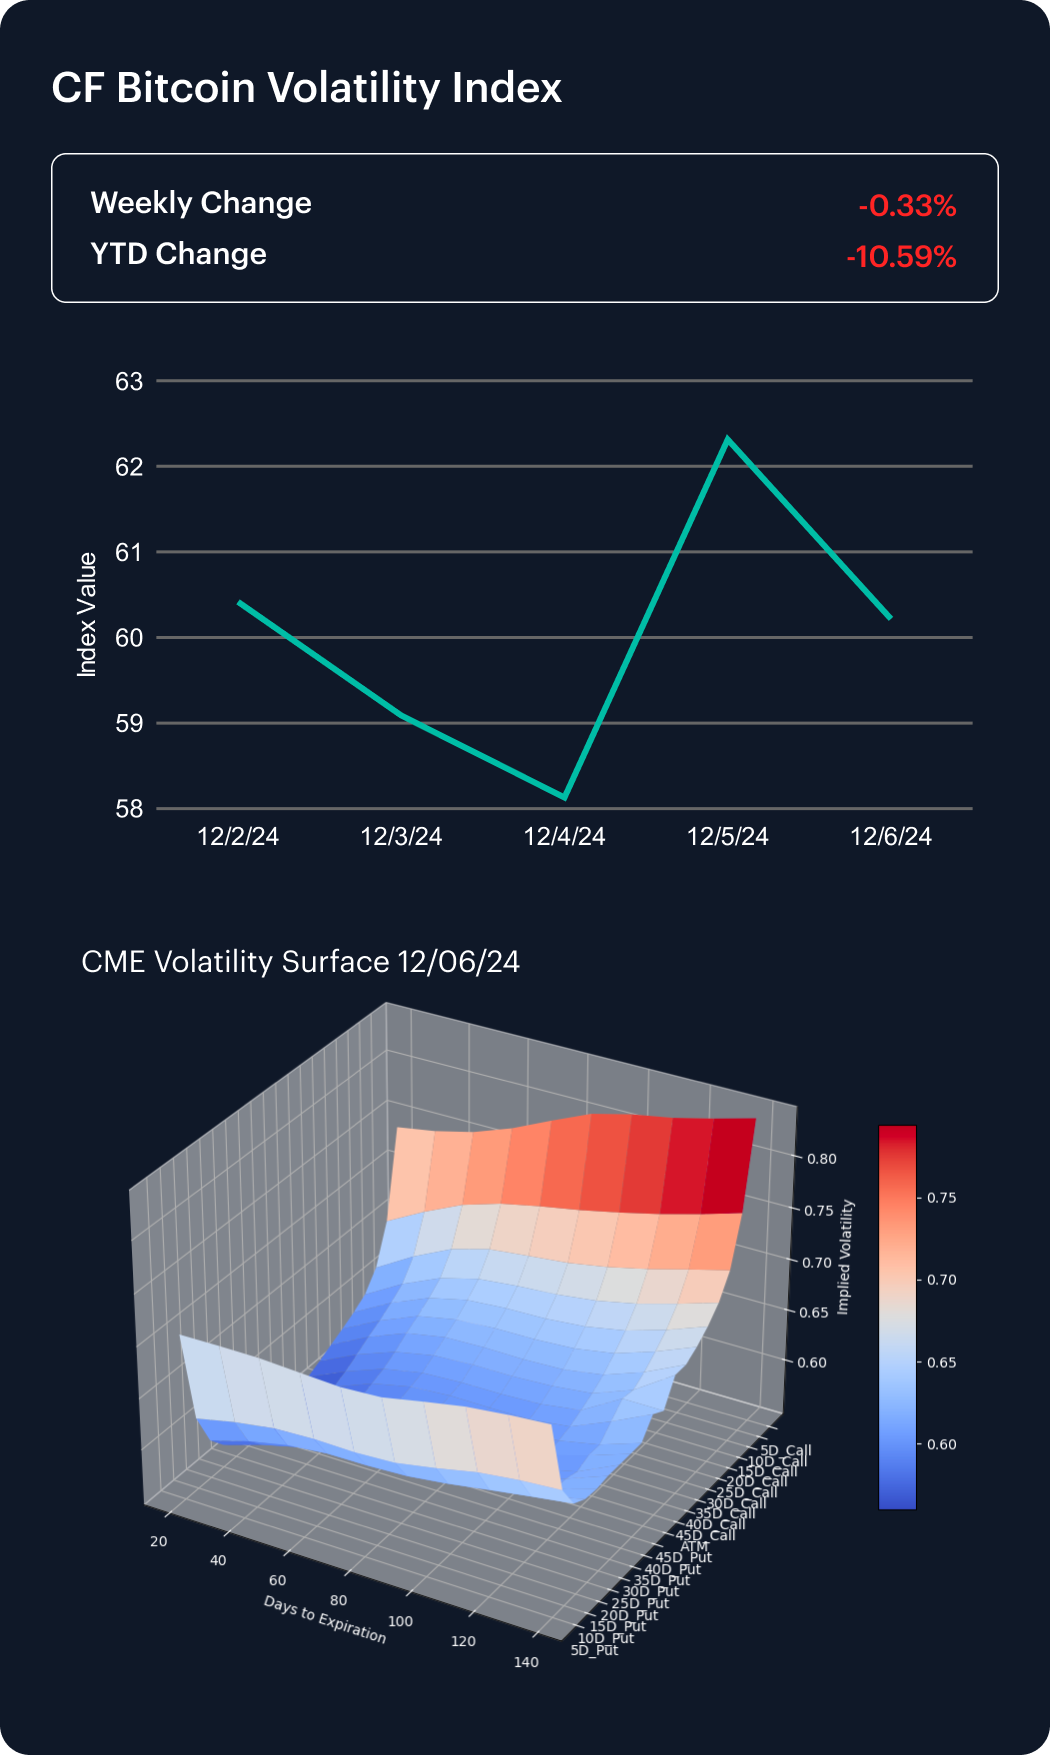
CME Bitcoin implied volatility witnessed the continuation of its several-weeks long down trend, with further signs of negative strategic positioning (for volatility), keeping a cap on the CF Bitcoin Volatility Index Settlement Rate (BVXS). A brief mid-week bounce was followed by a softer close by last Friday, as the index edged down -0.33%. This left the year-to-date change at -10.59%.
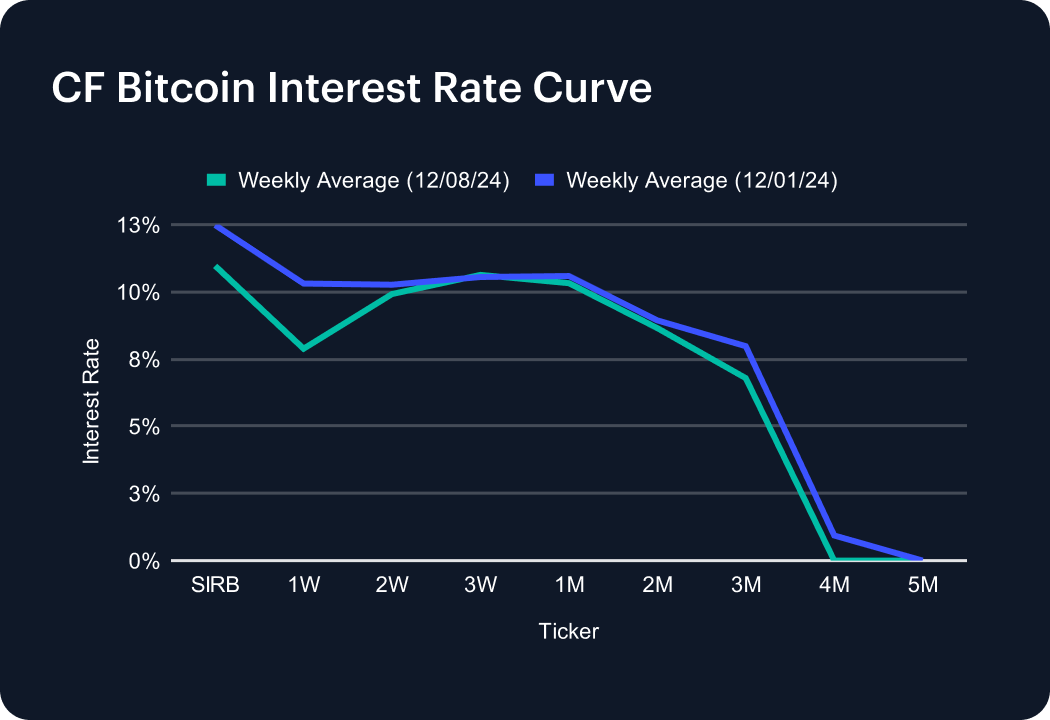
CF BIRC rates generally pulled back over the week between Session and 3-Week tenors, while steadier performances were seen in the middle of the term structure, and indicative inactivity at the longer end might be spreading. The Session rate dipped 1.52 of a percentage point to 10.97%, the 1-Week was 2.43 points lower to 10.31%, and the 2-Week ticked back 0.35 of a point to 9.92%. Moves were more in the order of tens of basis points at the 3-Week through the 2-Month tenors; while the 3-month notched a fall of 1.19 of a point to 6.79%. Both the 4-Month and the 5-Month rates are now indicating a ‘zero’ reading. The former stood at 0.94% at the end of the prior week.
The information contained within is for educational and informational purposes ONLY. It is not intended nor should it be considered an invitation or inducement to buy or sell any of the underlying instruments cited including but not limited to cryptoassets, financial instruments or any instruments that reference any index provided by CF Benchmarks Ltd. This communication is not intended to persuade or incite you to buy or sell security or securities noted within. Any commentary provided is the opinion of the author and should not be considered a personalised recommendation. Please contact your financial adviser or professional before making an investment decision.
Note: Some of the underlying instruments cited within this material may be restricted to certain customer categories in certain jurisdictions.
Softer CPI Reprices July Hike Risk & Lifts Digital Assets
Digital assets extended their recovery over the past week as cooler US inflation prints repriced Fed expectations; the bid was broad across the large cap indices, growth factor leadership returned, stablecoin funding repriced lower, and stress stayed isolated in names hit by token-specific news.

Mark Pilipczuk
Notice of the Demising of CF Dai-Dollar Settlement Price and Spot Rate
The Administrator announces that it will demise the CF Dai-Dollar Settlement Price (DAIUSD_RR) and CF Dai-Dollar Spot Rate (DAIUSD_RTI) which are members of the CF Digital Asset Index Family.
CF Benchmarks
Addition of the Tether Gold Settlement Price and Spot Rate to the CF Digital Asset Index Family
The Administrator announces the addition of the Tether Gold Settlement Price and Spot Rate to the CF Digital Asset Index Family - Single Asset Series.
CF Benchmarks
By clicking Accept, you consent to CF Benchmarks's use of cookies.
Visit Cookie Settings to learn how CF Benchmarks uses cookies and to adjust your preferences.