
Aug 26, 2025
Weekly Index Highlights, August 25, 2025
Market Performance Update
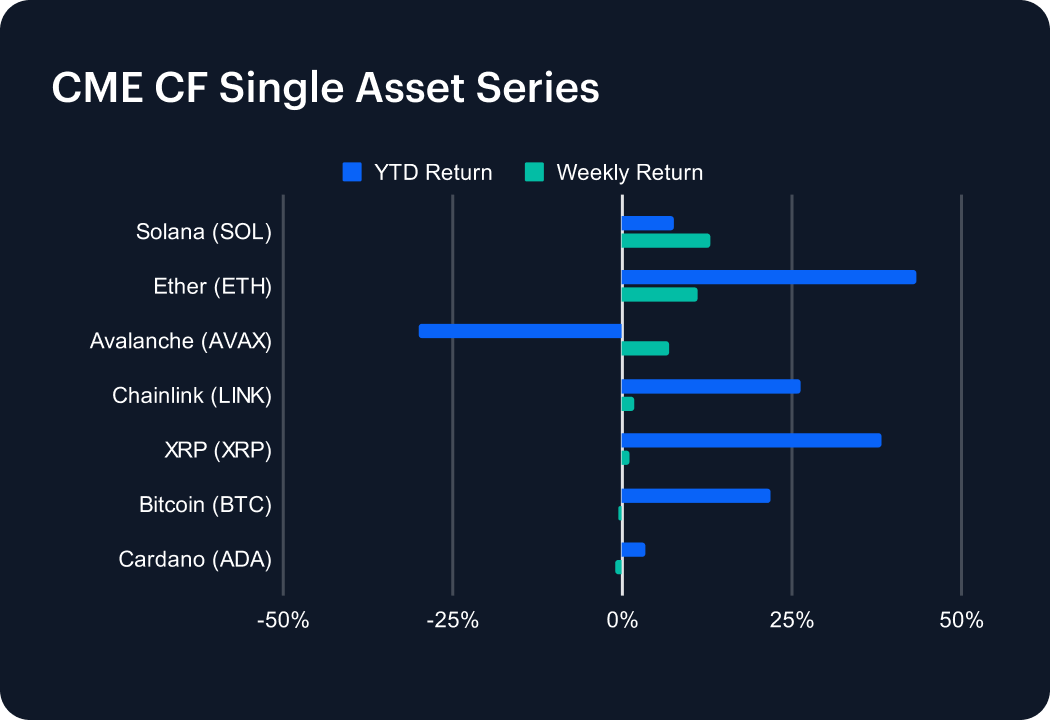
In another volatile week, altcoins again drove momentum with uneven but notable gains. Solana led the pack, surging 12.93% to push its year-to-date advance to 7.69%, while Ether followed closely, rallying 11.02% and extending its dominance with a robust 43.30% gain in 2025. Avalanche added 6.96%, though it remains deeply underwater at –30.11% YTD. Chainlink managed only a modest 1.65% rise but still sits on a 26.37% gain for the year. Among laggards, XRP ticked up 1.06%, easing back from its prior pace yet still strong at 38.25% YTD. Bitcoin slipped 0.70%, trimming its annual return to 21.80%, while Cardano dipped 1.04%, leaving it with just a 3.36% gain for 2025.

Sector Analysis
The DACS categories remained broadly constructive, though leadership shifted across sub-categories. Programmable Settlement stole the spotlight once again, with Solana (12.93%) and Ethereum (11.02%) driving outsized gains well above the 2.82% sub-category average, while Avalanche (6.96%) and Ethereum Classic (8.34%) added further depth. By contrast, Cardano (–1.04%) and Sei (–5.72%) weighed on the cohort. Non-Programmable Settlement was steadier, led by Bitcoin Cash (+5.22%) against a 1.19% average, though Bitcoin (–0.70%) and Stellar (–0.69%) lagged. Infrastructure saw fireworks from Arbitrum (12.14%), easily eclipsing peers, while Skale (–8.33%) and Helium (–1.40%) underscored selective weakness. In Culture, Gaming surged as Prime (24.12%) dramatically outperformed its 2.66% average, while Super (–5.27%) and BONK (–1.26%) marked the week’s notable laggards.
CF Staking Series
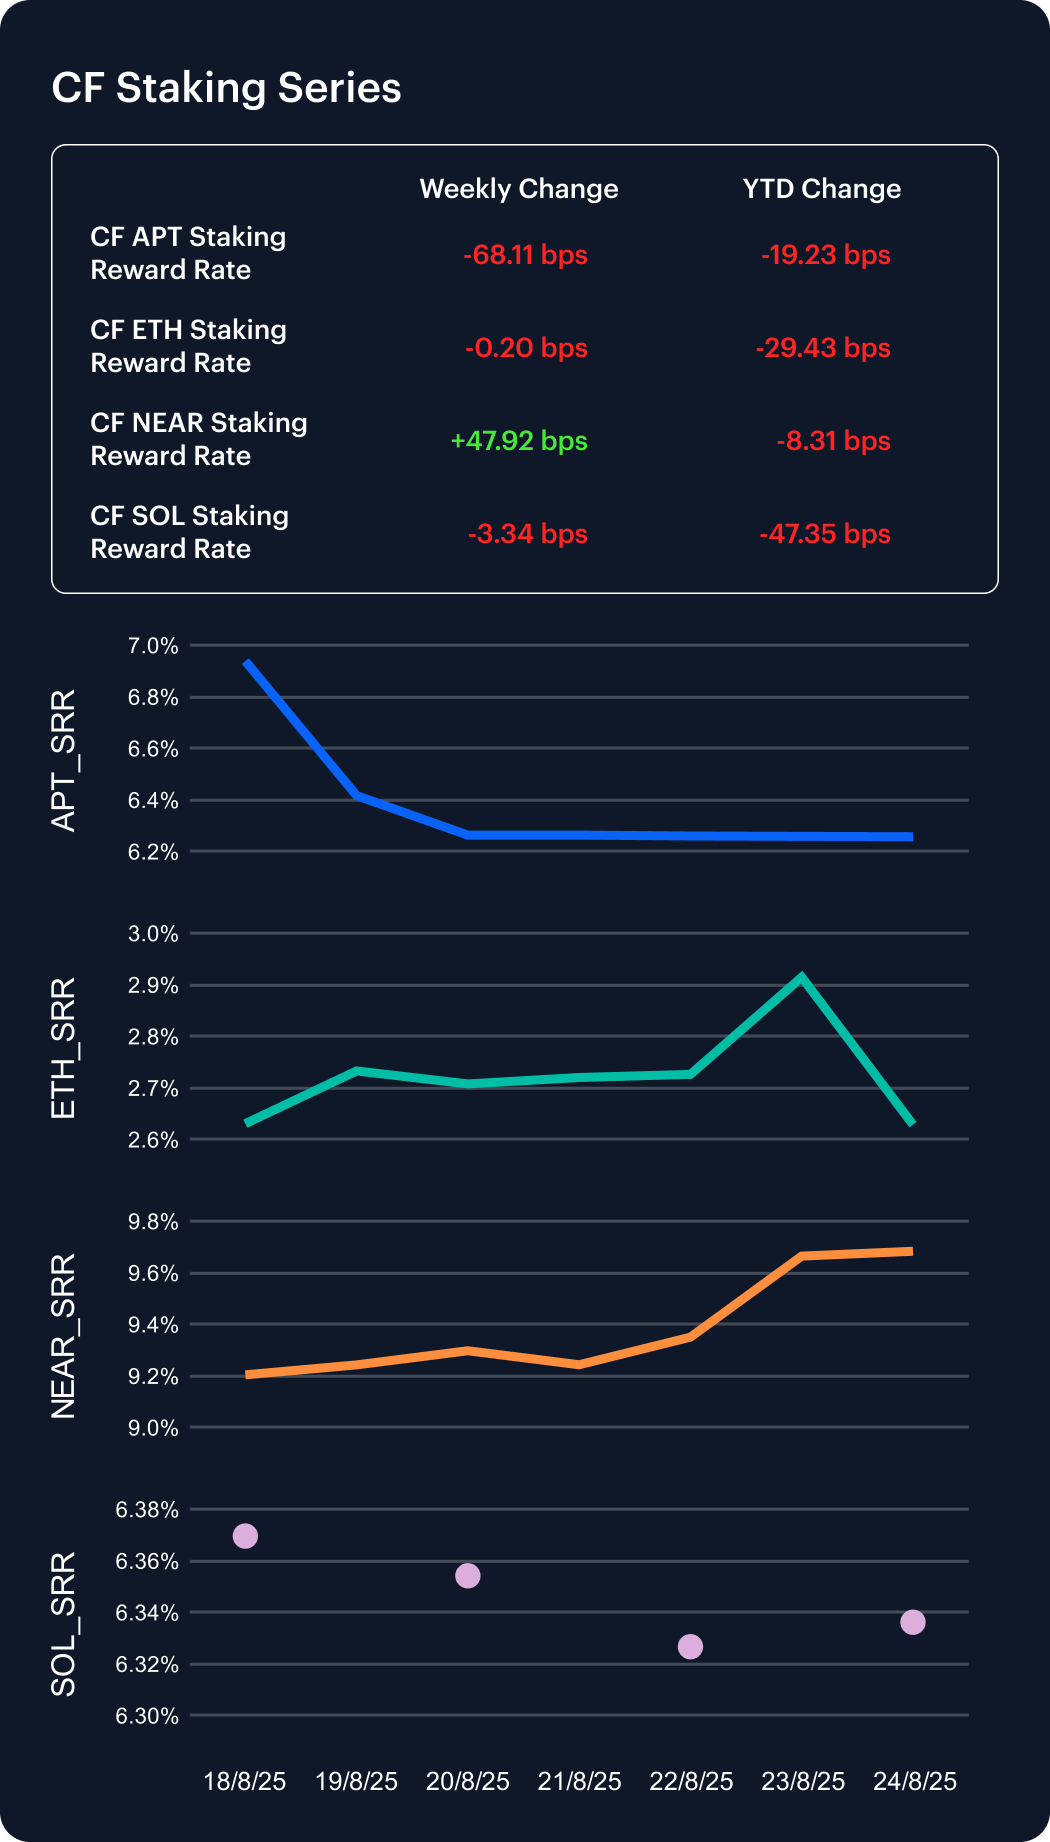
Staking rewards ended the week with familiar dispersion. NEAR once again led the field, its annualized reward rate jumping 47.92 bps to 9.68%, trimming its 2025 decline to just –8.31 bps (–0.85%). Aptos was the week’s notable laggard, sliding 68.11 bps to 6.26% and deepening its YTD erosion to –19.23 bps (–2.98%). Ethereum was comparatively stable, easing just 0.20 bps to 2.63%, though its cumulative 29.43 bps drawdown leaves it with the sharpest loss among majors YTD. Solana slipped 3.34 bps to 6.34%, maintaining a steeper –47.35 bps decline for 2025. The mix underscores how validator economics continue to diverge across Proof-of-Stake ecosystems.
Market Cap Index Performance
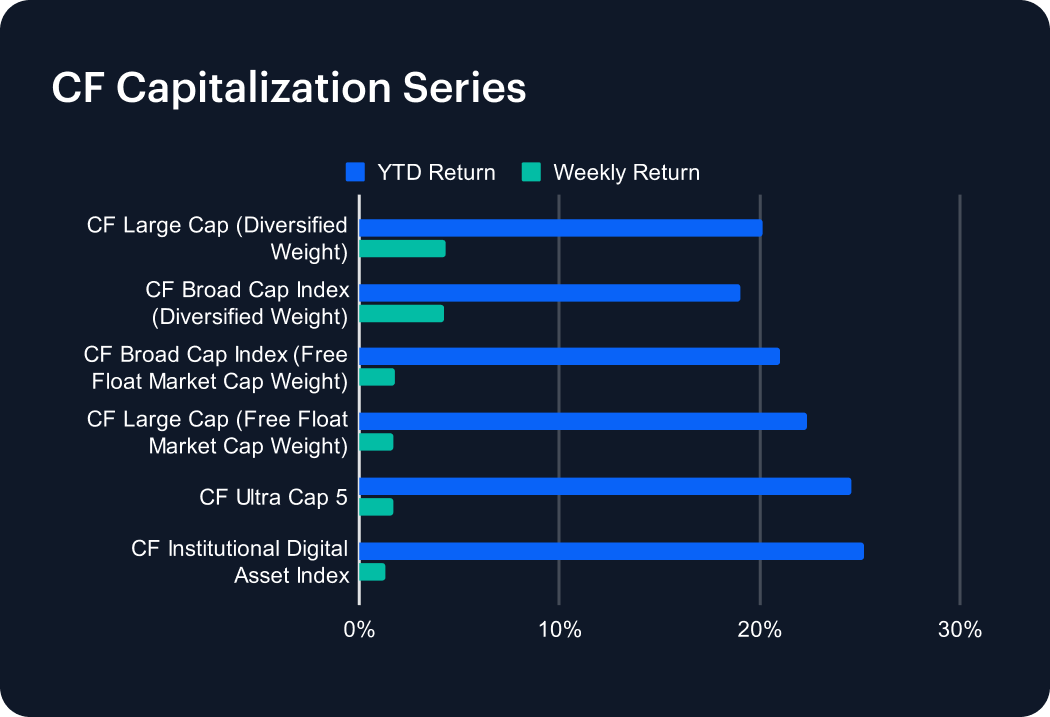
Momentum returned to the CF Capitalization Series last week, as diversified-weighted benchmarks outperformed. The CF Large Cap (Diversified Weight) led the charge, climbing 4.33% to lift its year-to-date return to 20.17%, while the CF Broad Cap (Diversified Weight) advanced 4.27%, extending its 2025 gain to 19.08%. Free-float measures lagged behind: the CF Broad Cap Index rose 1.78% (YTD 21.02%), while the CF Large Cap (Free Float) added 1.72%, pushing its annual return to 22.35%. Among flagship gauges, the CF Ultra Cap 5 gained 1.70%, building a 24.61% YTD advance. The CF Institutional Digital Asset Index posted a 1.30% rise, remaining the top performer year-to-date at 25.19%. The results highlight sustained concentration in large-cap layer-1 tokens.
Classification Series Analysis
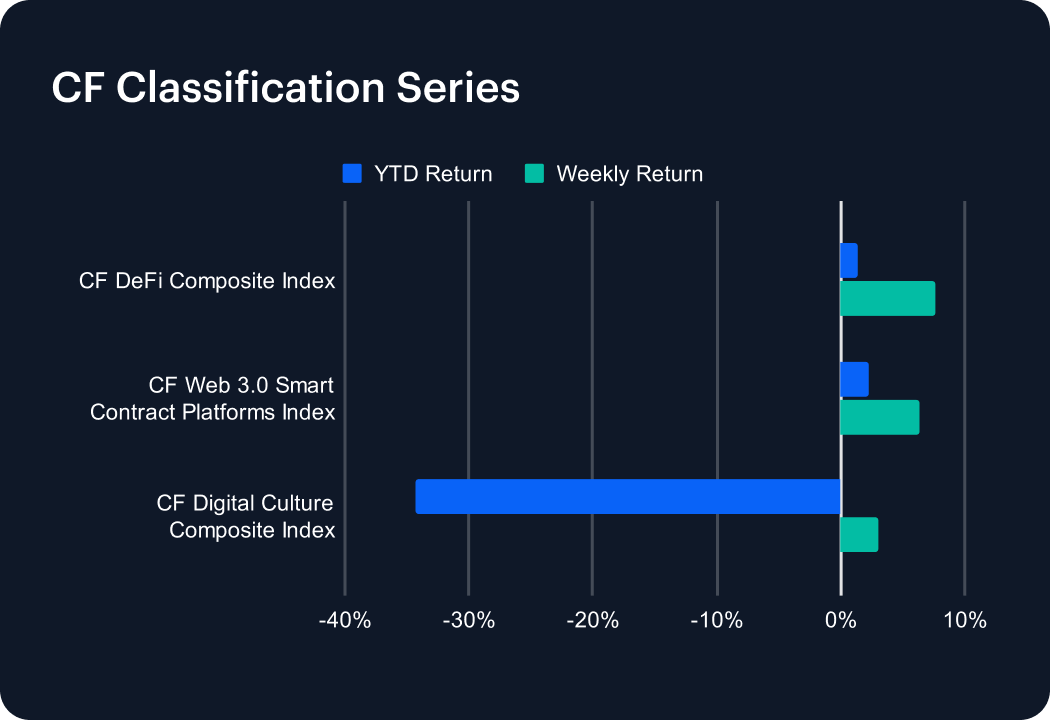
Last week brought firmer gains across the CF Classification Series, with risk-sensitive sectors showing renewed traction. The CF DeFi Composite Index led, rallying 7.67% to lift its year-to-date return into positive territory at 1.35%. The CF Web 3.0 Smart Contract Platforms Index followed with a 6.34% rise, extending its advance to 2.29% in 2025. Meanwhile, the CF Digital Culture Composite Index gained 3.03%, though it remains deeply underwater at –34.30% year to date. Despite the constructive moves, these high-beta themes continue to trade well below prior peaks, underscoring fragile conviction across digital asset verticals.
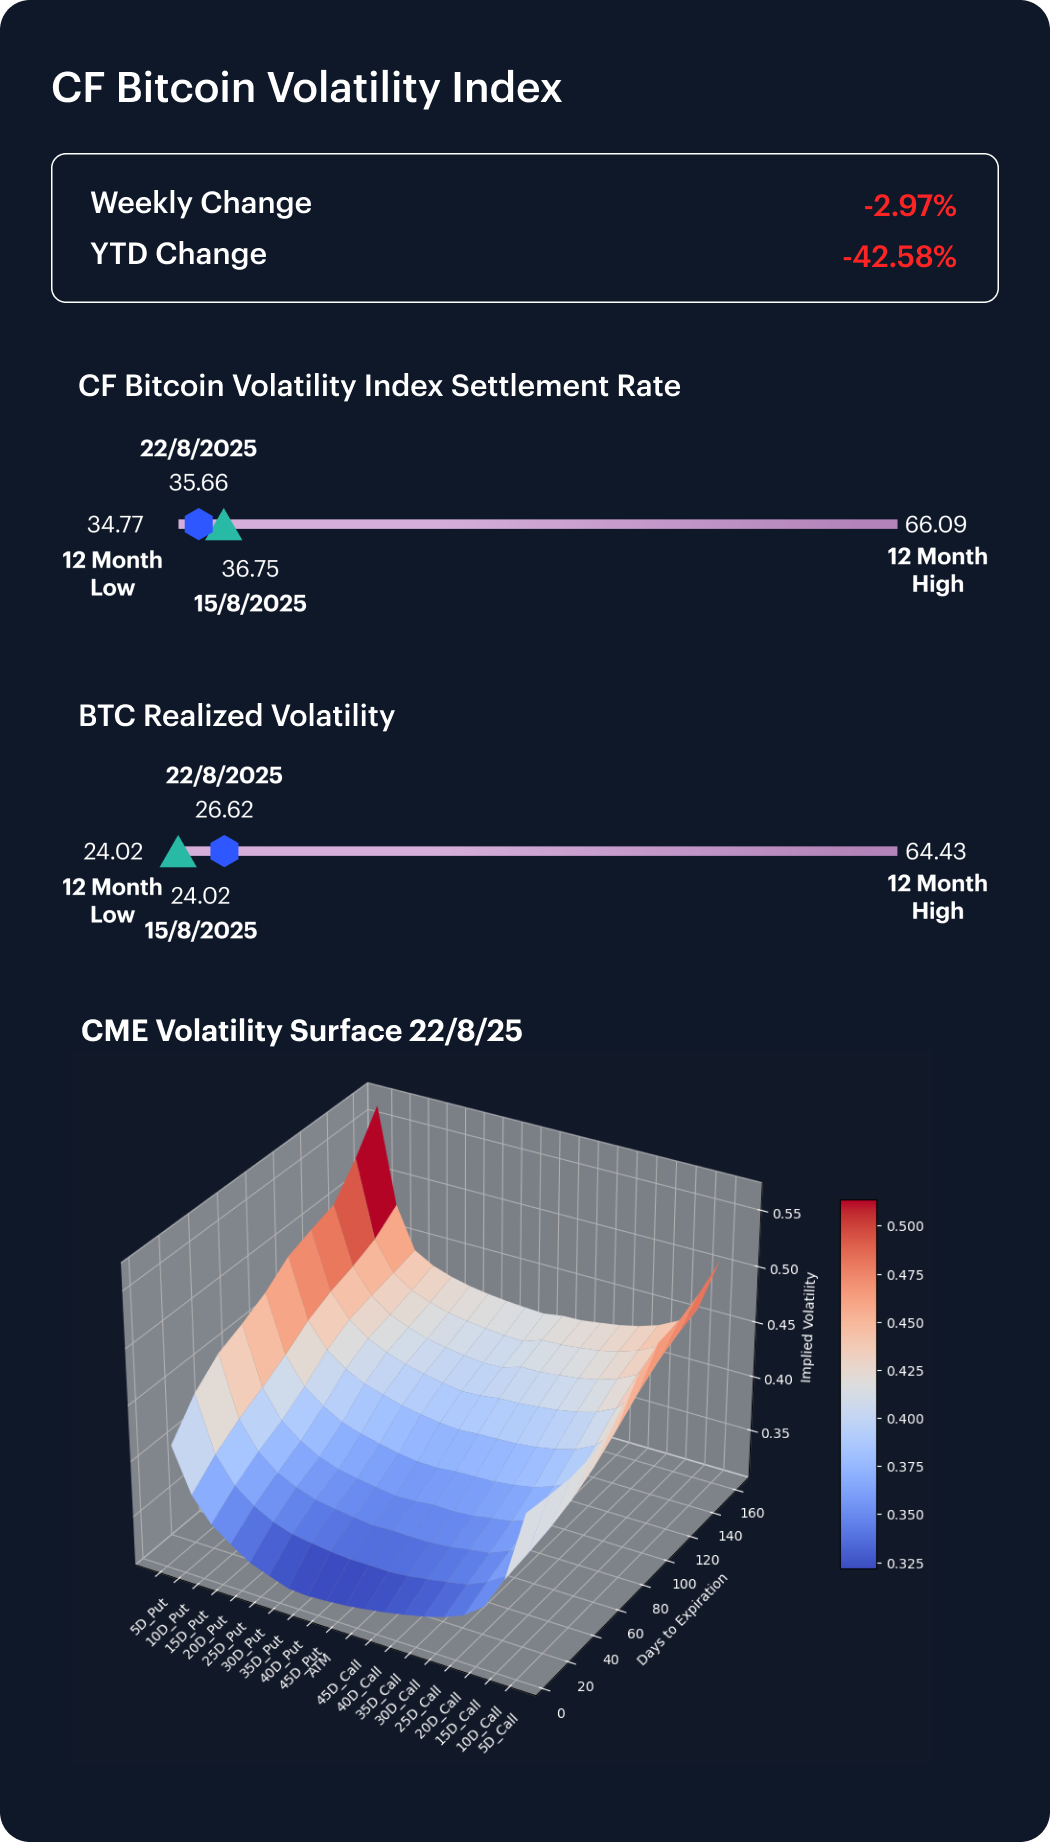
Volatility
The CF Bitcoin Volatility Index Settlement Rate (BVXS) slipped 2.97% last week, easing from 36.75 to 35.66, and now sits 42.58% below its January level despite holding above its 12-month low of 34.77. Realized volatility ticked higher, rising to 26.62 from 24.02 a week earlier, underscoring a reversal in the prior divergence between implied and spot measures. Beneath the surface, skew moved more deeply into negative territory, with downside protection commanding a premium as traders increased put demand. Convexity across maturities remains elevated, leaving near-term options relatively soft while longer expiries continue to price in heavier tail risks. The structure highlights persistent caution, with markets recalibrating for asymmetric downside amid subdued realized volatility.
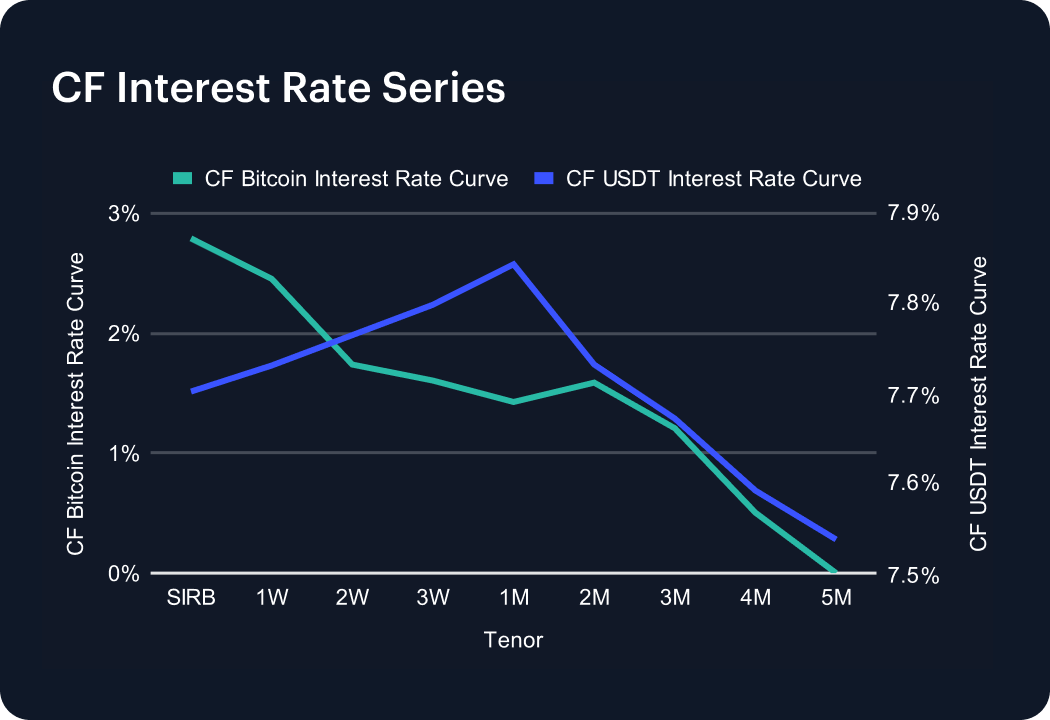
Interest Rate Analysis
USDT funding stayed elevated, with the curve holding between 7.70% and 7.84% across the front end before easing to 7.54% at five months. Compared with last week’s 8%+ levels, rates have edged lower, though the structure remains modestly downward-sloping. The persistence of such high prints reflects continued structural demand for stablecoin liquidity, even as borrowing costs cool slightly. The front-end premium underscores appetite for immediate USDT access, while the gentle softening further out suggests expectations for normalization. By contrast, the Bitcoin funding curve slipped further, flattening near zero beyond four months, reinforcing the differentiated role of stablecoins as leverage collateral.
The information contained within is for educational and informational purposes ONLY. It is not intended nor should it be considered an invitation or inducement to buy or sell any of the underlying instruments cited including but not limited to cryptoassets, financial instruments or any instruments that reference any index provided by CF Benchmarks Ltd. This communication is not intended to persuade or incite you to buy or sell security or securities noted within. Any commentary provided is the opinion of the author and should not be considered a personalised recommendation. Please contact your financial adviser or professional before making an investment decision.
Note: Some of the underlying instruments cited within this material may be restricted to certain customer categories in certain jurisdictions.
Changes to the Token Market Price Benchmarks Series - Market Prices – 21 July 2026
The Administrator has confirmed changes to the Token Market Price Family for the period 14 July 2026 to 21 July 2026.

CF Benchmarks
Softer CPI Reprices July Hike Risk & Lifts Digital Assets
Digital assets extended their recovery over the past week as cooler US inflation prints repriced Fed expectations; the bid was broad across the large cap indices, growth factor leadership returned, stablecoin funding repriced lower, and stress stayed isolated in names hit by token-specific news.
Mark Pilipczuk
Notice of the Demising of CF Dai-Dollar Settlement Price and Spot Rate
The Administrator announces that it will demise the CF Dai-Dollar Settlement Price (DAIUSD_RR) and CF Dai-Dollar Spot Rate (DAIUSD_RTI) which are members of the CF Digital Asset Index Family.
CF Benchmarks
By clicking Accept, you consent to CF Benchmarks's use of cookies.
Visit Cookie Settings to learn how CF Benchmarks uses cookies and to adjust your preferences.