
May 02, 2025
Tariffs, Turbulence, and Bitcoin Divergence
Key takeaways for the month
- Tariffs Spark Volatility, Bitcoin Stands Tall: Crypto markets faced renewed volatility in April following Trump’s April 2 tariff announcements, which sharply raised effective import duties from 4.3% to approximately 20.5%. Traditional markets initially reacted negatively, with the S&P 500 and Nasdaq briefly entering bear market territory, while the 10-year Treasury yield rose as inflation concerns mounted. Following a 90-day pause and further escalation with China, markets began to recover as investors reassessed policy developments. Despite elevated macro uncertainty, Bitcoin gained 14.8% and attracted approximately $2.2 billion in ETF inflows, reinforcing its role as a macro hedge and store of value in uncertain times.
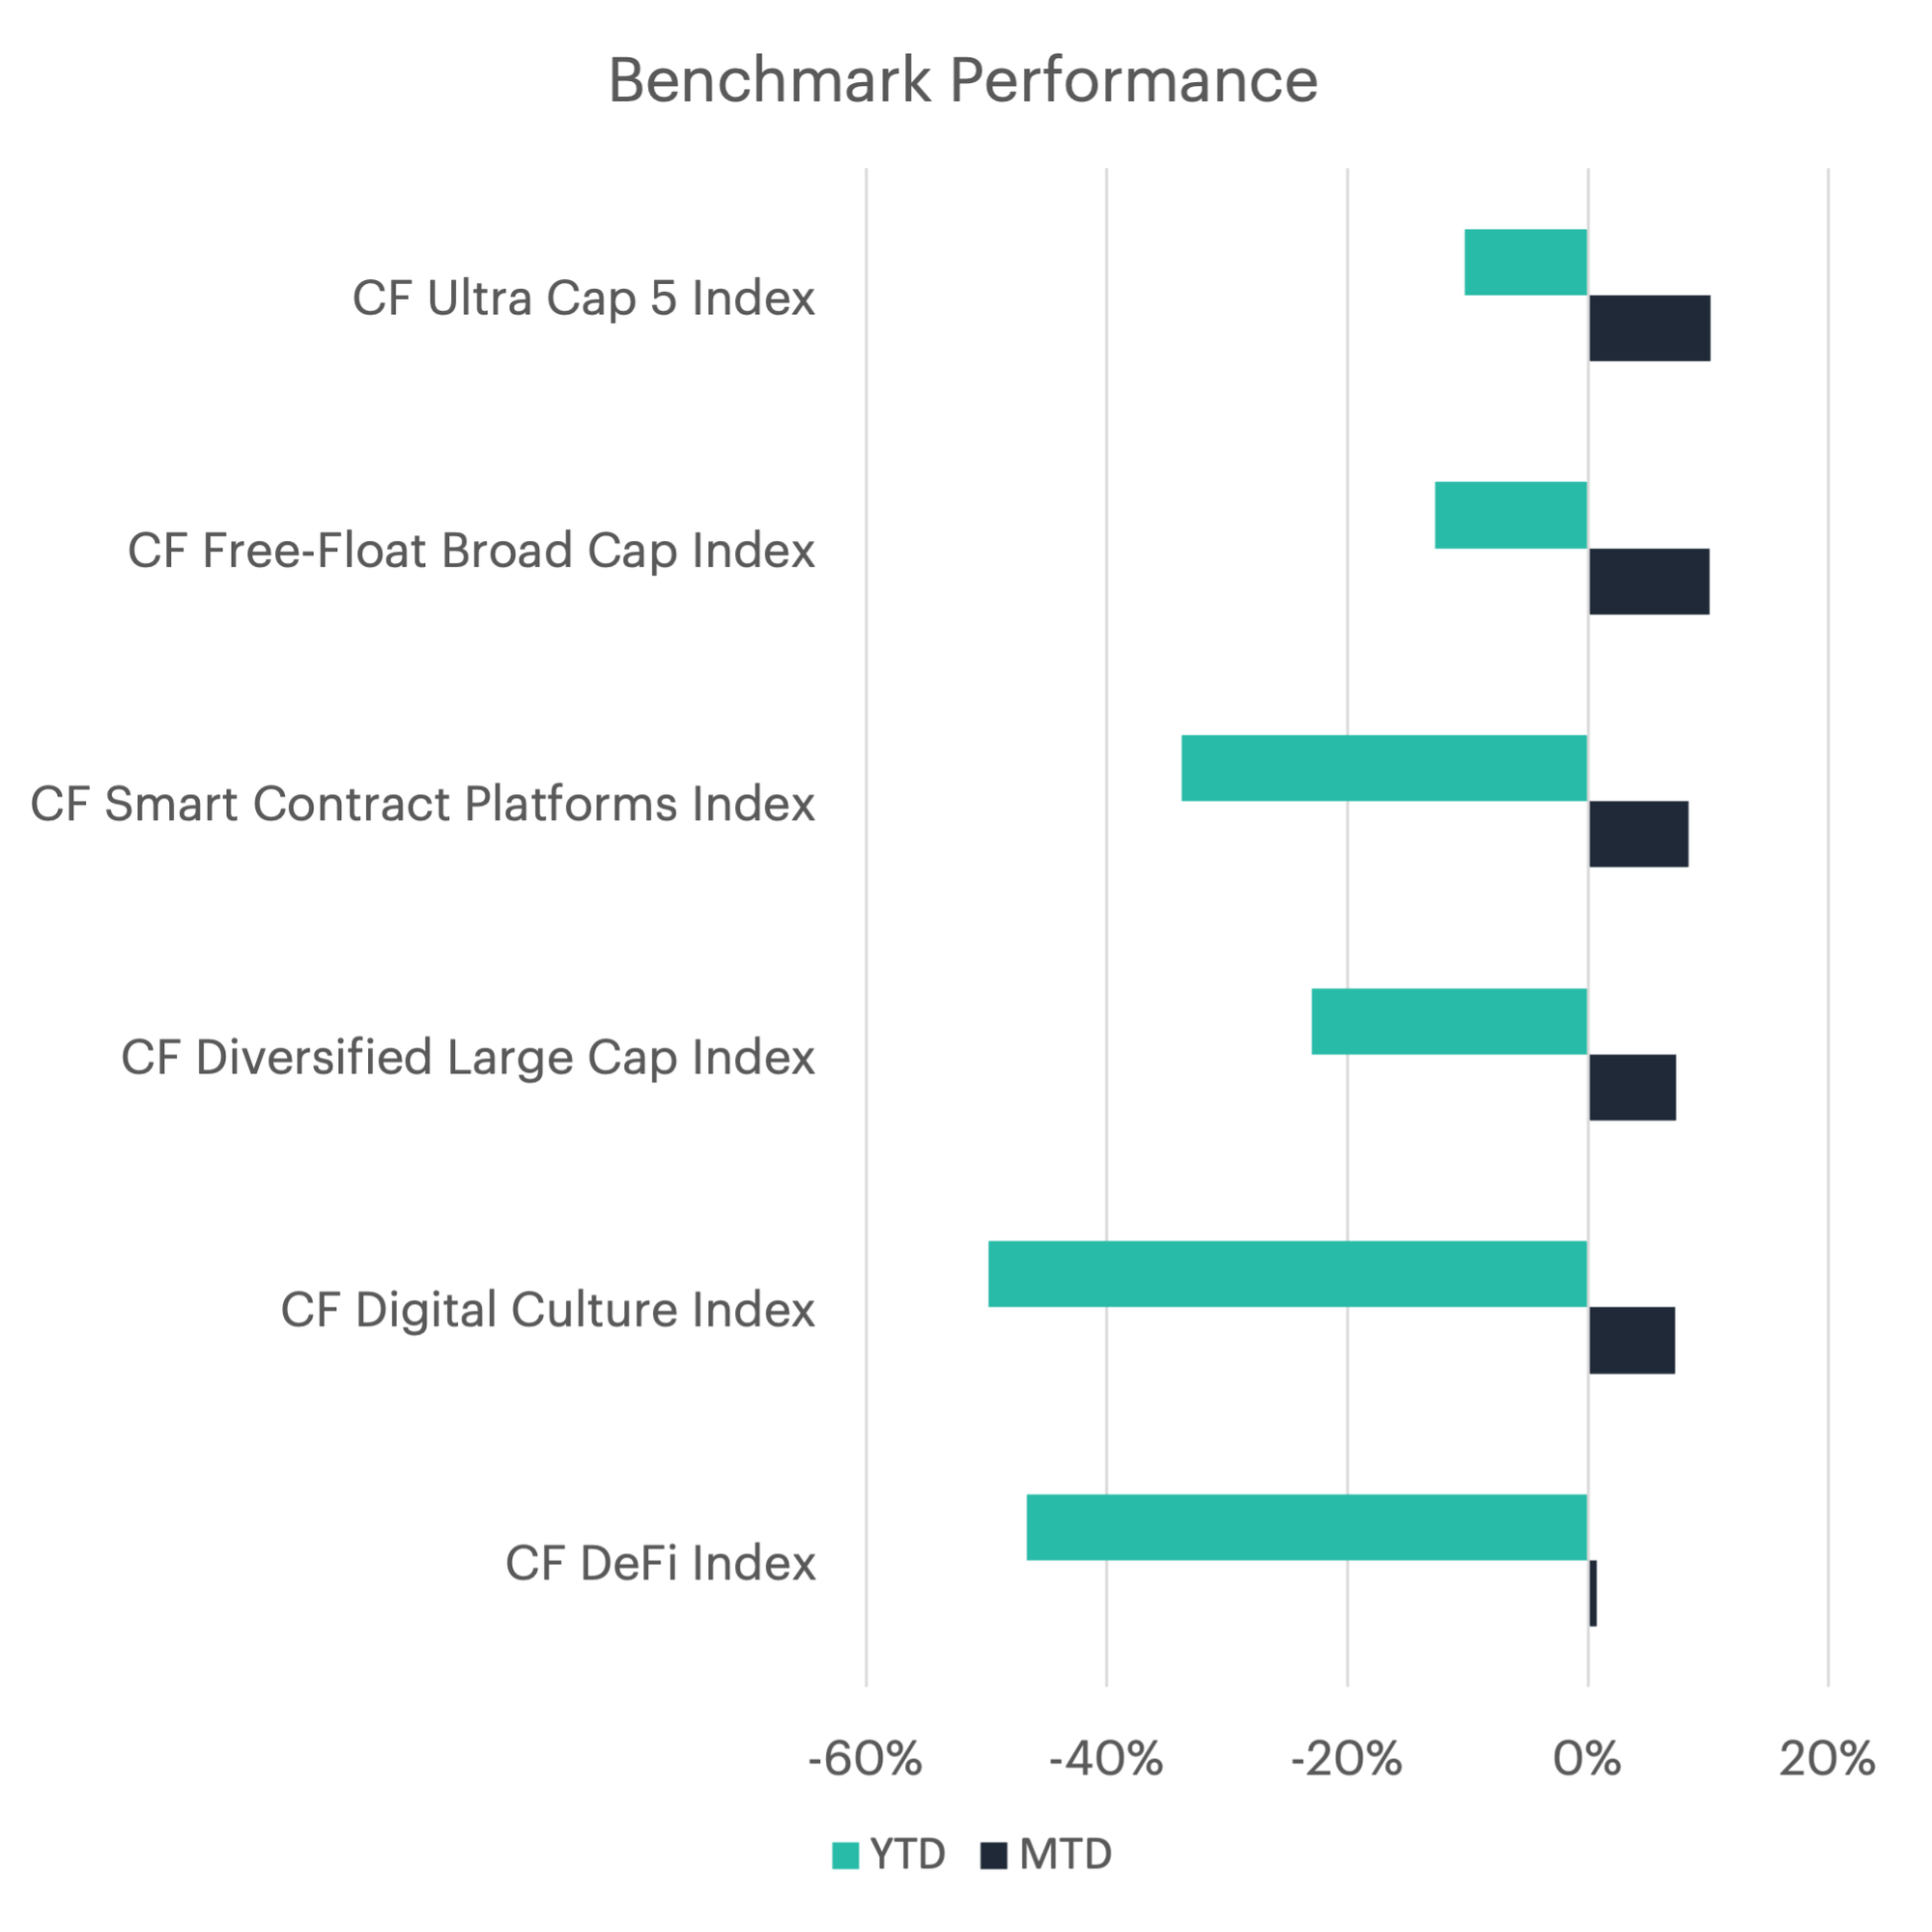
- Large-Cap Leadership Continues: The CF Ultra Cap 5 Index led performance, gaining 10.19% and trimming its year-to-date loss to 10.24%. The CF Free-Float Broad Cap Index followed, up 10.10% (YTD -12.72%), while the CF Smart Contract Platforms Index rose 8.40% (YTD -33.77%). The CF Diversified Large Cap Index advanced 7.32% (YTD -22.95%). Sector-specific indicies lagged, with the CF Digital Culture Index rising 7.25% (YTD -49.82%) and the CF DeFi Index edging up just 0.71% (YTD -46.63%). Investors clearly favored large-cap, established tokens over more speculative or niche plays.
- CRV, SNX & STX Outperform: Curve DAO surged 41.9% on the back of expanded crvUSD mint-market approvals. Synthetix followed closely with a 40.4% gain, driven by the launch of V3 pools enabling new on-chain derivatives liquidity. Stacks added 34.2% amid growing optimism around its high-throughput Nakamoto upgrade. On the downside, Tezos slid 15.4% as sentiment soured and development delays weighed. Uniswap lost 11.2% as regulatory optimism continued to wane. Internet Computer fell 7.5%, pressured by inflation worries and internal governance tensions within the Dfinity community.
- Funds Attract $2.5 Billion as Inflows Resume: April marked the first month of inflows into digital asset funds following a period of sustained redemptions. Investors allocated approximately $2.5 billion, with Bitcoin drawing $2.3 billion and Ethereum seeing a more modest $72 million. Regionally, inflows were concentrated in North America, which brought in a net $2.6 billion, while Europe recorded $116 million in capital inflows. The reversal in fund flows signals renewed institutional interest, especially in Bitcoin, amid shifting macro conditions.
- Bitcoin Futures Sentiment Shifts Amid Lower Open Interest: Net sentiment positioning in Bitcoin turned negative in April, with short positions outnumbering longs. Net futures positioning on the CME dropped to -194 contracts, down from 29 in March. Open interest in CME Ether futures also declined, falling 18% month-over-month, while Bitcoin futures open interest slipped by 2.9%.
- Hash Rate Rises Sharply, Putting Pressure on Miners: Bitcoin’s average monthly hash rate jumped 11.1% in April to reach 710 exahashes per second. Mining difficulty increased by 8.3% over the same period, reflecting the network’s adjustment to elevated hash power. However, the next difficulty adjustment, expected in the first week of May, is currently trending toward a 5.7% decrease.
- Ethereum and Solana Fees Drop on Lower On-Chain Activity: Ethereum network fees dropped by 36.6% in April to $14.8 million, as the average fee per interaction fell 30.2%. This points to a decline not only in cost per transaction but also in overall activity. Solana experienced a 17.8% decrease in total fees, reaching $21.0 million. MEV accounted for 21.9% of Solana’s fees, suggesting lower block space demand and subdued speculative activity on-chain.
To read the complete report, kindly click on the provided link (or click here to view a PDF version). Additionally, please do not forget to subscribe to our latest news and research for the most relevant institutional insights on digital assets and the top digital assets by market cap.
The information contained within is for educational and informational purposes ONLY. It is not intended nor should it be considered an invitation or inducement to buy or sell any of the underlying instruments cited including but not limited to cryptoassets, financial instruments or any instruments that reference any index provided by CF Benchmarks Ltd. This communication is not intended to persuade or incite you to buy or sell security or securities noted within. Any commentary provided is the opinion of the author and should not be considered a personalised recommendation. Please contact your financial adviser or professional before making an investment decision.
Note: Some of the underlying instruments cited within this material may be restricted to certain customer categories in certain jurisdictions.
Factor Friday - July 10, 2026
The relief rally extended for a second week with Market +2.27%, but the real story is risk appetite: Liquidity led styles at +1.51% as thinner, less liquid names caught a bid. Value paused at -0.79% yet still leads over four weeks. Defensive tilts kept unwinding into the bounce.

Mark Pilipczuk
2026 Mid-Year Market Outlook
Iran risk, regulatory policy, Bitcoin rebalancing, tokenization, and protocol revenue are reshaping the outlook. Growth is narrowing, but regulatory progress and productive on-chain activity create offsets. Dispersion, not broad beta, should define the next year.
Gabriel Selby
Changes to the Token Market Price Benchmarks Series - Market Prices – 07 July 2026
The Administrator has confirmed changes to the Token Market Price Family for the period 30 June 2026 to 07 July 2026.
CF Benchmarks
By clicking Accept, you consent to CF Benchmarks's use of cookies.
Visit Cookie Settings to learn how CF Benchmarks uses cookies and to adjust your preferences.