
Sep 01, 2025
Smart Contract and DeFi Tokens Lead Amid Mixed Macro Influences
Key takeaways for the month
In August 2025, digital asset indices gave up earlier monthly gains as the latest PCE data confirmed reaccelerating pricing pressures, triggering a broader sell-off despite surprisingly dovish remarks from Jerome Powell at the Fed’s annual Jackson Hole Symposium. Spot Bitcoin ETFs posted their first monthly outflow since March as investors rotated into Ether. CME's XRP futures surged past $1 billion in open interest, becoming the fastest digital asset contract to hit that threshold and demonstrating broader institutional demand for digital asset exposure beyond Bitcoin and Ether. While Bitcoin performance has been negative during this period, overall price volatility remains at historically low levels, suggesting deepening maturation and a potential market structure shift.
Smart Money Finds Smart Contracts: The CF Smart Contract Platforms Index led August's gains, rising 6.49% month-to-date while improving its year-to-date return to -5.94%. The CF DeFi Index also posted strong gains of 4.65% (YTD -11.96%), followed by the CF Diversified Large Cap Index, which advanced 0.96% (YTD +10.83%), and the CF Digital Culture Index, rising 0.94% (YTD -41.05%). However, mega-cap segments faced headwinds as the CF Free-Float Broad Cap Index declined 3.91% despite maintaining positive YTD performance of +12.28%, while the CF Ultra Cap 5 Index fell 4.01% (YTD +15.83%). August's performance demonstrated renewed appetite for smart contract platforms and DeFi protocols, contrasting with weakness in broader market and ultra-cap exposures amid the month's volatility.
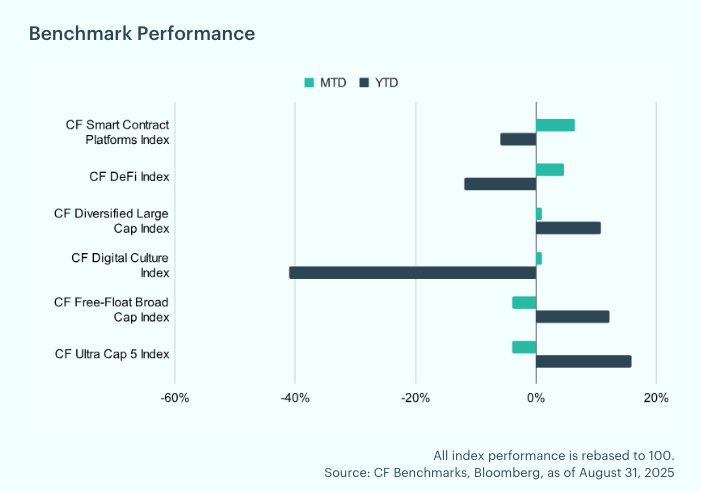
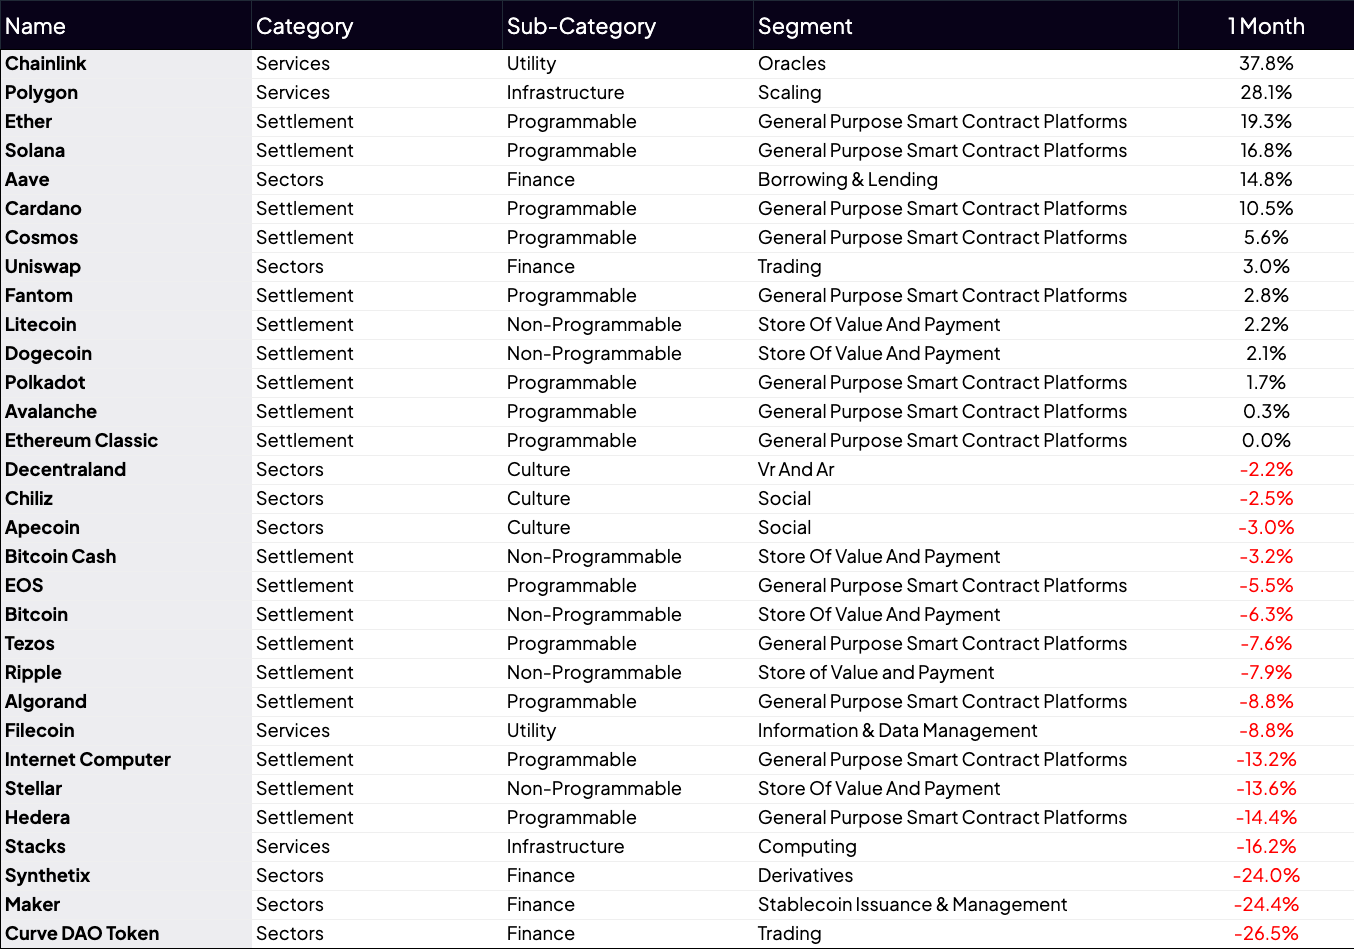
Individual Movers: The CF Smart Contract Platforms Index led August's gains, rising 6.49% month-to-date while improving its year-to-date return to -5.94%. The CF DeFi Index also posted strong gains of 4.65% (YTD -11.96%), followed by the CF Diversified Large Cap Index, which advanced 0.96% (YTD +10.83%), and the CF Digital Culture Index, rising 0.94% (YTD -41.05%). However, mega-cap segments faced headwinds as the CF Free-Float Broad Cap Index declined 3.91% despite maintaining positive YTD performance of +12.28%, while the CF Ultra Cap 5 Index fell 4.01% (YTD +15.83%). August's performance demonstrated renewed appetite for smart contract platforms and DeFi protocols, contrasting with weakness in broader market and ultra-cap exposures amid the month's volatility.
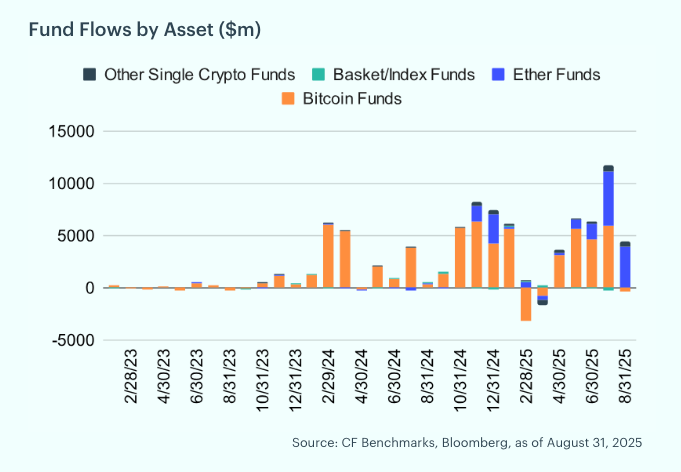
Ether's Moment in the Spotlight: August saw continued inflows into digital asset funds, with investors allocating approximately $4.2 billion. Strikingly, Ether captured $3.9 billion of that total, indicative of a potential rotation into Ethereum at the expense of Bitcoin, which recorded $322 million in outflows. Regionally, North America dominated flows with a net inflow of about $6.1 billion, while Europe posted modest outflows of around $161 million, highlighting the relative strength of U.S. investor demand.
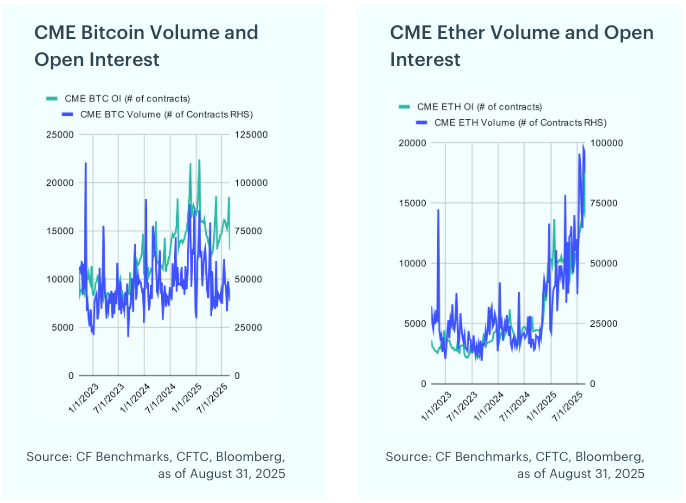
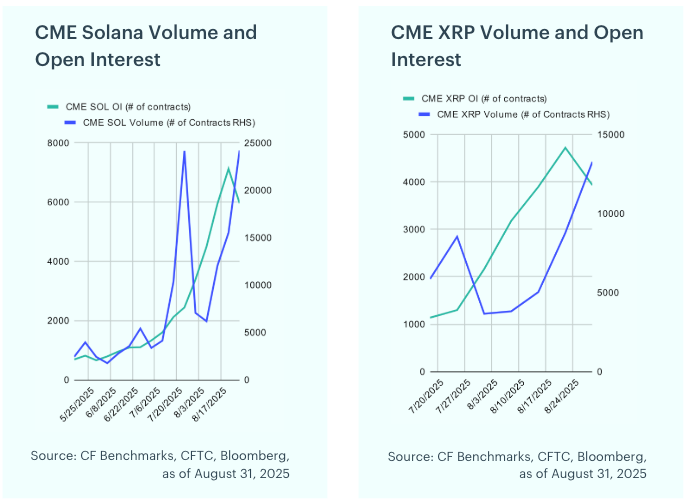
CME XRP Open Interest Crosses into Ten-Figure Territory: Bitcoin futures experienced a slight pullback in August, with open interest falling 18.7% from 16,053 to 13,501 contracts. In contrast, Ether futures showed positive momentum, with open interest rising 6.9% to a record 13,783 contracts, supported by robust trading activity that peaked at 97,835 contracts mid-month. Meanwhile, Solana and XRP futures saw substantial expansion amid heightened investor interest: Solana’s open interest surged 76.1% to 5,965 contracts, with volumes spiking to over 24,000 contracts, while XRP’s open interest jumped 81.8% to 3,932 contracts, accompanied by a significant increase in trading volumes.
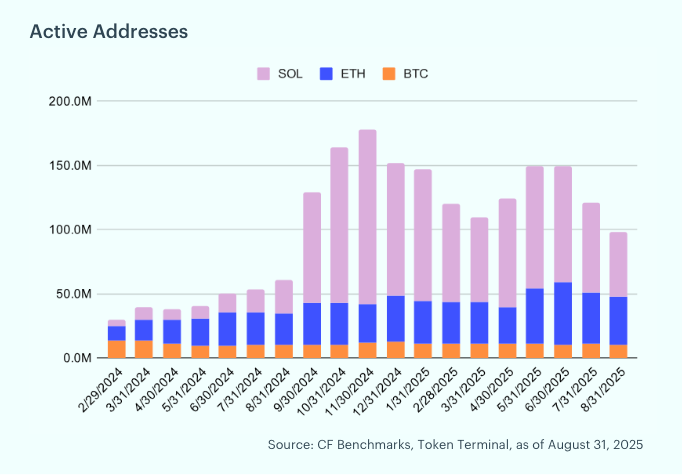
BTC's Network Activity Stays Steady as SOL fades: Bitcoin’s active addresses in August declined modestly to 10.5 million from 10.8 million in June (-2.7%), signaling steady network activity. Ethereum saw a sharper pullback, with active addresses falling from 49.7 million to 39.8 million (-7.4%), reflecting weaker on-chain engagement. Solana experienced the steepest drop, as active addresses declined from 70.0 million to 50.0 million (-28.5%).
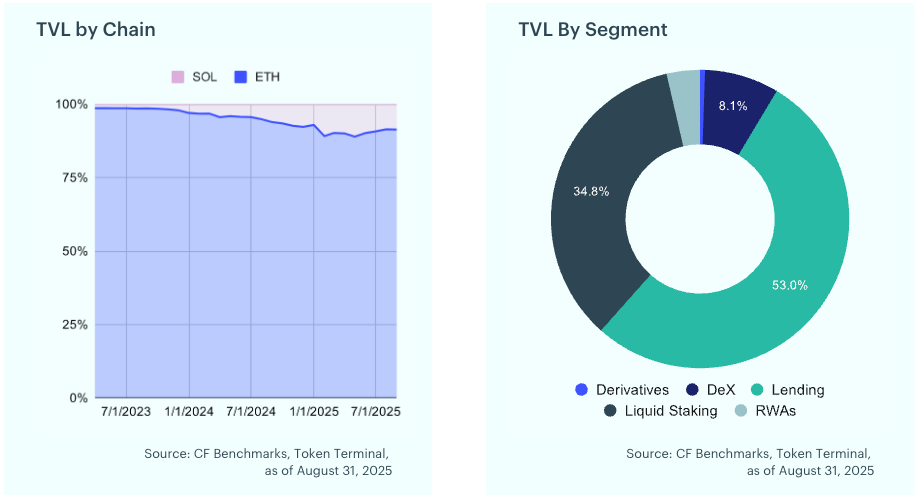
DeFi's Locked and Loaded: Total Value Locked (TVL) in DeFi represents the total amount of assets deposited in decentralized finance protocols, expressed in USD. It serves as a key metric to gauge the health and growth of the DeFi ecosystem. Over the past month, TVL in DeFi protocols grew by 12.4%, reaching approximately $389 billion. This increase was primarily driven by growth in liquidity pools on decentralized exchanges.
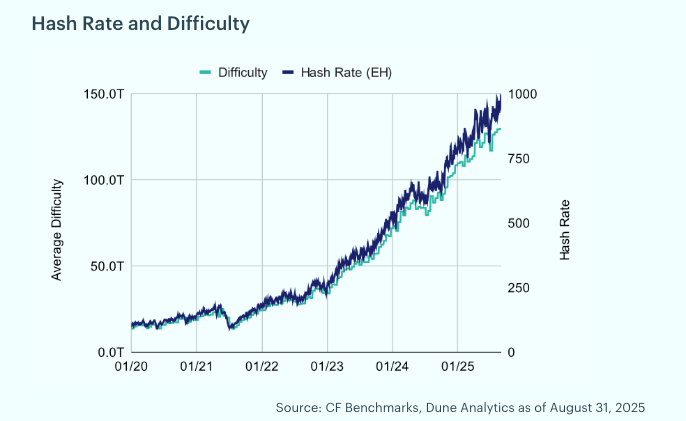
Mining Upadate: Bitcoin’s hash rate grew slightly in August, rising 7.9% to 970 exahashes per second. Mining difficulty, which measures the computational effort required to mine a new block and adjusts to maintain consistent block creation times, increased by 1.6% after a period of faster block times in late August. The next difficulty adjustment, expected in the first week of September, is currently projected to be a 5.4% increase. Bitcoin miners saw a 0.04% increase in revenue in August. Of the total rewards earned during the month, 0.7% came from transaction fees, down from 1.0% in July. The modest growth in revenue was driven primarily by Bitcoin’s price movements during the period.
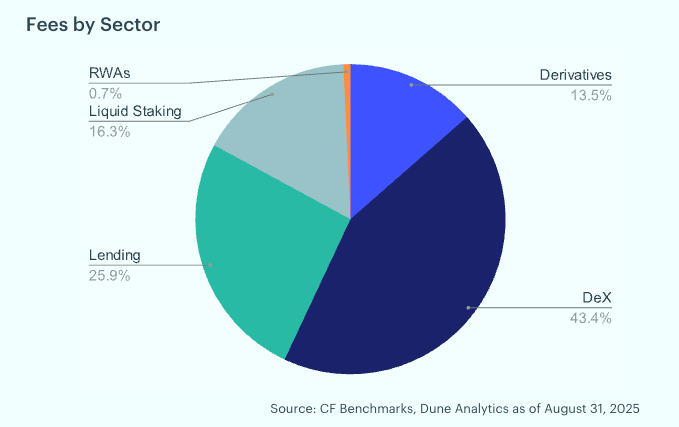
DEXs Still Rule the Ethereum's Fee Factory: Examining Ethereum’s total fees and their sector breakdown provides insight into which use cases are driving network revenue. Ethereum layer-1 fees fell 20.0% month-over-month to $39.8 million in August, down from $49.7 million in June, marking the first decline in three months. Decentralized exchanges led revenue generation at 43.4%, followed by lending protocols at 25.9% and liquid staking at 16.3%. Derivatives contributed 13.5%, while real-world asset tokenization accounted for just 0.7%, underscoring the dominance of DEX activity in driving fee revenue.
To read the complete report, kindly click on the provided link (or click here to view a PDF version). Additionally, please do not forget to subscribe to our latest news and research for the most relevant institutional insights on digital assets and the top digital assets by market cap.
The information contained within is for educational and informational purposes ONLY. It is not intended nor should it be considered an invitation or inducement to buy or sell any of the underlying instruments cited including but not limited to cryptoassets, financial instruments or any instruments that reference any index provided by CF Benchmarks Ltd. This communication is not intended to persuade or incite you to buy or sell security or securities noted within. Any commentary provided is the opinion of the author and should not be considered a personalised recommendation. Please contact your financial adviser or professional before making an investment decision.
Note: Some of the underlying instruments cited within this material may be restricted to certain customer categories in certain jurisdictions.
Changes to the Token Market Price Benchmarks Series - Market Prices – 21 July 2026
The Administrator has confirmed changes to the Token Market Price Family for the period 14 July 2026 to 21 July 2026.

CF Benchmarks
Softer CPI Reprices July Hike Risk & Lifts Digital Assets
Digital assets extended their recovery over the past week as cooler US inflation prints repriced Fed expectations; the bid was broad across the large cap indices, growth factor leadership returned, stablecoin funding repriced lower, and stress stayed isolated in names hit by token-specific news.
Mark Pilipczuk
Notice of the Demising of CF Dai-Dollar Settlement Price and Spot Rate
The Administrator announces that it will demise the CF Dai-Dollar Settlement Price (DAIUSD_RR) and CF Dai-Dollar Spot Rate (DAIUSD_RTI) which are members of the CF Digital Asset Index Family.
CF Benchmarks
By clicking Accept, you consent to CF Benchmarks's use of cookies.
Visit Cookie Settings to learn how CF Benchmarks uses cookies and to adjust your preferences.