
Oct 02, 2025
Rate Cuts & Regulatory Clarity: From Red Tape to Greenlights
Executive Summary
Crypto markets are entering a new phase where regulatory clarity and monetary easing are beginning to outweigh macro headwinds. The GENIUS Act established federal oversight of USD-backed stablecoins, driving nearly $30 billion of inflows into the ecosystem since its passage. We anticipate that stablecoin AUM will reach $350 billion by year-end and $500 billion in 2026. At the same time, the SEC’s approval of generic listing standards for commodity ETFs should accelerate the ETF pipeline, with the number of spot-crypto funds expected to double by year-end. We anticipate that these new ETFs will attract a fresh wave of capital into the digital assets. At the same time the Fed has begun easing, cutting rates for the first time in nine months and signaling further reductions into 2025. Broader monetary conditions point to a dovish tilt as labor market slack builds and fiscal deficits remain elevated, reinforcing our expectations for a prolonged easing cycle. Against this backdrop, Bitcoin is well positioned as a hedge against fiat debasement.
Market Recap: ETF Tailwinds, Macro Headwinds, and Regulatory Clarity
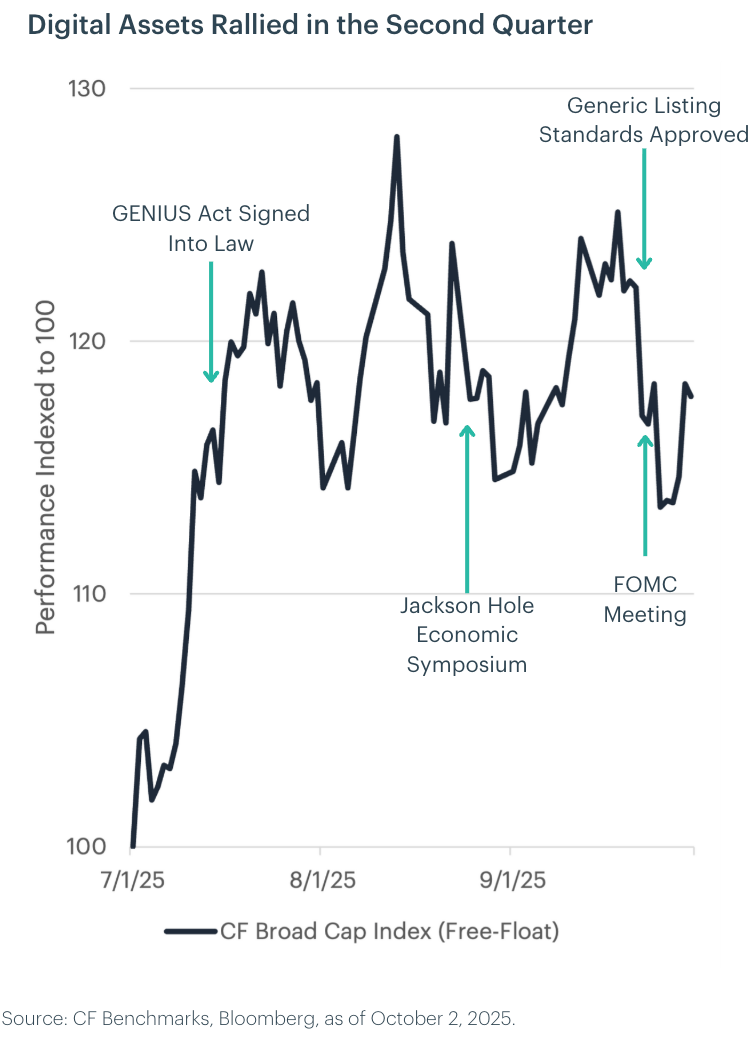
Digital assets rode into Q3 on the back of significant policy momentum and robust capital flows, and July set the tone. CME Ether futures traded nearly $118 billion with open interest hitting an all-time high of $5.21 billion. Spot ETF flows told an even more compelling story, with Ether products pulling in $4.94 billion and Bitcoin another $5.36 billion. That pushed combined monthly inflows past $10 billion for the first time on record, representing the kind of institutional validation the market has been anticipating. The Fed held rates unchanged, but the more significant development was the regulatory shift. The SEC greenlit in-kind creations for spot crypto ETFs and rolled out clearer listing standards. Combined with the GENIUS Act signing and the White House's crypto roadmap, the policy backdrop turned notably more constructive.
August flipped the script entirely. Hotter than expected PCE inflation prints rattled markets and erased early gains, even with Powell adopting a measured tone at Jackson Hole. The first net outflow from spot Bitcoin ETFs since March marked a shift worth monitoring, with capital rotating into Ether instead. The other notable development was CME's XRP futures crossing $1 billion in open interest, evidence that institutions are moving beyond Bitcoin and Ethereum in a meaningful way. Prices softened across the board, but realized volatility stayed remarkably muted. That kind of stability during a drawdown signals continued market structure maturation.
September broke its usual seasonal weakness, and the Fed's 25 basis point cut to 4.00 to 4.25 percent was the headline. The committee framed it around labor market concerns rather than declaring victory on inflation, and the guidance stayed appropriately cautious. More significant was the SEC approving generic listing standards for commodity-based trust shares, essentially clearing the runway for a broader slate of crypto ETPs beyond just Bitcoin and Ethereum. This should accelerate product development across the space. CME reinforced that theme by scheduling October launches for Solana and XRP futures options, expanding the institutional toolkit for hedging exposure in emerging tokens. Trading was choppy through the month, but digital asset funds continued to attract capital despite the noise, with inflows around $3.8 billion. Demand picked up noticeably after the FOMC meeting as attention cycled back to Bitcoin, suggesting the narrative is stabilizing heading into year end.
Measuring Growth: Resilience Offsets Tariff Drag, but Risks Are Mounting
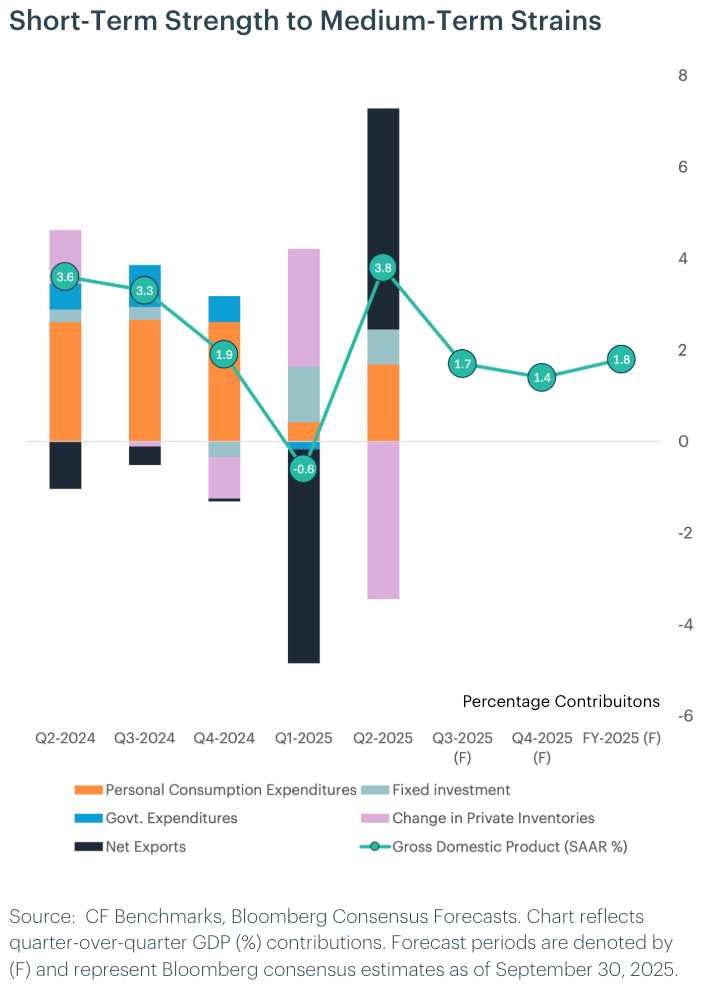
The U.S. economy is showing more momentum than expected heading into late 2025. Revisions to Q2 GDP revealed growth at an annualized 3.8%, stronger than earlier estimates, driven by robust services consumption and trade dynamics. Early Q3 data point to real consumer spending rising at a 2.8% annualized pace, with August posting broad-based gains across services, nondurables, and durables. This rotation toward services highlights household resilience, partly supported by stock-market wealth effects and government transfers. Still, tariffs remain a headwind: consumers are shifting away from tariff-exposed goods, and corporate profits are set to weaken as supply-chain firms absorb higher input costs.
Despite near-term strength, structural risks are intensifying. The labor market is softening, with job growth barely meeting the breakeven pace needed to hold unemployment steady. Fiscal uncertainty and the ongoing drag from tariffs are weighing on business confidence and could start hurting profit margins, limiting investment appetite. While consumer demand is still powering GDP, the personal saving rate has fallen to 4.6%, underscoring stretched household budgets. With disinflation momentum stalling and services inflation sticky, the Fed faces a delicate balance between supporting growth and containing prices.
The key risk into year-end is that consumer strength fades as household balance sheets weaken under higher costs and limited savings. Tariff-related distortions may continue to weigh on profits and investment, raising questions about the durability of current momentum. If consumption slows meaningfully, the economy could align more closely with its softer long-term growth trajectory, leaving the Fed with little margin to stabilize both inflation and employment.
Portfolio Perspective: We maintain a structurally cautious stance on U.S. growth over the next 12 months. While upward revisions to Q2 GDP and stronger Q3 spending demonstrate near-term resilience, this momentum rests on stretched household budgets, a declining savings rate, and weakening corporate profits as tariffs erode margins. We expect real GDP growth to slow below 2%, keeping our outlook aligned with consensus. Though long-term opportunities in innovation remain compelling, near-term focus should center on secular themes such as digital assets and artificial intelligence, where technological disruption and regulatory tailwinds may provide crucial sources of scarce growth. Assets like Bitcoin may benefit from increased adoption as a hedge against geopolitical risk and currency debasement.
Measuring Inflation: Tariff Pass-Through Appears to Be Peaking
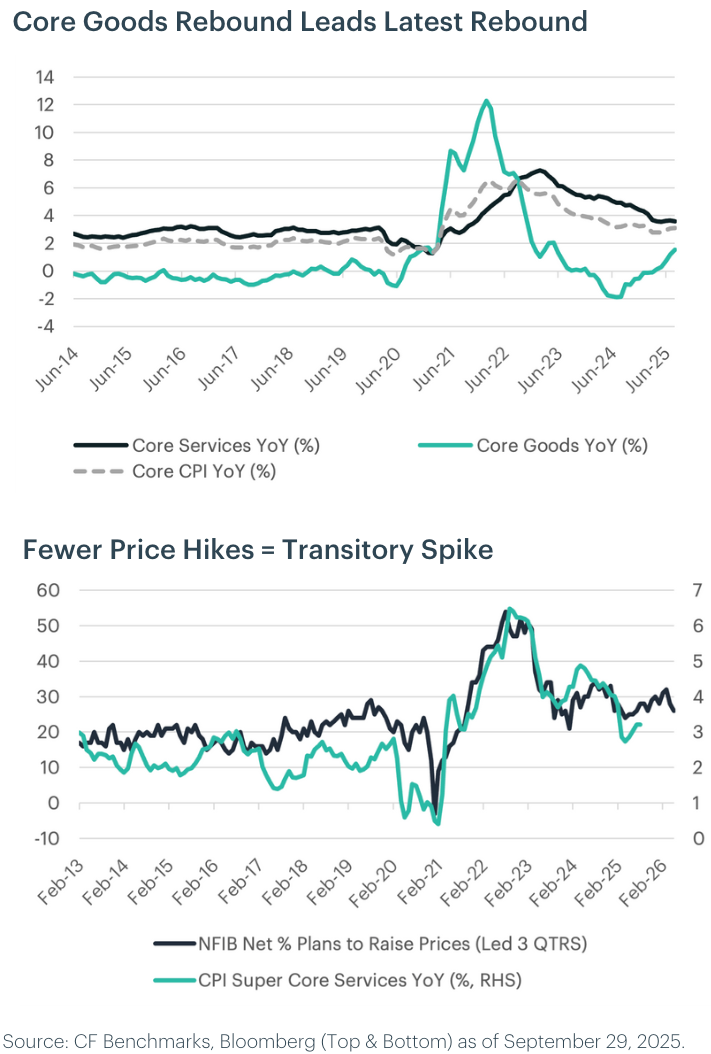
Recent data show headline and core CPI both accelerated in recent months, with the core index rising at its fastest pace since January. Service-sector strength was concentrated in categories such as airfares and lodging, while core goods inflation reaccelerated more sharply, driven by increases in used- and new-vehicle prices as model-year updates fed into official calculations. Though goods carry a smaller weight in the CPI basket, the combination of goods and services pressures highlights that, even as structural disinflation persists in areas like shelter and medical care, underlying inflation remains sticky in the near term.
Despite firmer inflation prints, tariff pass-through to consumer prices appears to be fading. Goods categories facing earlier tariff hikes, such as apparel and auto parts, showed more moderate cost transmission in August, or even outright disinflation. Surveys also indicate fewer firms plan to raise prices, suggesting businesses are absorbing higher import costs by cutting margins and drawing down inventories. We therefore suspect the tariff impulse may soon be peaking, even as headline measures remain elevated from services and transport. Still, the risk of renewed goods inflation cannot be dismissed if demand firms or a second wave of tariffs materializes.
On balance, we continue to expect average core CPI inflation to settle at approximately 3.0% in then next 12 months. Near-term risks remain to the upside, as volatile categories like vehicles, airfares, and commodities could briefly push inflation higher. We see these as transitory moves driven by base effects and temporary frictions. Core services disinflation, especially in housing, should continue to moderate, supporting the path back toward a more sustainable path.
Portfolio Perspective: The inflation outlook remains mixed. Recent CPI prints show renewed pressure from core goods, particularly vehicles, and select services such as travel and lodging. Yet surveys indicate fewer firms are planning price hikes, and tariff pass-through is already fading, suggesting much of the recent upside is likely transitory. Even so, sticky services mean the path back to 2% will be uneven and drawn out. For investors, this may create volatility in rate expectations as the Fed balances its dual mandate. Real assets, scarce assets with pricing power, and alternative stores of value such as Bitcoin and gold remain attractive hedges.
Measuring the Fed: Divided Committee, But Clearer Path Ahead
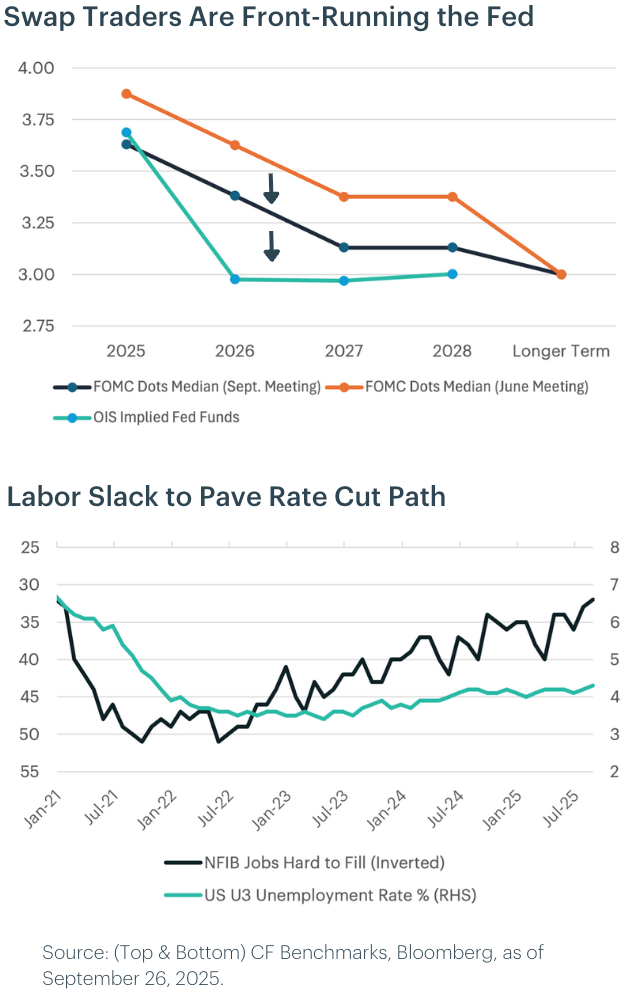
The September FOMC decision revealed growing divergence within the committee. While near-term policy direction remains clouded by internal disagreements, we believe a more decisive trajectory is taking shape over the medium term, one that points toward lower interest rates. This view is anchored by two key developments: the continued weakening in labor market data and emerging signs of increased executive branch influence over monetary policy. With the expected appointment of a "shadow Fed chair" ahead of Powell's May 2026 term expiry, we believe the Fed's reaction function is quietly evolving. Even absent formal leadership changes, political signaling is already shifting market expectations. In this context, we encourage investors to look beyond current committee divisions and focus instead on where policy is heading. In our view, the path is turning dovish.
We continue to expect two additional rate cuts in 2025 (one in October and another in December) driven by growing signs of labor market slack. Unemployment is rising, and fewer firms report hiring difficulties, supporting our long-held view of a slowdown. Markets are already pricing this in, with swap traders front-running the Fed and OIS-implied rates pointing to a more dovish path than the latest FOMC projections. If we experience unforeseen fiscal tightening or if trade disruptions worsen, further easing in early 2026 is likely.
Portfolio Perspective: The Fed's stance is becoming more politically sensitive and increasingly shaped by external pressures. Treasury issuance is expected to rise meaningfully following the passage of the recent tax and spending package. At the same time, longer-dated Treasury yields may become unanchored if inflation expectations rise or investor demand weakens. Should auction tails persist or real rates spike, the Fed may be forced to respond with unconventional tools to contain longer-end volatility, potentially including balance sheet reinvestment shifts or yield curve stabilization efforts.
For investors, this regime warrants positioning for financial repression and fiat currency debasement. Real assets and inflation-resilient strategies stand to benefit, particularly those tied to declining real yields and policy accommodation. Exposure to Bitcoin and publicly traded firms with Bitcoin on their balance sheets, particularly those with advantageous leverage and strong capital efficiency, may offer targeted upside in an environment defined by falling real yields, currency debasement, and heightened demand for alternative stores of value.
Measuring the Regulatory Environment: Generic Listing Standards are Bringing on Crypto’s Swensen Moment
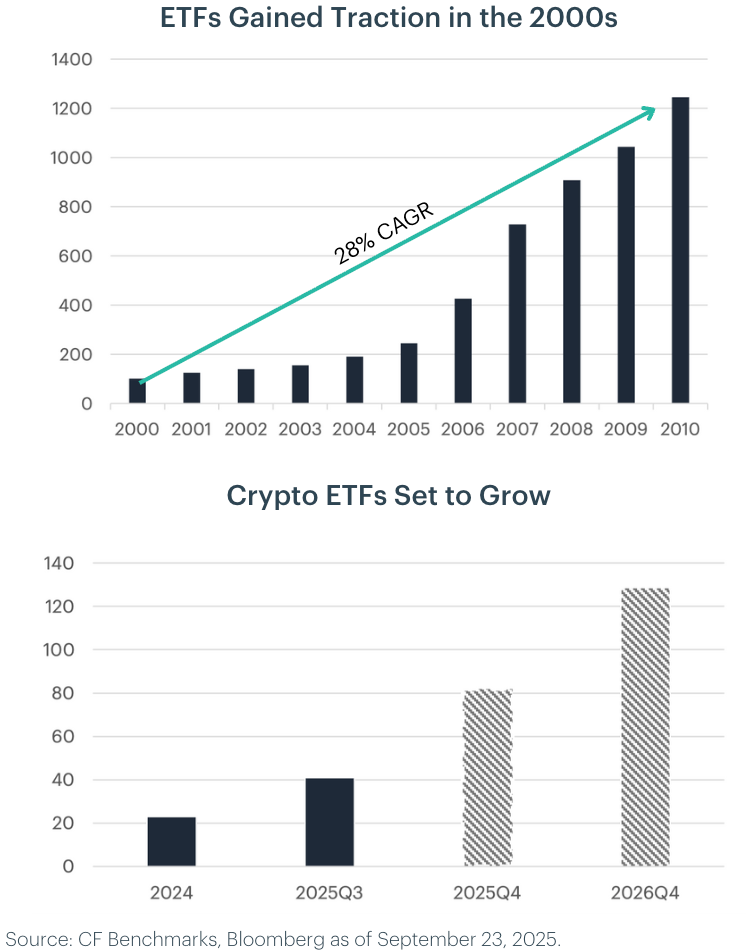
The SEC’s approval in September 2025 of generic listing standards for commodity-based ETPs, including digital assets, represents a structural catalyst comparable to the early 2000s developments that propelled ETFs into the mainstream. By allowing NYSE, Nasdaq, and Cboe to list qualifying crypto products without case-by-case Rule 19b-4 approvals, the rule compresses timelines, lowers frictions, and opens the door to a broader set of digital asset ETFs.
Looking back, between 2000 and 2010 regulators progressively enabled , ETF share-class relief (2000), active ETF guidance (2001), leveraged ETFs (2006), and the first listed active ETFs (2008). This regulatory evolution drove a material acceleration in adoption, with ETF counts increasing at an annualized 19% from 2000 to 2005 and 38% from 2005 to 2010. With the regulatory groundwork for a wide range of strategies already in place, we expect the crypto ETF market to bypass the slow growth phase that traditional ETFs experienced and transition directly into a high-growth environment.
Prior to the release of the exchange listing standards in September 2025 there were about 40 spot crypto products listed and nearly 100 outstanding filings. We anticipate that approvals in the fourth quarter will allow the number of live products to double to approximately 80 by year-end. Looking into 2026, we expect the market to go on to surpass 120 listed crypto ETFs, a pace of growth that is roughy double what we saw in the early 2000s ETF market.
The CLARITY Act advanced out of the House in July 2025 with bipartisan support, providing long-sought regulatory guardrails by dividing oversight between the SEC and CFTC. While the House version outlines rules for tokenized securities, digital commodities, and exchange registration, the bill now faces a tougher path in the Senate, where Banking and Agriculture Committees are drafting competing versions with different definitions and maturity criteria. Timelines have already slipped, and some expect the House text to stall, but we continue to see momentum toward compromise. Passage in early 2026 could unlock broader product launches and institutional participation in the second half of the year.
Portfolio Perspective: Regulatory clarity is likely to provide a significant tailwind for tokens beyond the majors. We anticipate that thematic indices such as the CF Web 3.0 Smart Contract Platform Index and the CF DeFi Composite Index will outperform indicies with a heavy weight towards Bitcoin and Ether.
Measuring Stablecoin Adoption: Stablecoins to Reach $500B in 2026
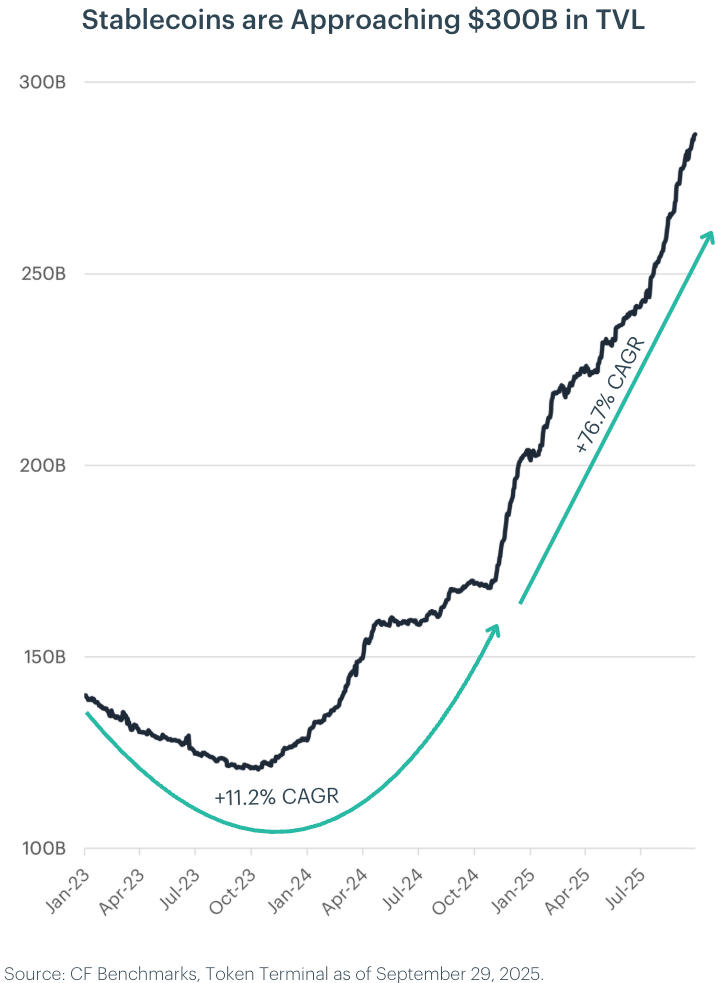
The passage of the GENIUS Act in July 2025 marked a watershed moment for the digital asset ecosystem, providing a comprehensive regulatory framework for stablecoin issuance. The legislation established clear reserve, disclosure, and licensing requirements, materially reducing regulatory uncertainty. Since its enactment, stablecoins have added approximately $30 billion in assets, underscoring strong latent demand for regulated digital dollars. This acceleration is particularly striking when viewed against the muted growth trajectory before regulatory clarity was on the horizon: from early 2023 through the November 2024 election, stablecoin assets under management (AUM) expanded at just an 11.2% compound annual growth rate (CAGR). In contrast, since the election, growth has surged to 76.7% on an annualized basis.
We believe this regulatory shift positions stablecoins for a sustained adoption cycle. Our base case is that stablecoin AUM will reach $350 billion by the end of 2025, with further expansion to $500 billion by year-end 2026. This growth is likely to be supported by a broadening set of institutional and fintech initiatives to embed stablecoins into existing financial infrastructure. Visa and Mastercard are extending stablecoin settlement rails globally, enabling merchant acceptance and cross-border payment use cases. PayPal, in partnership with Coinbase, is scaling PYUSD with consumer incentives and merchant settlement capabilities, while Circle and other issuers position regulated stablecoins as core treasury instruments. Meanwhile, leading banks are piloting tokenized deposits and interoperable on-chain settlement, normalizing stablecoin usage alongside traditional payment rails.
Portfolio Perspective: The largest smart contract platforms are positioned to benefit as regulatory clarity drives a new cycle of stablecoin adoption. This expansion directly enhances network utility and fee generation on Ethereum and Solana. As corporates, fintechs, and banks embed stablecoins into payment and treasury workflows, we expect indices with meaningful exposure to SOL and ETH, such as the CF Diversified Large Cap Index, to capture outsized gains.
GENIUS Act Sparks Stablecoin Shift
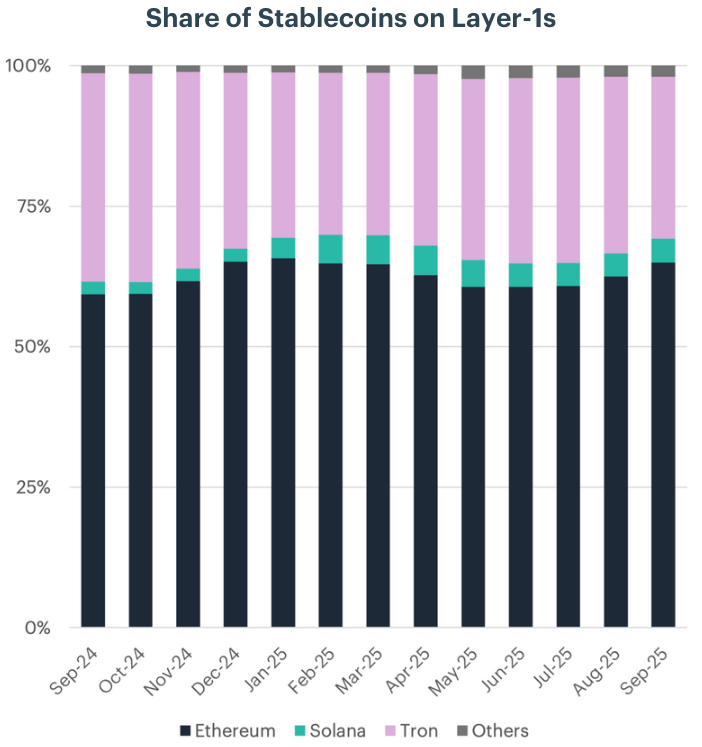
Since the start of 2025, the stablecoin landscape has undergone notable reshuffling. At the beginning of the year, the Ethereum and Solana ecosystems collectively accounted for roughly 68% of stablecoin market share. By June, that share had declined to a trough of 64.8%, driven by steady gains on Tron and other networks. However, since the passage of the GENIUS Act in July 2025, Ethereum and Solana have rebounded sharply, reaching 69.2% by September. This reversal reflects regulatory forces reshaping demand for stablecoin rails.
Several factors explain this renewed dominance. Regulatory clarity under the GENIUS Act gave institutions and enterprises the green light to deploy stablecoins, directing flows toward networks with stronger compliance profiles and institutional integrations. Ethereum, with its liquidity depth and concentration of issuance, benefited immediately through tokenization pilots and settlement platforms such as BlackRock's tokenized money market fund. Solana's cost and throughput advantages, reinforced by PayPal's PYUSD launch and Visa's settlement expansion, positioned it as a leading rail for payment-style flows. Both ecosystems also stand out for their robust infrastructure, active developer communities, and ability to support applications beyond simple transfers. This breadth provides resilience and confidence for enterprises and issuers seeking to scale in a regulated environment. In contrast, Tron's earlier growth, driven by USDT issuance and low-cost transfers, has stalled. The loss of USDC support and heightened U.S. regulatory scrutiny have limited its ability to capture new inflows. Smaller networks remain challenged as issuers and enterprises continue to concentrate liquidity where infrastructure is mature and regulatory risk is lower.
Over the next twelve months, the Ethereum and Solana ecosystems are well positioned to extend their gains. Barring major execution risks or regulatory shocks, their combined share of stablecoin TVL could climb toward 75% as enterprise adoption deepens and retail use cases continue to scale. At the same time, we expect the "others" category, currently around 1.9%, to expand meaningfully. Specialized chains such as Plasma, designed explicitly for stablecoin payments, and alternative layer-1s like Hyperliquid, with native fiat-backed instruments for trading ecosystems, are positioned to attract niche but fast-growing flows. If traction builds, this segment could grow to as much as 5% of the market over the same horizon.
Portfolio Perspective: Stablecoin adoption following the GENIUS Act is creating a structural tailwind for the layer-1 platforms that host these tokens. We expect constituents of the CF Web 3.0 Smart Contract Platforms Index to be key beneficiaries, as increased stablecoin activity supports network utility, transaction fee growth, and long-term value capture.
Measuring Tokenization: Equities are Likely to Become a Key Growth Driver for RWA Tokenization
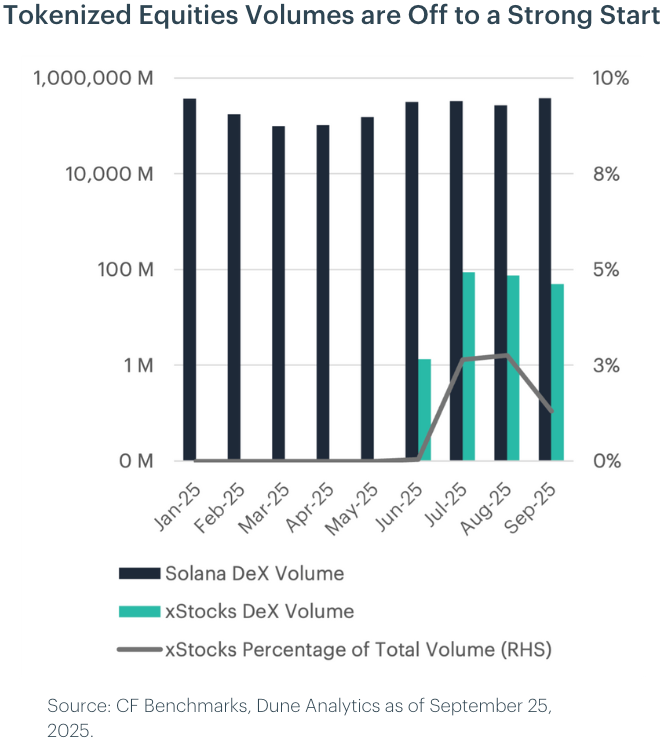
Tokenized real-world assets (RWAs) have scaled rapidly, with aggregate value excluding stablecoins reaching approximately $40 billion today, nearly doubling year-over-year. Within this landscape, tokenized equities remain nascent, with xStocks currently representing about $78 million in assets under management. This equates to less than 0.2% of the broader RWA market by size. However, trading activity tells a different story. On Solana decentralized exchanges, xStocks have achieved a disproportionate share of volumes, capturing roughly 2.5–2.8% of monthly activity within three months of launch. This divergence suggests early traction in liquidity and clear appetite for equity-based products in DeFi venues.
Looking ahead, RWAs are likely to continue expanding at a similar pace, potentially reaching $80 billion over the next 12 months. Tokenized equities are positioned to benefit from multiple structural drivers. Greater regulatory clarity in U.S. markets could broaden distribution and accelerate institutional participation. Deeper integration with exchanges and wallets should improve accessibility and enable more seamless on-chain settlement. Finally, ongoing product innovation, including index-style tokenized wrappers, is likely to simplify equity exposure for both retail and institutional users.
We believe xStocks could scale to represent approximately 2.5% of the total RWA market within 12 months, implying assets of roughly $2 billion if current growth trends persist. On decentralized exchanges, tokenized equities are likely to maintain a rising trajectory, with share stabilizing around 2–3% in 2025 and potentially reaching 5–10% of total DEX volumes by late 2026. While regulatory uncertainty and liquidity depth remain key risks, tokenized equities are positioned to transition from an experimental niche into a meaningful component of the on-chain ecosystem.
Portfolio Perspective: The tokens in the CF DeFi Composite Index are well-positioned to benefit from growing demand to issue and trade tokenized equities. Trading protocols stand to capture higher volumes and fee generation as liquidity migrates on-chain, while borrowing and lending platforms are likely to integrate tokenized equities as collateral, expanding their addressable markets and deepening utility across the DeFi ecosystem.
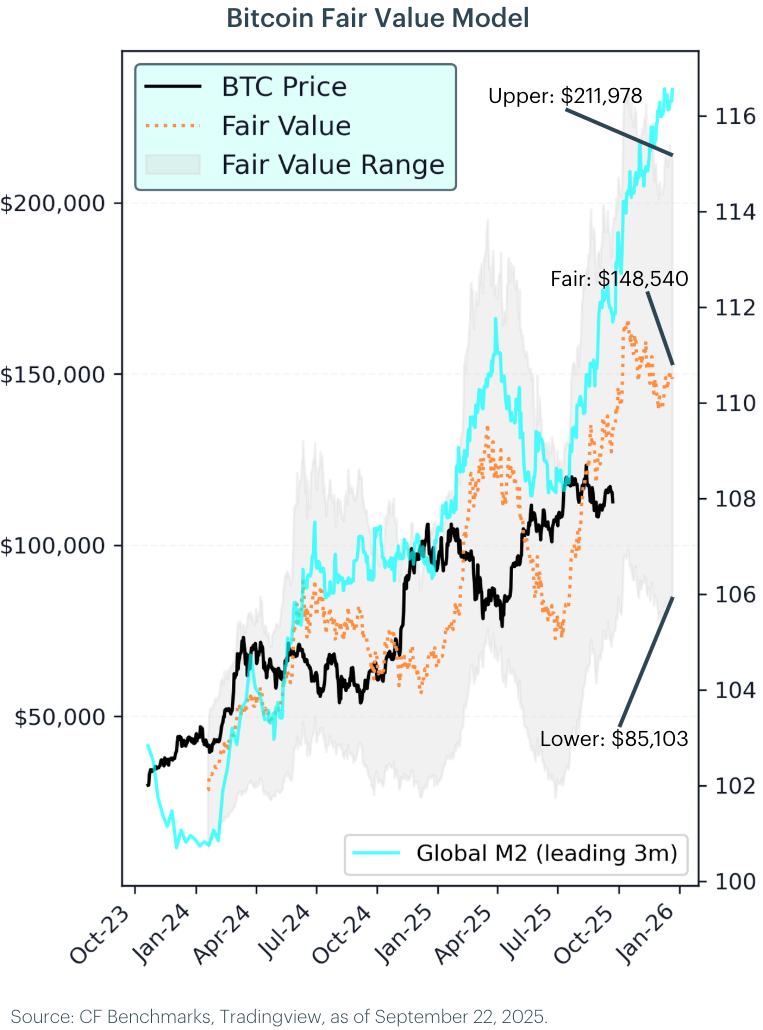
Measuring Bitcoin’s Fair Value: M2 Expansion to Lead BTC Higher
Our proprietary fair value (FV) framework for Bitcoin is based on a regression of Bitcoin's price against our Global M2 money supply index, where changes in M2 lead Bitcoin by approximately three months. Over the ten-year history we tested, the model produced a correlation of 0.8, indicating a strong statistical relationship. The underlying economic rationale is intuitive: Bitcoin, with its fixed supply, acts as a hedge against fiat currency debasement. When liquidity expands in the traditional financial system, it flows into alternative stores of value such as Bitcoin.
In recent months, we have observed a divergence between M2 growth and Bitcoin's price. M2 has continued to expand, yet Bitcoin has largely consolidated sideways. Our model suggests this disconnect is temporary and that Bitcoin's price tends to adjust with a lag to shifts in monetary conditions.
Based on current inputs, our model estimates a fair value of $148,500 for Bitcoin three months from now. To reflect uncertainty, we apply a 95% confidence interval, producing a fair value range of $85,100 to $212,000. Notably, the lower bound of this range was last reached in April 2025, a level that coincided with subsequent upside momentum.
Looking ahead, if M2 growth remains firm, our model indicates scope for Bitcoin to re-rate higher toward fair value. We view the persistence of liquidity expansion as supportive of Bitcoin's role as sound money and believe the current consolidation phase may present an attractive medium-term accumulation opportunity.
Portfolio Perspective: The continued fiat debasement is likely to act as a tailwind for Bitcoin in the fourth quarter. With Bitcoin currently trading at the lower bound of its fair value range, we believe this presents a compelling tactical entry point. The current setup of persistent M2 growth, elevated inflation concerns, and sideways consolidation mirrors conditions that have historically preceded meaningful re-rating phases. For investors seeking a hedge against currency debasement, the risk-reward profile appears favorable. However, the lower target of $85,100 remains within our 95% confidence interval, meaning further downside is possible before a move toward the model's $148,500 fair value estimate.
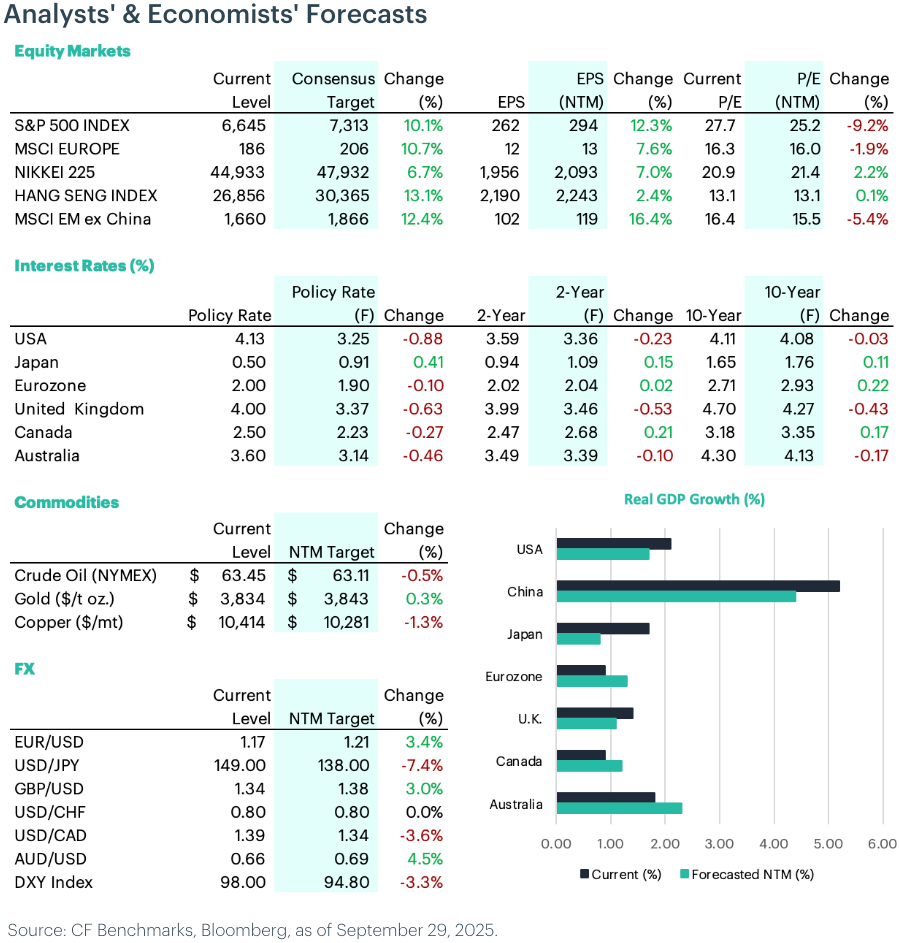
Measuring the Crowd: Consensus Forecasts
Equities: Analysts maintain a broadly positive outlook for equities, with Hong Kong (+13.1%) and European markets (+10.7%) leading major forecasts. Emerging markets ex China (+12.4%) and Japan (+6.7%) are also expected to perform well. U.S. equities are forecast to rise 10.1%, with S&P 500 earnings per share projected to grow by 12.3%. Despite ongoing valuation expansion, particularly in the U.S. and Europe, earnings growth remains strong, especially in Asia and the US.
Interest Rates: Markets are pricing in broad rate cuts across developed markets, with the U.S. expected to lead easing at -0.88%, bringing the policy rate down to 3.25%. The U.K. (-0.63%), Australia (-0.46%), and Canada (-0.27%) are also projected to cut, while the Eurozone is expected to ease only slightly (-0.10%). In contrast, Japan is forecast to hike modestly (+0.41%). Changes in 2- and 10-year yields remain modest, suggesting that global inflation concerns are keeping long rates elevated.
Commodities: Gold is forecast to edge higher (+0.3%), reflecting steady investor demand for real assets amid macro uncertainty. Crude oil is expected to decline slightly (-0.5%), pointing to softer demand expectations. Copper is projected to fall more meaningfully (-1.3%), suggesting muted momentum in industrial activity.
FX: The U.S. dollar is expected to weaken, with the DXY Index down 3.3%. The yen is projected to appreciate sharply (+7.4%) on policy divergence, while gains are also expected in the euro (+3.4%), pound (+3.0%), and Australian dollar (+4.5%). The Swiss franc is forecast to remain broadly flat, while USD/CAD is expected to decline 3.6%.
GDP Growth: Growth forecasts show continued regional divergence. China is expected to lead with growth of 4.4%, while the U.S. is projected to slow to 1.7%. Australia (2.3%) and Canada (1.2%) are forecast to improve modestly, while the Eurozone is expected to rebound to 1.3%. By contrast, Japan (0.8%) and the U.K. (1.1%) are likely to see slower growth.
To read the our full market outlook report, please click here.
The information contained within is for educational and informational purposes ONLY. It is not intended nor should it be considered an invitation or inducement to buy or sell any of the underlying instruments cited including but not limited to cryptoassets, financial instruments or any instruments that reference any index provided by CF Benchmarks Ltd. This communication is not intended to persuade or incite you to buy or sell security or securities noted within. Any commentary provided is the opinion of the author and should not be considered a personalised recommendation. Please contact your financial adviser or professional before making an investment decision.
Note: Some of the underlying instruments cited within this material may be restricted to certain customer categories in certain jurisdictions.
Factor Friday - July 31, 2026
July's rally has stalled, with the Market factor flat at +0.02% and its four-week gain down to +0.48% from +7.13%. Momentum led a second straight week at +1.96%, its first back-to-back run since late May, while Growth reversed to +1.74% and Value fell to the bottom at -1.93%.

Mark Pilipczuk
Changes to the Token Market Price Benchmarks Series - Market Prices – 28 July 2026
Changes to the Token Market Price Benchmarks Series - Market Prices – 28 July 2026
CF Benchmarks
Digital Assets Absorb Hawkish Repricing Ahead of the FOMC
Digital assets traded through a hawkish macro surprise this week but closed mostly higher, with breadth holding across major names and indices. Sector leadership traced to a single regulatory catalyst, not a broad rotation, and implied volatility stayed firmer than realized into the weekend.
Mark Pilipczuk
By clicking Accept, you consent to CF Benchmarks's use of cookies.
Visit Cookie Settings to learn how CF Benchmarks uses cookies and to adjust your preferences.