
Dec 01, 2025
Weekly Index Highlights, December 1, 2025
Market Performance Update
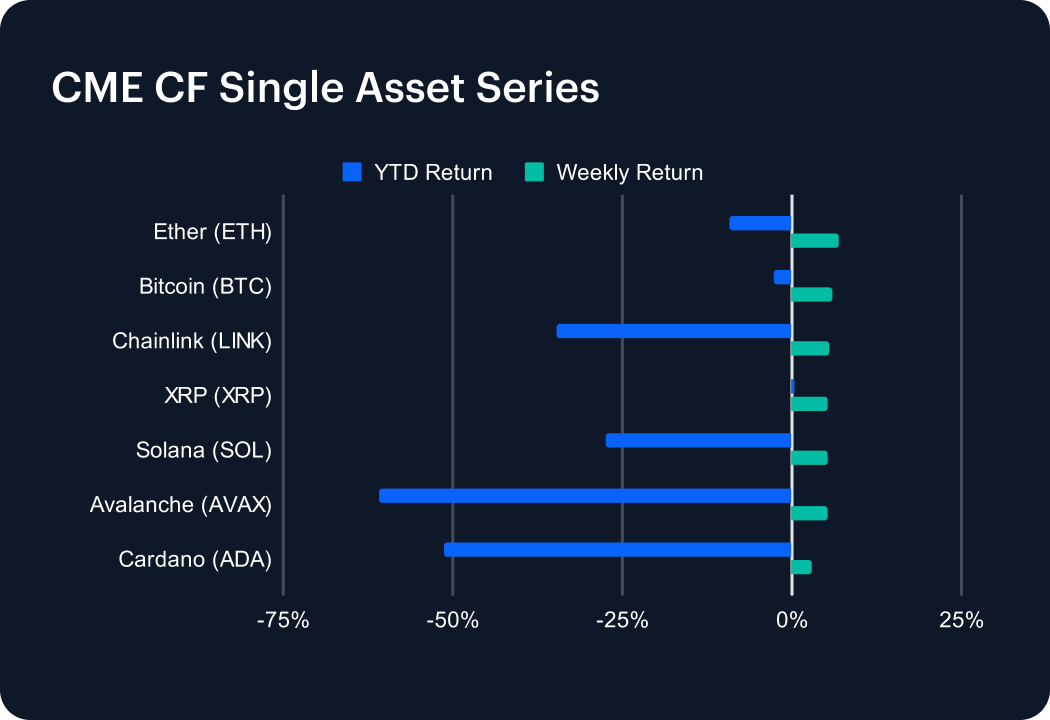
Large and mega caps staged a sharp rebound, reversing the prior week’s drawdown almost one-for-one. Bitcoin moved from roughly -7.9% to +5.9% week-on-week, while Ether swung from around -9.8% to +6.9%. The rest of the large-cap complex followed suit: Solana, XRP, Chainlink, Avalanche and Cardano all shifted from approximately -5–14% to +3–6% over the week. Despite the rally, year-to-date returns remain meaningfully negative for several majors, notably Solana, down about -28% YTD, Chainlink, about -35% YTD, Avalanche (AVAX) about -61% YTD, and Cardano (ADA) about -51% YTD, underscoring that this is still a recovery phase rather than a new high-water mark. XRP is the notable exception, nudging back toward flat on the year.
Sector Analysis
Sector performance, viewed through the CF Digital Asset Classification Structure (CF DACS) lens, broadly tracked the beta rebound seen in large and mega caps. Programmable platforms and Finance-linked segments generally printed mid-single-digit positive weekly returns, with more defensive Non-Programmable and Utility cohorts also participating but with a softer profile. Culture- and infrastructure-oriented sectors tended to lag that leadership group, yet even there, the tone shifted away from disorderly liquidation toward a more orderly mix of short-covering and opportunistic dip-buying. Cross-sector dispersion narrowed relative to the prior week, reinforcing the impression of a broad risk-on phase rather than a narrowly focused rotation. Under the surface, the Finance basket moved from roughly -9.6% last week to about +1.6% this week on a sector-average basis. Not all names fully participated: SUSHI and SNX remained in loss territory at roughly -7% and -6% for the week, albeit materially less negative. Meanwhile, the Culture complex showed an even sharper re-rating: from around -13.3% last time to approximately +5.1%. High-beta Gaming and Social/Media names did heavy lifting: SUPER surged +23%, BAT rocketed +33%, and CHZ jumped +10%. Among laggards: APE fell -9% and IMX slipped -3% after a prior -19% decline. Overall, the sector tape looks like classic short-covering and mean reversion — led by a handful of outsized winners, but with enough residual weakness in selected names to suggest positioning is normalizing but not yet fully rebuilt.
CF Staking Series
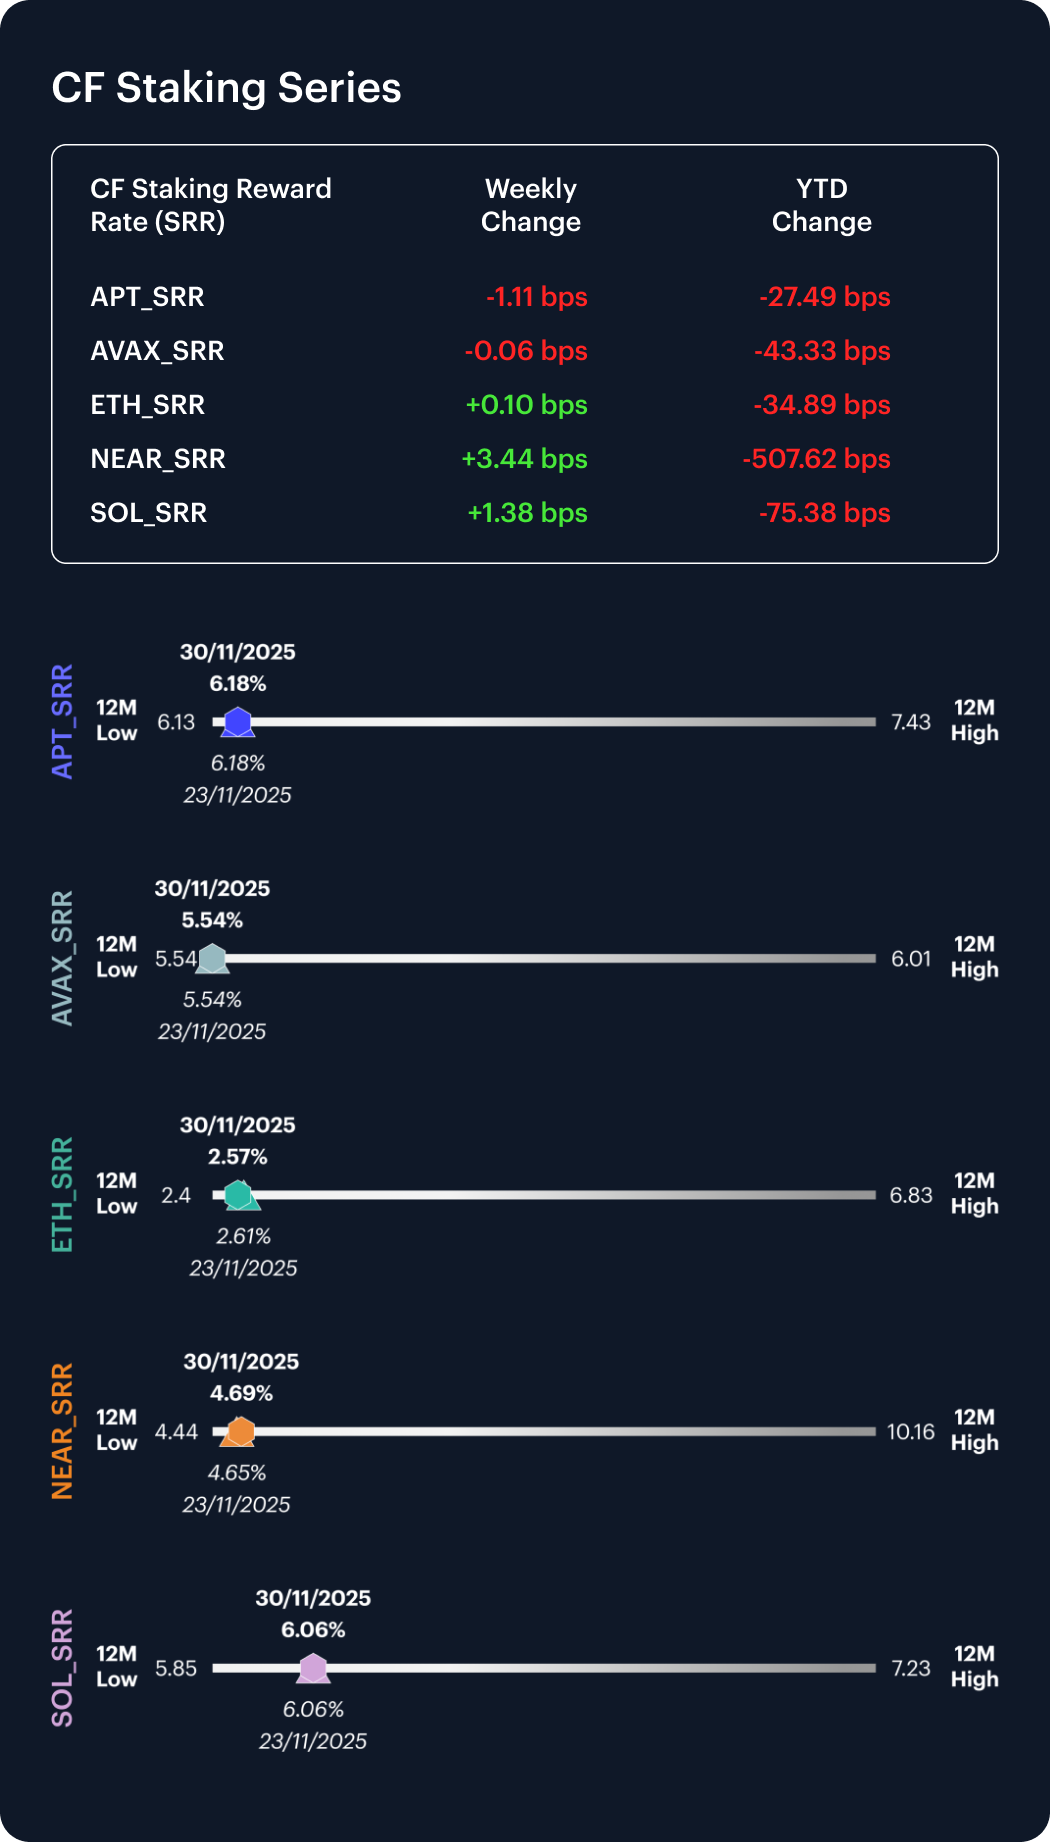
The CF Staking Series painted a more nuanced picture than the outright beta rally in spot. Staking index weekly returns were relatively muted, with APT -0.18%, AVAX -0.01%, ETH +0.04%, NEAR +0.74% and SOL +0.23%, versus the prior week’s APT +0.01%, AVAX -0.10%, ETH -2.28%, NEAR +0.61% and SOL +2.21%. This implies a meaningful improvement for ETH staking (from roughly -2.3% to flat, a swing of about +230 bps in weekly return) and a sharp cooling in SOL staking performance (from around +2.2% to +0.2%, roughly -200 bps), with NEAR extending its positive run (about +13 bps), while APT and AVAX drift sideways-to-slightly softer. In level terms, staking rate proxies remain clustered in tight ranges: APT and AVAX steady around 6.2% and 5.5%, SOL close to 6.1%, NEAR nudging from roughly 4.65% to 4.69%, and ETH implied yields near 2.6%. YTD the dispersion remains wide, with NEAR Staking deeply negative, -52%, and APT, AVAX, ETH and SOL in a more contained -4% to -12% band.
Market Cap Index Performance
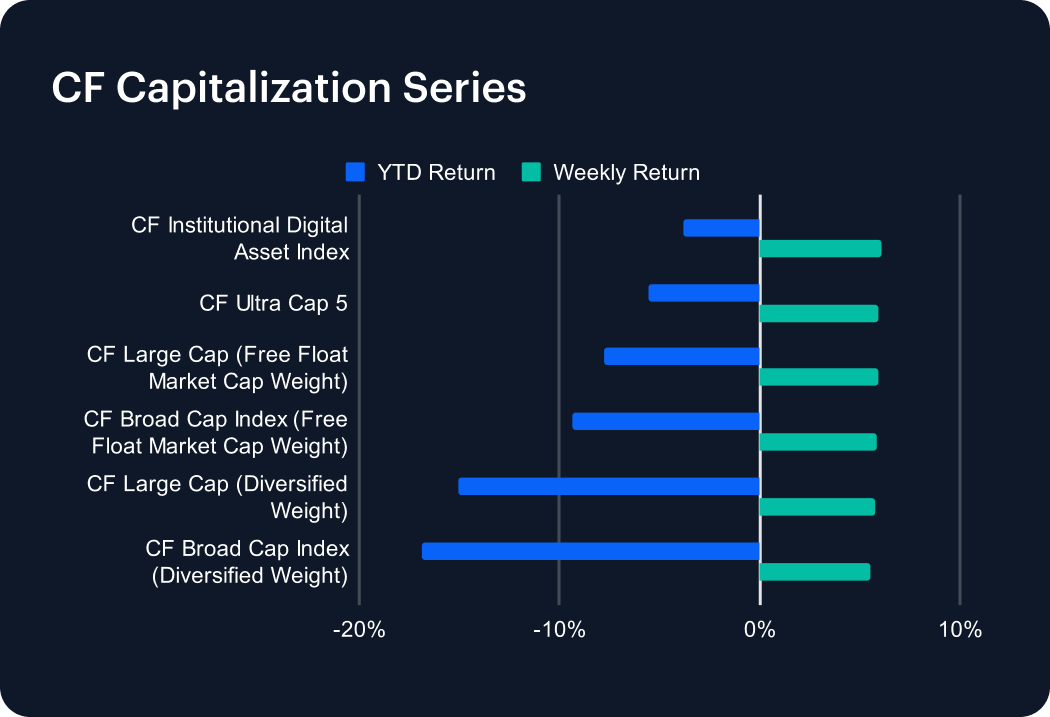
Capitalization tiers show a very clean “beta shock” story. All six composites — from CF Ultra Cap 5 through the CF Broad Cap Index in both free-float and diversified weight — flipped from about -8% the prior week to approximately +5.5–6.0% in the current week. That translates into week-on-week swings of roughly +14 percentage points across the board. The CF Institutional Digital Asset Index mirrored this pattern, moving from around -8.2% to +6.1%. YTD, the diversified cap indices are still meaningfully underwater, with the diversified large and broad cap composites running at roughly -15% and -17% respectively. The structure of returns across tiers suggests this was a classic beta-led rally rather than a rotation favoring any particular cap bucket.
Classification Series Analysis
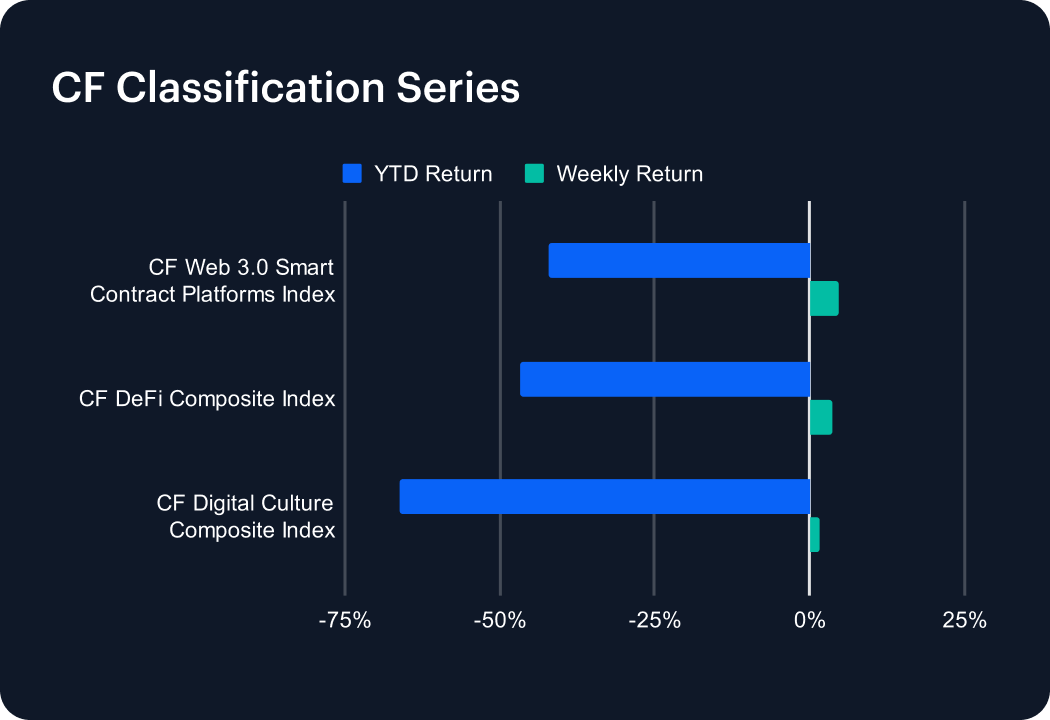
Among thematic indices, the rebound was broad and led by the more cyclically exposed segments. The CF Web 3.0 Smart Contract Platforms Index recovered from approximately -10.5% to +4.6% week-on-week, while the CF DeFi Composite Index reversed from around -13.3% to +3.7%. Digital culture-linked assets (CF Digital Culture Composite Index) also bounced, albeit more modestly, from roughly -14.7% to +1.6%. All three indices therefore delivered mid-single-digit positive weekly returns but remain deeply negative year-to-date — in the -40% to -65%. In other words, the week saw a strong mean-reversion rally across DACS growth- and culture-oriented segments, not a full repair of their longer-term underperformance.
Volatility Analysis
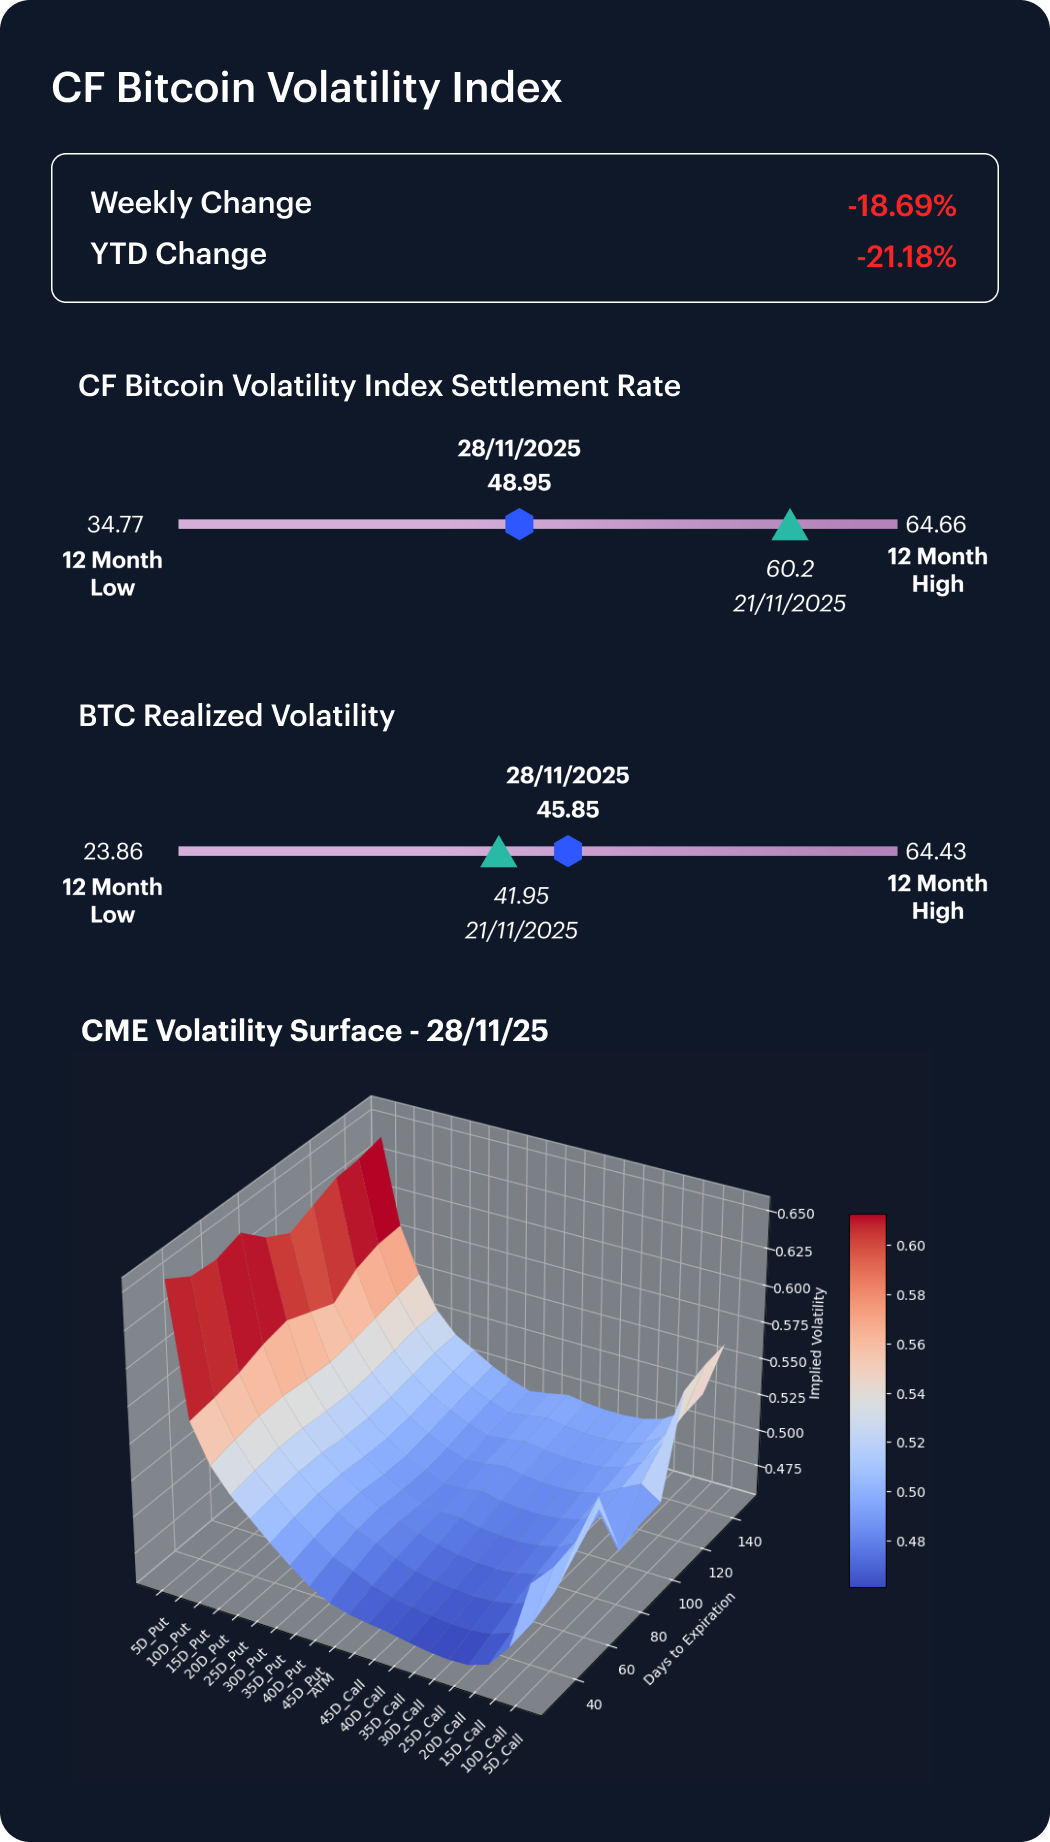
Volatility sent mixed but still quite interpretable signals. The CF Bitcoin Volatility Index (BVX) declined from about 60.2 (on November 21st) to 48.9 over the week, indicating a compression in implied or forward-looking volatility even as spot prices rallied. By contrast, BTC realized volatility over the same horizon rose from roughly 41.9% to 45.9%, reflecting the high-amplitude rebound in prices after the previous week’s sell-off. The combination — lower BVX, higher realized — is consistent with a market that has already ‘spent’ some volatility in the recovery and is now pricing a somewhat calmer forward path despite elevated near-term realized moves.
Interest Rate Analysis
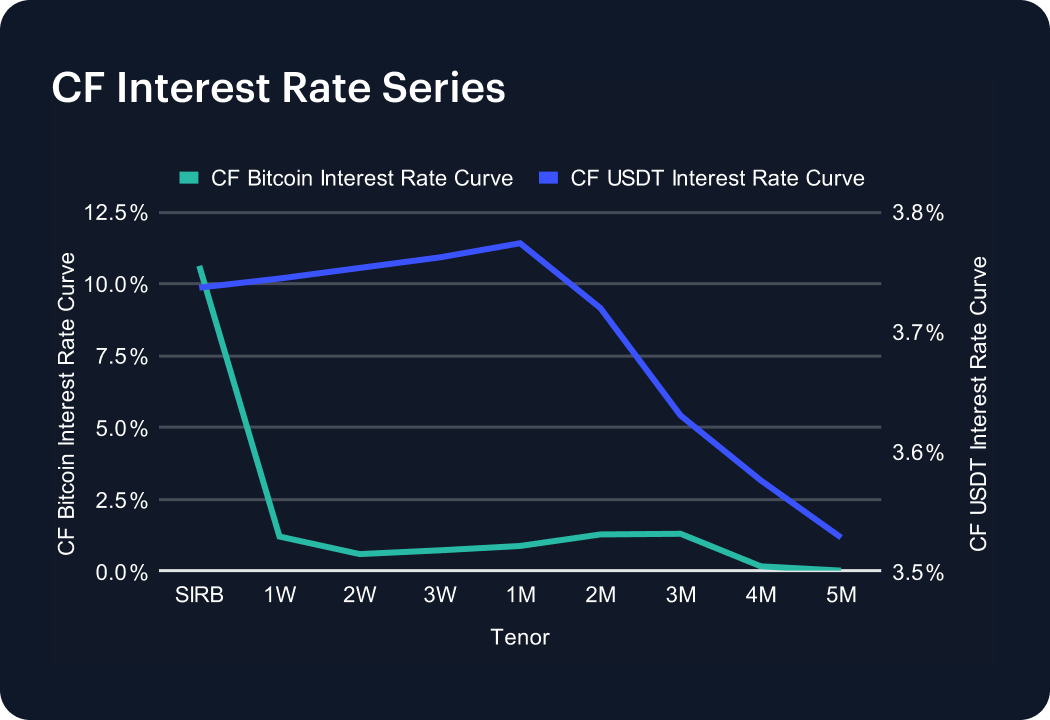
The Bitcoin Interest Rate Curve (BIRC) steepened materially compared to US-dollar stablecoin rates, proxied by our CF USDT Interest Rate Curve. The BTC SIRB tenor moved higher by approximately +280 bps week-on-week, while the 1-week to 1-month points shifted up by roughly +30 bps–40 bps. Further out the curve, 2–3 month BTC tenors rose by around +60 bps to 70 bps, before easing back slightly at 4–5 months, where the move was closer to flat or modestly negative. By contrast, the USDT interest rate curve eased across almost all tenors, with week-on-week moves of roughly -7 to -18 bps. The net effect is a more constructive BTC funding backdrop versus a slightly softer stablecoin curve, consistent with a renewed demand to be long BTC on margin while cash-like yields edge lower.
Factors Analysis
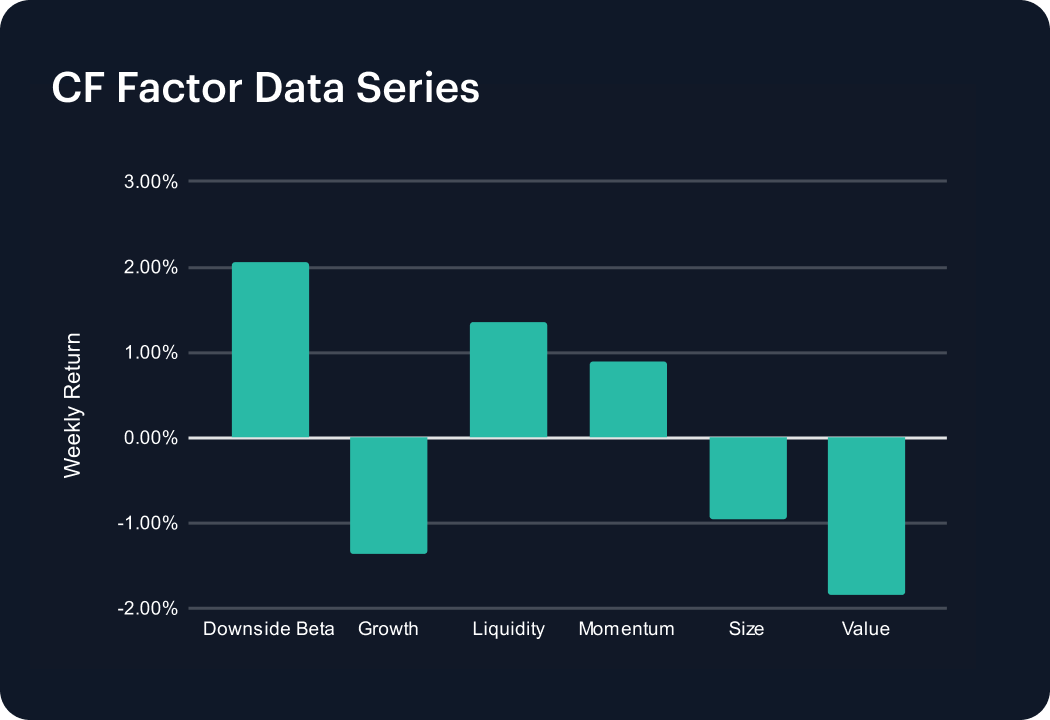
Factor returns continued to signal a risk-aware but selective appetite. Downside Beta remained positive at about +2.1% for the week (down from roughly +3.1% previously), pointing to ongoing preference for higher-beta exposures, albeit with less intensity than the prior week. Liquidity stayed firmly in positive territory, at around +1.4%, suggesting that higher-liquidity names are still being favored in the rally. Momentum flipped from a small loss (about -0.6%) to a gain of approximately +0.9%, indicating that recent underperformers have started to catch a bid, consistent with short-covering or early repositioning. Size improved but stayed negative (from about -1.9% to -1.0%), and Value deteriorated further (from roughly -0.6% to -1.9%), while Growth swung from a modest gain to a more meaningful loss (around +0.5% to -1.4%). Taken together, the factor complex describes a market that is still comfortable owning beta and liquidity but is increasingly discriminating against both Growth and Value cohorts, with momentum helping to confirm the rotation rather than lead it.
The information contained within is for educational and informational purposes ONLY. It is not intended nor should it be considered an invitation or inducement to buy or sell any of the underlying instruments cited including but not limited to cryptoassets, financial instruments or any instruments that reference any index provided by CF Benchmarks Ltd. This communication is not intended to persuade or incite you to buy or sell security or securities noted within. Any commentary provided is the opinion of the author and should not be considered a personalised recommendation. Please contact your financial adviser or professional before making an investment decision.
Note: Some of the underlying instruments cited within this material may be restricted to certain customer categories in certain jurisdictions.
Changes to the Token Market Price Benchmarks Series - Market Prices – 21 July 2026
The Administrator has confirmed changes to the Token Market Price Family for the period 14 July 2026 to 21 July 2026.

CF Benchmarks
Softer CPI Reprices July Hike Risk & Lifts Digital Assets
Digital assets extended their recovery over the past week as cooler US inflation prints repriced Fed expectations; the bid was broad across the large cap indices, growth factor leadership returned, stablecoin funding repriced lower, and stress stayed isolated in names hit by token-specific news.
Mark Pilipczuk
Notice of the Demising of CF Dai-Dollar Settlement Price and Spot Rate
The Administrator announces that it will demise the CF Dai-Dollar Settlement Price (DAIUSD_RR) and CF Dai-Dollar Spot Rate (DAIUSD_RTI) which are members of the CF Digital Asset Index Family.
CF Benchmarks
By clicking Accept, you consent to CF Benchmarks's use of cookies.
Visit Cookie Settings to learn how CF Benchmarks uses cookies and to adjust your preferences.