
Mar 02, 2026
Weekly Index Highlights, March 2, 2026
Market Performance Update
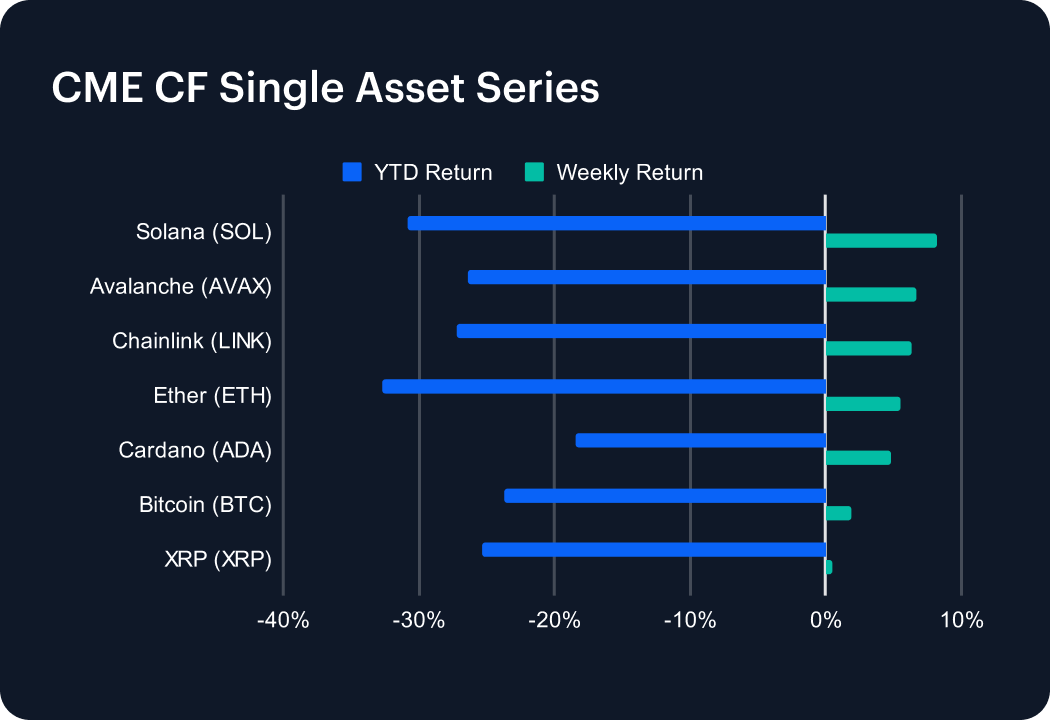
The outbreak of war in Iran over the weekend is the latest geopolitical influence preventing risk markets from catching a break, though the record should detail how most digital assets largely advanced in the final week of February. All 7 Single Asset Series indices posted gains week-on-week (w/w), with Bitcoin +1.93%, while Ether added +5.55%. Higher-beta names led the bounce: Solana (SOL) gained +8.15%, Avalanche (AVAX) rose +6.67% and Chainlink (LINK) returned +6.35%. Cardano (ADA) also posted a solid rise, +4.77%; meaning XRP (XRP) was the clear underperformer, with +0.53%. These moves left dispersion across the basket at 7.63 percentage points (SOL +8.15% versus XRP +0.53%). Even so, year-to-date returns remain negative across the set, ranging from -18.45% for ADA to -32.65% for ETH, with BTC at -23.65%. The combination of broad breadth (7 out of 7 positive) and leadership from SOL and AVAX frames the week as a rebound with a clear tilt toward platform and infrastructure-linked exposures. Put differently, SOL (+8.15%) and AVAX (+6.67%) led BTC (+1.93%). It’s a profile typical of higher-beta leadership and could usually be indicative of continued overall momentum to some extent, under normal circumstances.
Volatility Analysis
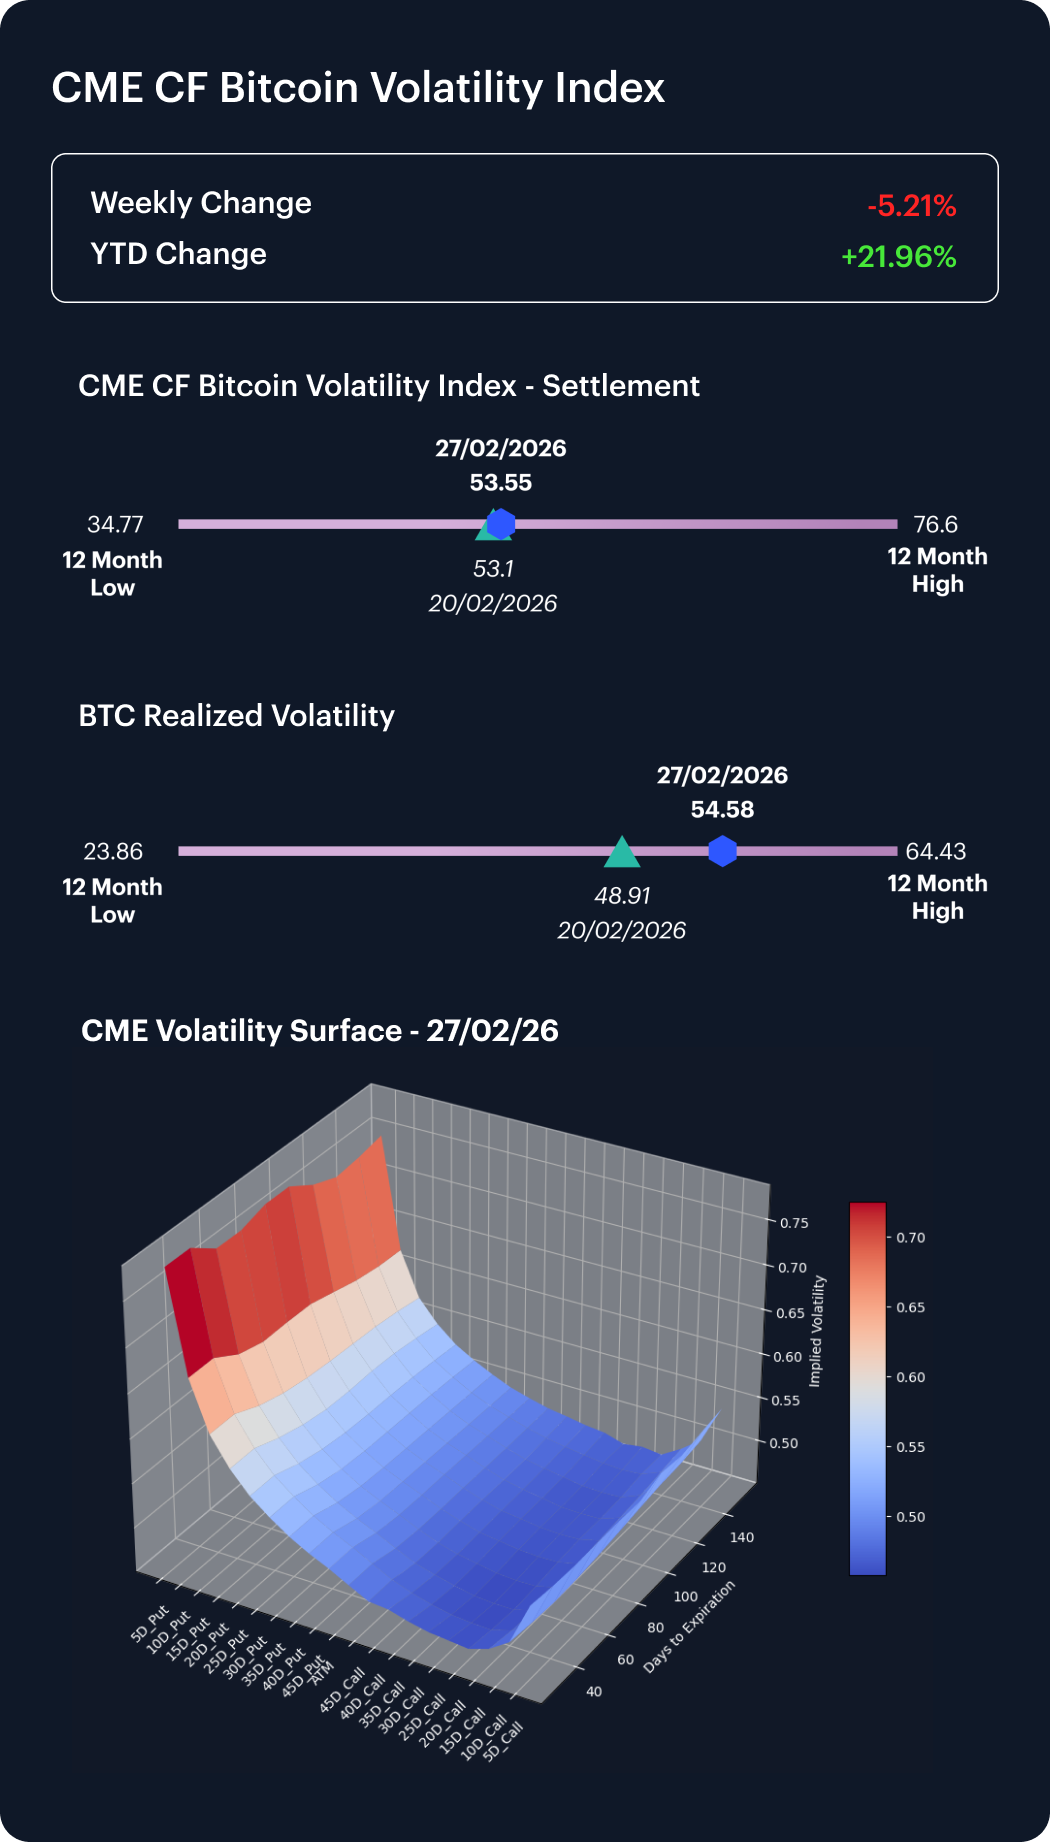
Implied volatility eased moderately over the week, with the Settlement variant of our CME CF Bitcoin Volatility (BVXS) index ranging somewhat lower between 53.25 and 57.78 through the week, and there was limited positive movement on a week-on-week basis, with BVXS rising just +0.45 of a point. Realized volatility was up +5.67 points w/w, rising to 54.58 from 48.91, Friday to Friday, a move of +5.67 points, while the intraweek realized print spanned 49.94 to 54.58. As a result, the implied–realized spread moved from +4.19 points (implied above realized) to -1.03 points (implied below realized). Within the 12-month context, BVX remains mid-range versus its 34.77 low and 76.60 high, while realized sits nearer the upper half of its 23.86 to 64.43 range. With realized volatility now slightly exceeding implied, the week’s pricing hints at a compression of the short-dated volatility premium and a market that had underpriced the realized pickup into the week-end.
Market Cap Index Performance
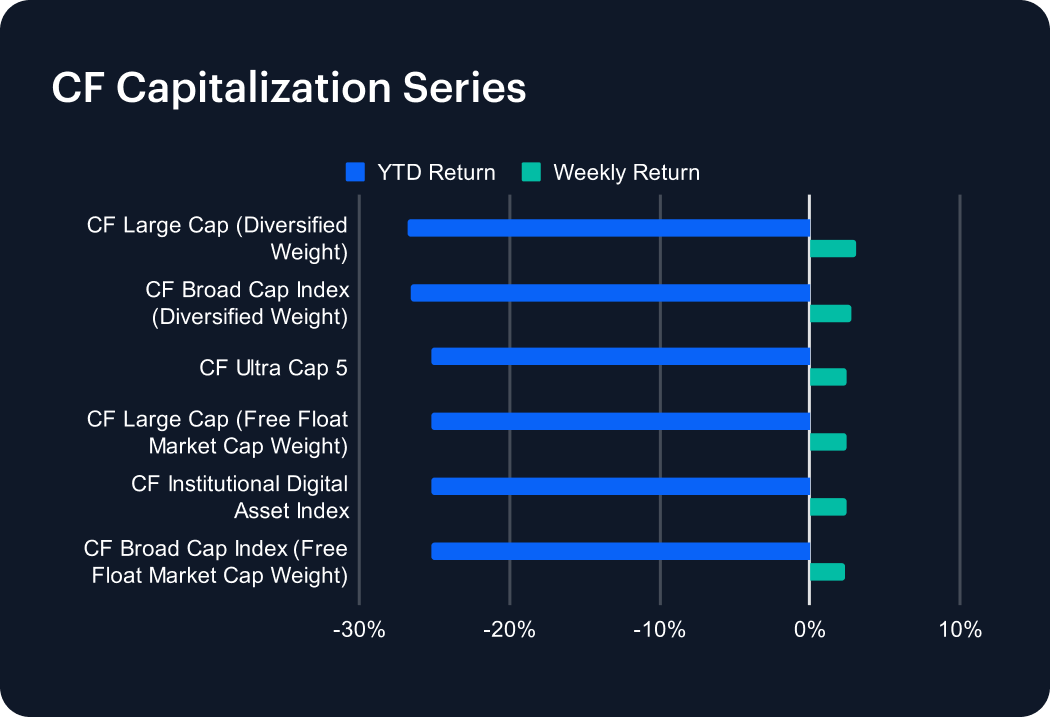
Market-cap indices advanced in a tight band, within a range of +2.37% to +3.10% w/w, leaving dispersion contained across both weighting schemes. The CF Large Cap (Diversified Weight) index led at +3.10% w/w (YTD -26.79%), while the CF Broad Cap Index (Diversified Weight) returned +2.74% (YTD -26.58%). At the concentrated end, CF Ultra Cap 5 gained +2.49% (YTD -25.21%). Free-float market-cap versions tracked closely, with CF Large Cap (Free Float Market Cap Weight) up +2.47% and CF Broad Cap Index (Free Float Market Cap Weight) up +2.37%, both with YTD declines of roughly -25.2%. The CF Institutional Digital Asset Index rose +2.47% (YTD also -25.19%), reinforcing the same message across investable, diversified benchmarks. Across the six indices, the weekly return range was 0.73 of a percentage point (+3.10% to +2.37%). This reflects a market-wide lift, with limited idiosyncratic dispersion. In the prior week, these indices fell between -0.94% and -1.76%, framing a roughly 3.3 to 4.9 percentage-point swing into positive territory.
Factors Analysis
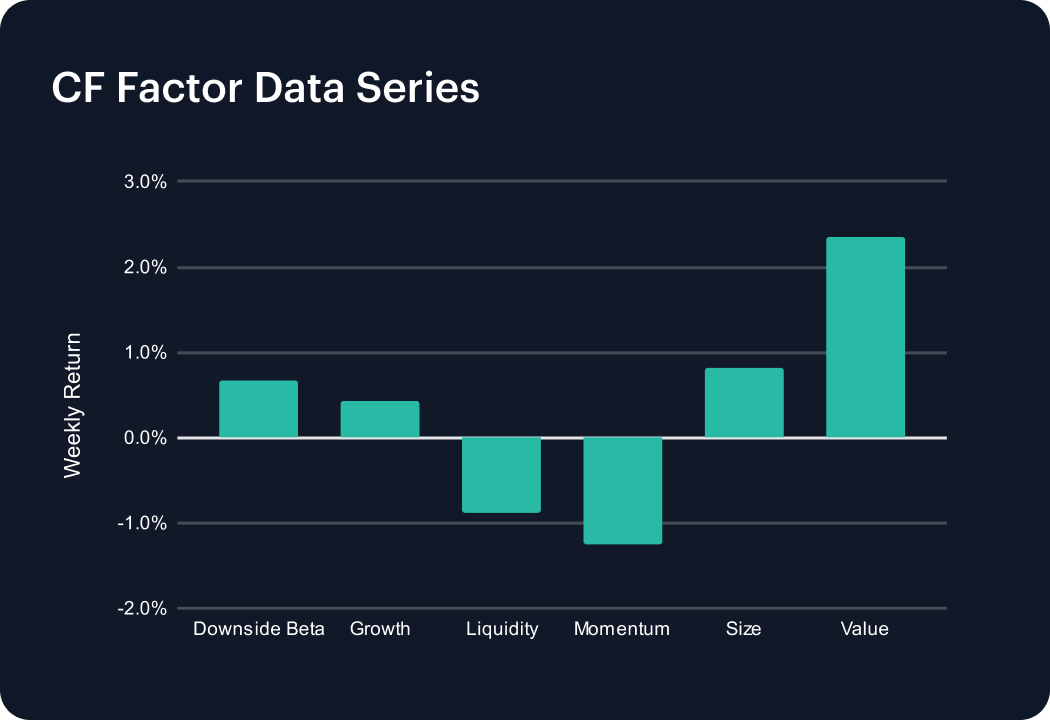
Factor performance rotated over the week, with Value leading and Momentum the clear detractor. On the compounded daily series, Value returned +2.34% for the week and Size added +0.81%, while Downside Beta contributed +0.66% and Growth gained +0.43%. Liquidity declined -0.88% and Momentum fell -1.26%, leaving a 3.60 percentage-point spread between Value (+2.34%) and Momentum (-1.26%). Relative to last week’s prints, Value moved from -1.52% to +2.34% and Size from -1.52% to +0.81%, while Downside Beta moderated from +1.30% to +0.66%. With Value at +2.34% and Size at +0.81% alongside Momentum at -1.26%, the week’s mix can be interpreted as cheaper and larger exposures outperforming as momentum reversed, while Downside Beta remained positive at +0.66%. With six factors spanning -1.26% to +2.34% on the week, the factor tape carried more cross-sectional information than the relatively tight cap-tier dispersion. 4 of the 6 factors finished positive (Value, Size, Downside Beta and Growth), while Liquidity and Momentum were negative at -0.88% and -1.26%.
Classification Series Analysis
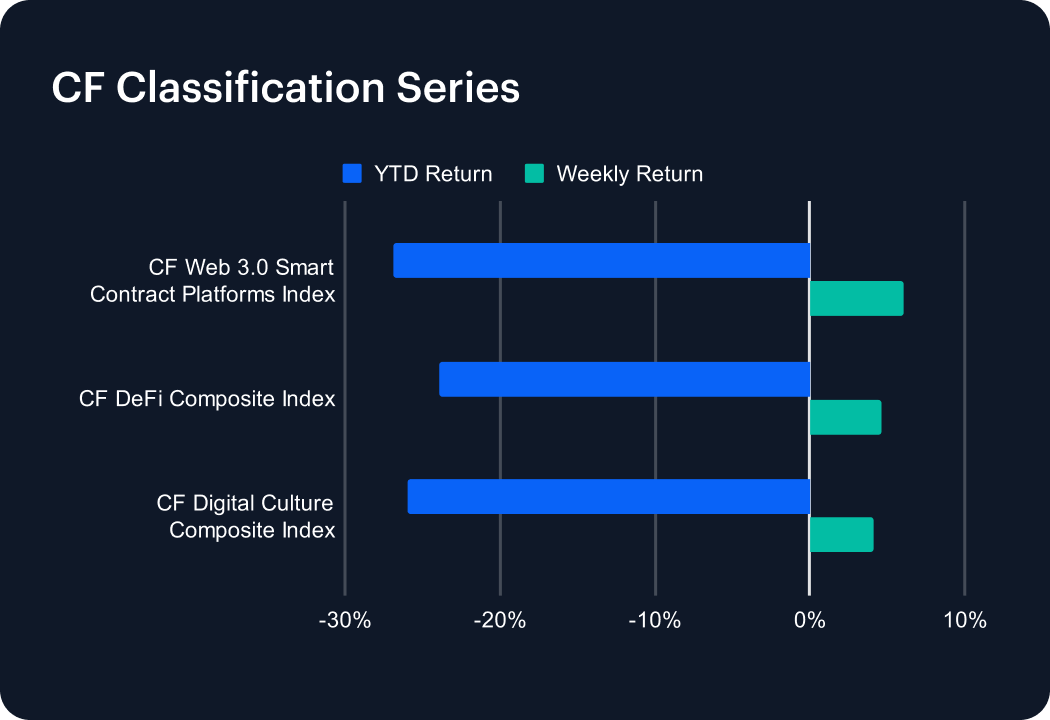
Across the CF Classification Series all three themes advanced, spanning +4.13% to +6.05% w/w, amid modest dispersion. The CF Web 3.0 Smart Contract Platforms Index returned +6.05% w/w, rising from 184.55 to 195.72 (YTD -26.88%), ahead of the CF DeFi Composite Index at +4.65%, moving from 171.86 to 179.86 (YTD -23.96%). The CF Digital Culture Composite Index rose +4.13%, from 74.72 to 77.81 (YTD -26.00%). Weekly dispersion across the three series was 1.93 percentage points (+6.05% to +4.13%). One week earlier, the same series set was flat-to-down, with DeFi at -0.09%, Web 3.0 platforms at -2.49% and Digital Culture at -5.49%. Within the year-to-date frame, DeFi remains the least negative at -23.96%, versus -26.00% for Digital Culture and -26.88% for Web 3.0 platforms. The relative strength in platforms over the week is consistent with SOL (+8.15%) and AVAX (+6.67%) leading the single-asset set, and with the CF DACS Programmable Sub-Category averaging +5.19% on the week.
Sector Analysis
CF DACS Sub-Category performance was split, with 3 of 6 groups positive and a wide spread between leaders and laggards. Programmable led at +5.19% on average, supported by gains in DOT (+21.17%) and ICP (+18.00%), while ATOM (-15.39%) was the weakest name within the group. Utility followed at +2.36% on average, paced by FIL (+9.79%) and LINK (+6.35%), with small negatives in GRT (-0.76%) and ANKR (-0.70%). Infrastructure added +1.90% on average, helped by ZRO (+15.93%) and STX (+8.91%) even as HNT (-6.09%) and JASMY (-5.23%) lagged. On the downside, Finance was near flat at -0.21% on average, where UNI (+11.09%) and CRV (+10.22%) contrasted with SNX (-20.62%). Culture declined -1.13% on average, weighed by meme and media names such as PEPE (-12.59%) and BAT (-11.42%). Non-Programmable fell -1.42% on average as BCH dropped -16.29% despite LTC (+3.84%) and BTC (+1.93%). Across the 6 reported Sub-Categories, the average-return range ran from +5.19% to -1.42%, a 6.60 percentage-point dispersion.
CF Staking Series
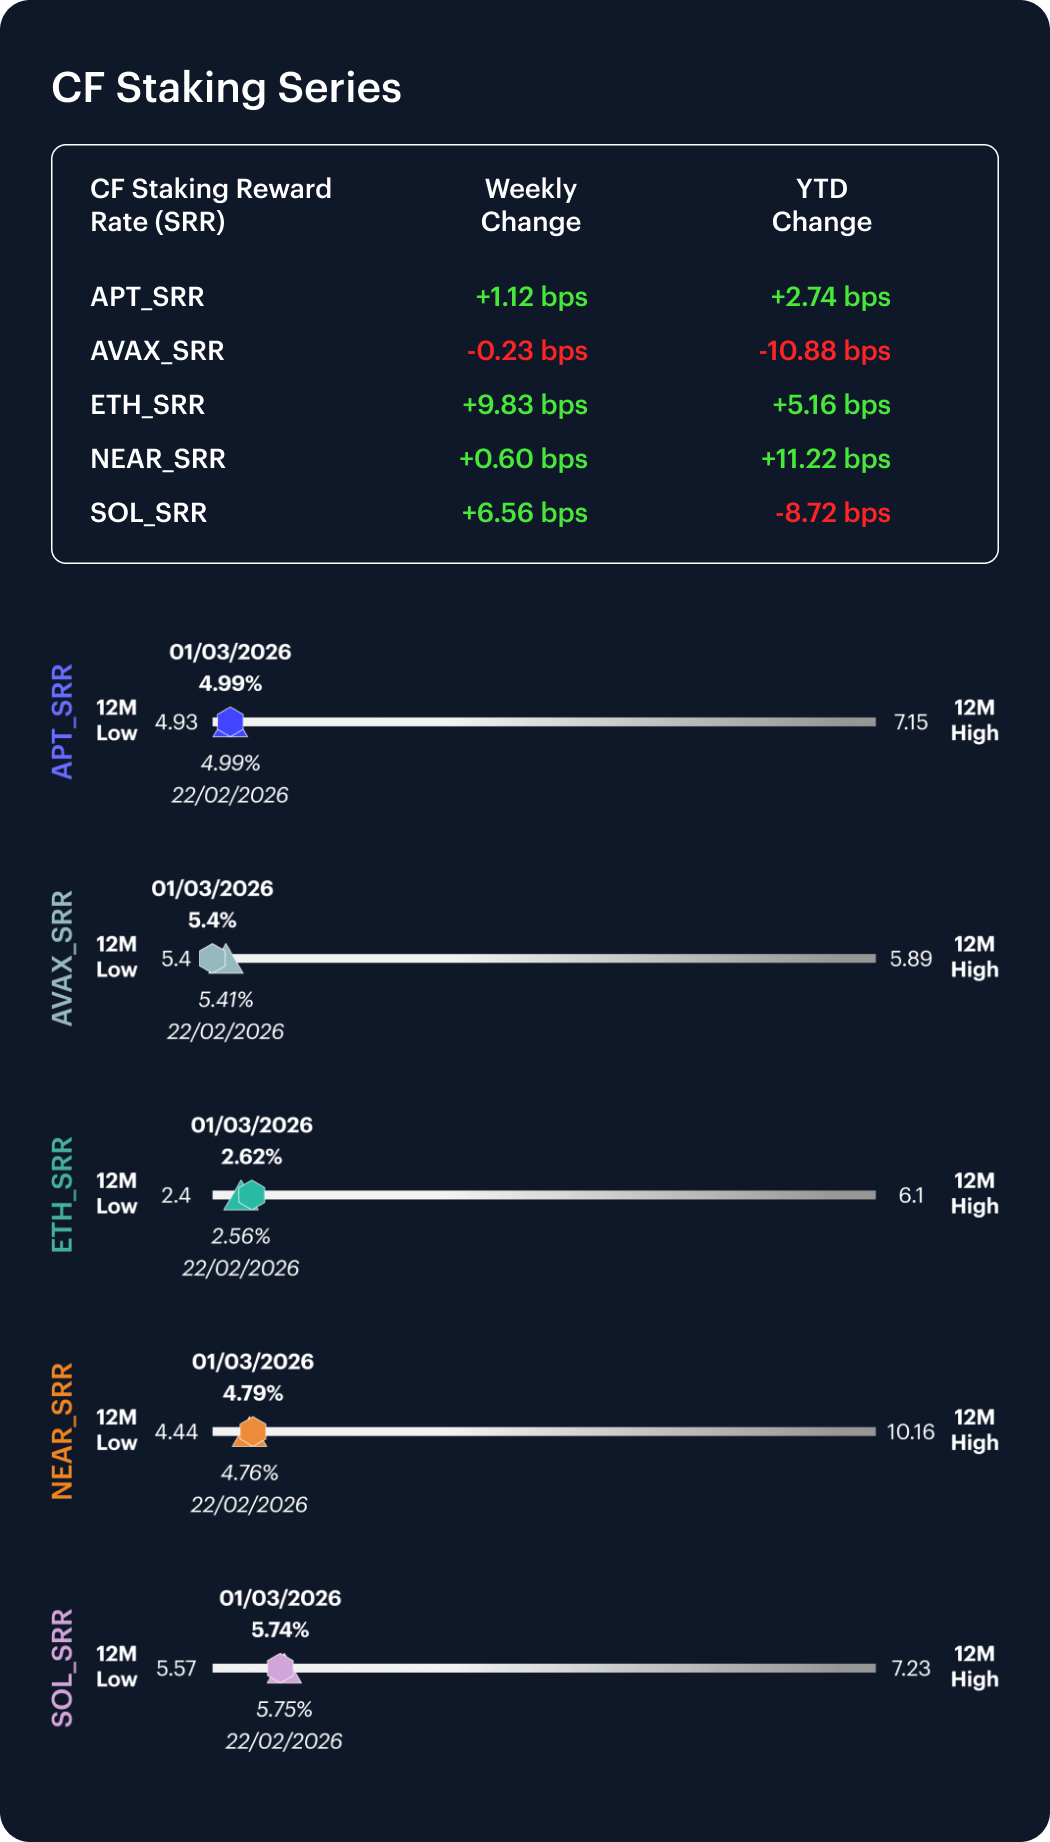
Staking performance was mixed across the CF Staking Series, with mostly mild returns concentrated near the lower end of a -0.04% to +3.90% w/w range. ETH Staking led at +3.90% w/w (YTD +2.01%) as its reward rate rose 9.83 bps, from 2.522% to 2.620% between February 23rd and March 1st. SOL Staking returned +1.16% (YTD -1.50%) with its reward rate increasing 6.56 bps, from 5.672% to 5.737%. APT Staking added +0.22% (YTD +0.55%) equating to its reward rate edging up 1.12 bps from 4.979% to 4.990%, while NEAR Staking ticked up +0.13% (YTD +2.40%) alongside a 0.60 bps lift from 4.788% to 4.794%. This makes AVAX Staking the underperformer, as it eked marginally lower at -0.04% (YTD -1.97%) with its reward rate slipping 0.23 bps, for a move from 5.406% to 5.404%. Across the series, intra-week reward-rate moves spanned -0.23 to +9.83 bps, with the largest repricing concentrated in ETH and SOL.
Interest Rate Analysis
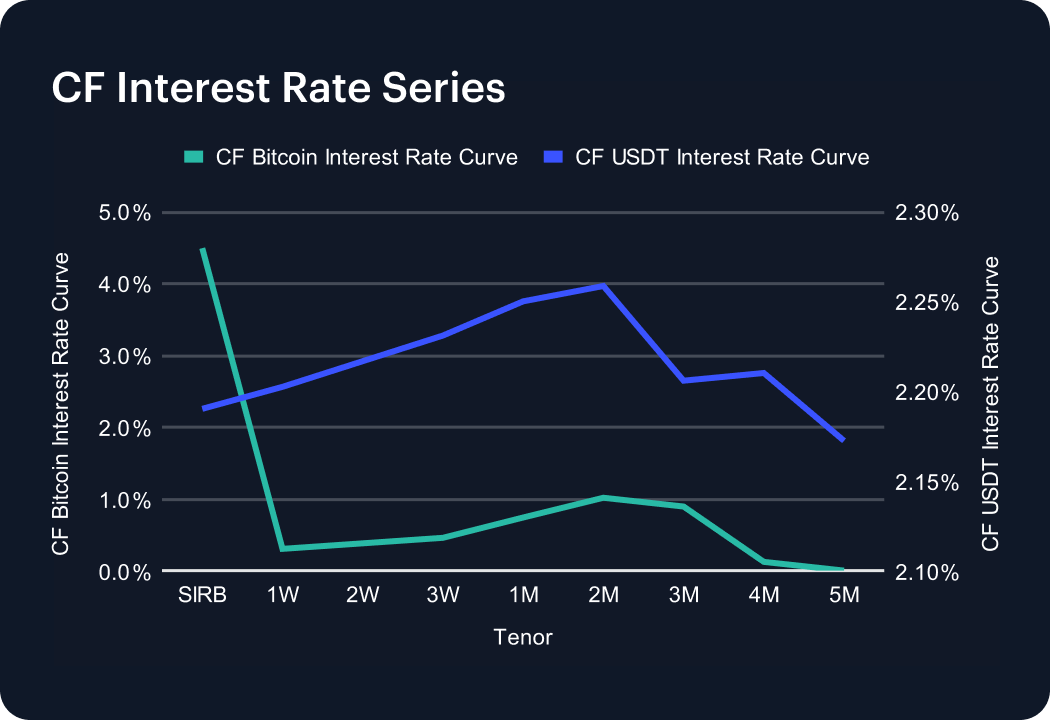
Funding conditions eased across both CF BIRC curves, with BTC SIRB down 117 bps and USDT SIRB down 52 bps week-over-week; and the sharpest adjustment concentrated at the BTC front end. On the CF Bitcoin Interest Rate Curve, SIRB fell from 5.67% to 4.50% (-117 bps) week-over-week, while the 1W tenor dropped from 1.81% to 0.30% (-150 bps). Further out the curve, the 1M point edged down from 0.93% to 0.74% (-19 bps), but the belly firmed with 2M rising from 0.72% to 1.02% (+29 bps) and 3M from 0.75% to 0.89% (+14 bps). In USDT, moves were more parallel: SIRB declined from 2.71% to 2.19% (-52 bps) and 1W from 2.72% to 2.20% (-52 bps), while 1M slipped from 2.75% to 2.25%. With BTC showing a front-end collapse alongside a firmer belly, the curve shape now carries a steeper 1W-to-2M gradient (0.30% versus 1.02%), while USDT continues to cluster around 2.17% to 2.26% across the 1W to 3M segment.
The information contained within is for educational and informational purposes ONLY. It is not intended nor should it be considered an invitation or inducement to buy or sell any of the underlying instruments cited including but not limited to cryptoassets, financial instruments or any instruments that reference any index provided by CF Benchmarks Ltd. This communication is not intended to persuade or incite you to buy or sell security or securities noted within. Any commentary provided is the opinion of the author and should not be considered a personalised recommendation. Please contact your financial adviser or professional before making an investment decision.
Note: Some of the underlying instruments cited within this material may be restricted to certain customer categories in certain jurisdictions.
Changes to the Token Market Price Benchmarks Series - Market Prices – 21 July 2026
The Administrator has confirmed changes to the Token Market Price Family for the period 14 July 2026 to 21 July 2026.

CF Benchmarks
Softer CPI Reprices July Hike Risk & Lifts Digital Assets
Digital assets extended their recovery over the past week as cooler US inflation prints repriced Fed expectations; the bid was broad across the large cap indices, growth factor leadership returned, stablecoin funding repriced lower, and stress stayed isolated in names hit by token-specific news.
Mark Pilipczuk
Notice of the Demising of CF Dai-Dollar Settlement Price and Spot Rate
The Administrator announces that it will demise the CF Dai-Dollar Settlement Price (DAIUSD_RR) and CF Dai-Dollar Spot Rate (DAIUSD_RTI) which are members of the CF Digital Asset Index Family.
CF Benchmarks
By clicking Accept, you consent to CF Benchmarks's use of cookies.
Visit Cookie Settings to learn how CF Benchmarks uses cookies and to adjust your preferences.