
Mar 02, 2026
Regulatory Gridlock and Geopolitical Shock
Key takeaways for the month
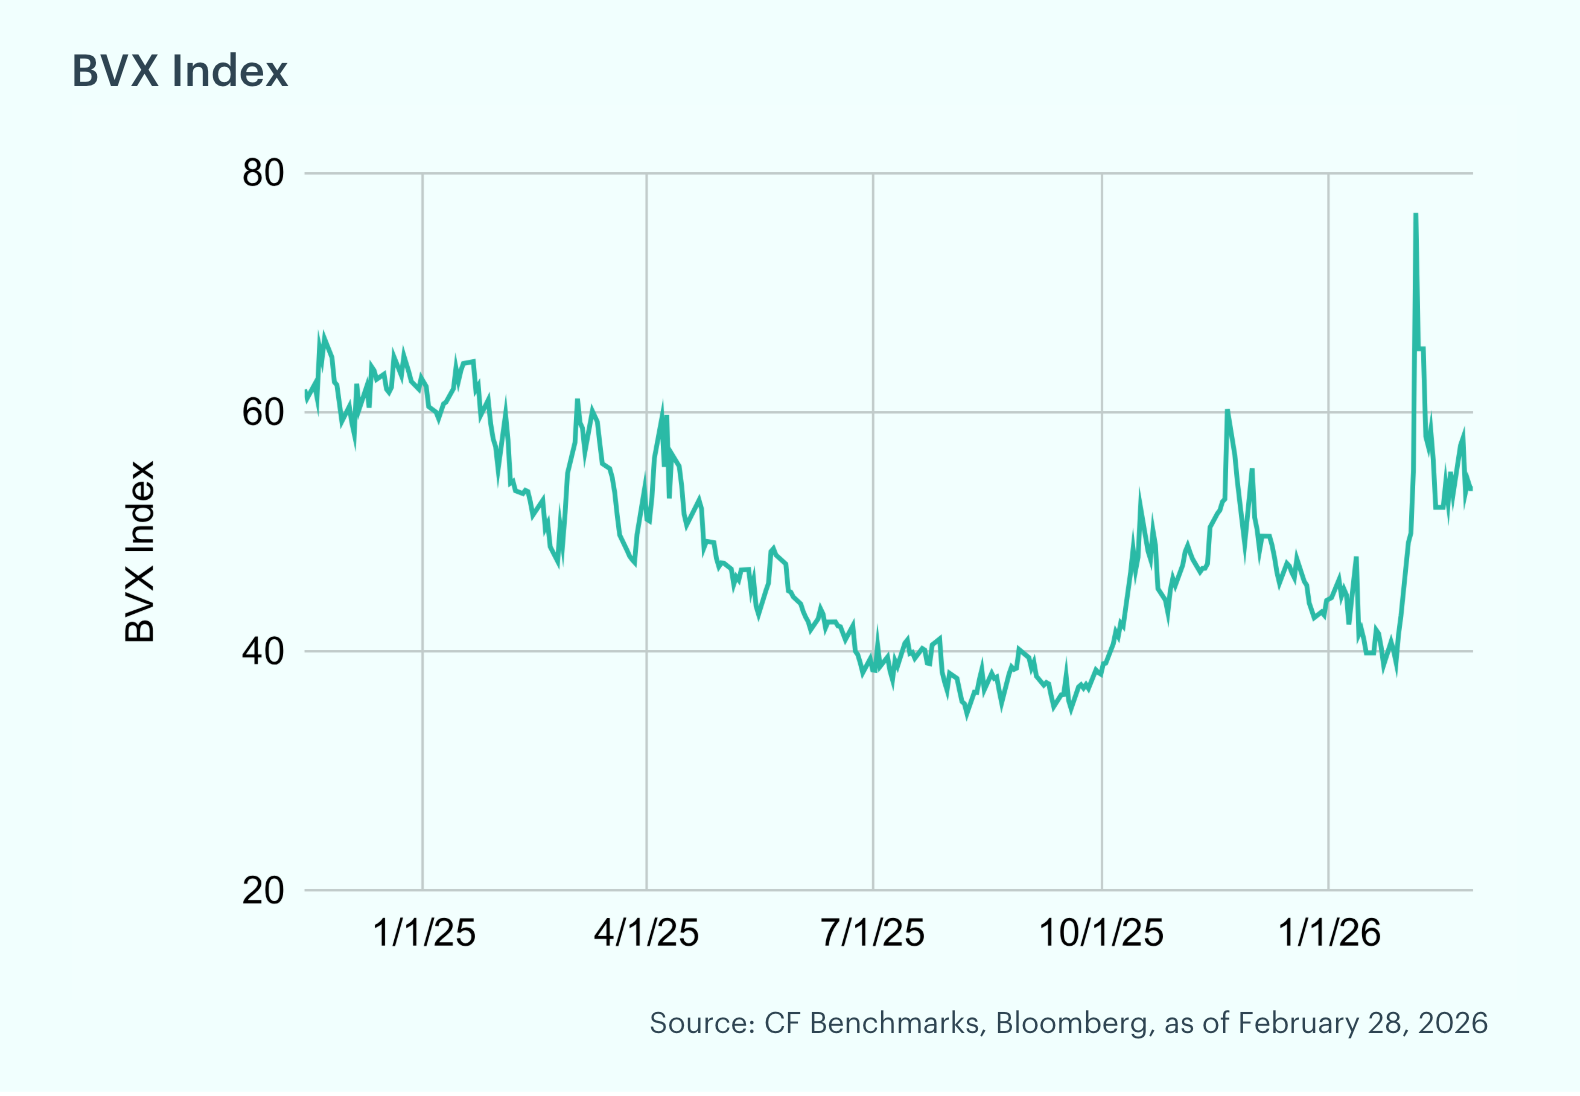
Macro, regulatory and geopolitical uncertainty intensified in February, triggering a wave of liquidations across digital assets as risk appetite deteriorated sharply. The Senate confirmation process for Kevin Warsh, widely viewed by markets as a surprisingly hawkish pick for Fed Chair, faced early headwinds after Senator Tillis vowed to block the nomination until a DOJ investigation into the Fed was resolved. Regulatory momentum stalled as the CLARITY Act languished in the Senate after the Banking Committee postponed its January markup amid industry pushback over a stablecoin interest payment amendment; two White House-brokered sessions in early February failed to bridge the divide. Bitcoin sold off sharply early in the month, temporarily breaching the $60,000 level before stabilizing in the mid-$60,000 range. The severity of the move was underscored by the CME CF Bitcoin Volatility Index (BVX), which registered a four-standard-deviation spike amid the liquidation cascade. Geopolitical risk escalated further as coordinated U.S.-Israeli military strikes on Iran on February 28 spiked uncertainty across a region critical to global oil markets. With legislative progress frozen and geopolitical tensions reinforcing a risk-off posture, liquidity thinned and higher-beta tokens bore the brunt of the sell-off.
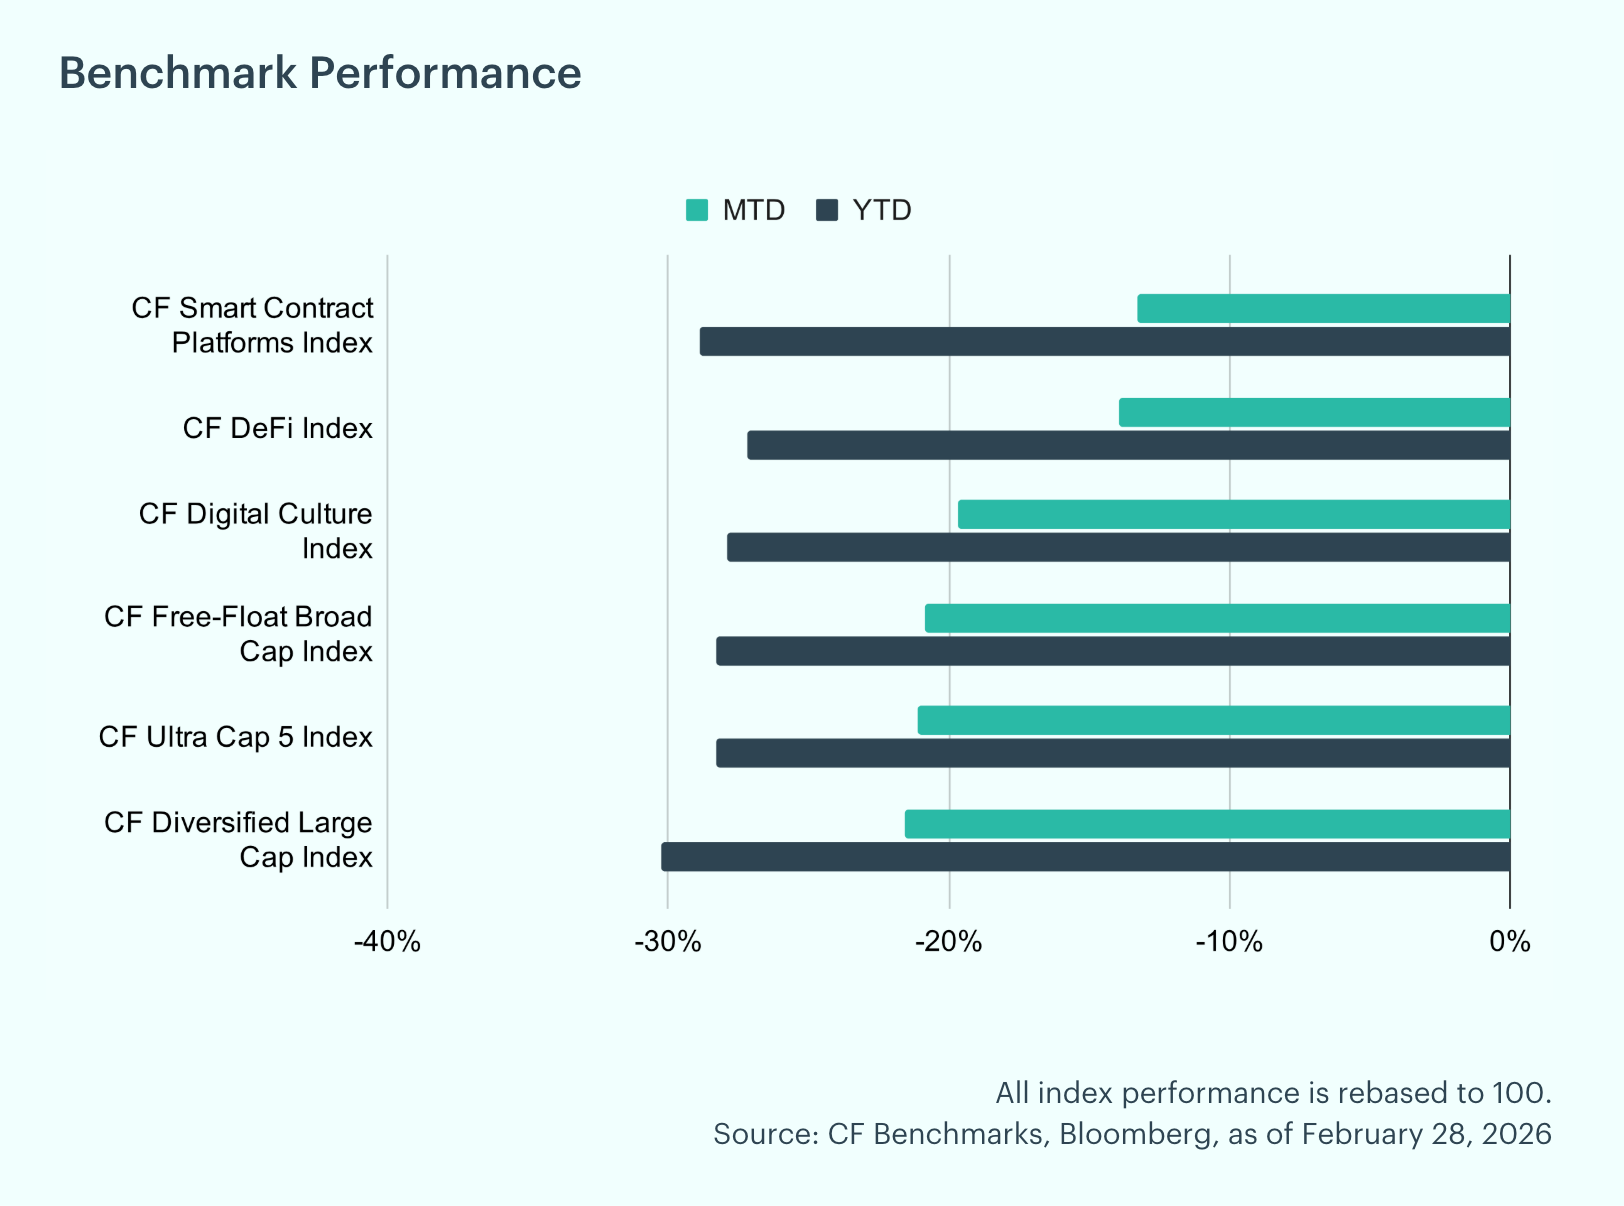
Risk-Off Rout Deepens: The result was a deepening of the 2026 drawdown, with digital assets broadly lower for a second consecutive month. The CF Smart Contract Platforms Index was the relative outperformer, falling 13% month-to-date, while the CF DeFi Index declined 14%. The CF Digital Culture Index lost 20%, and both the CF Ultra Cap 5 and CF Free-Float Broad Cap indices fell approximately 21%. The CF Diversified Large Cap Index trailed at -22%. On a year-to-date basis, losses widened materially, with the Diversified Large Cap down over 30% and most other indices down around 28%.
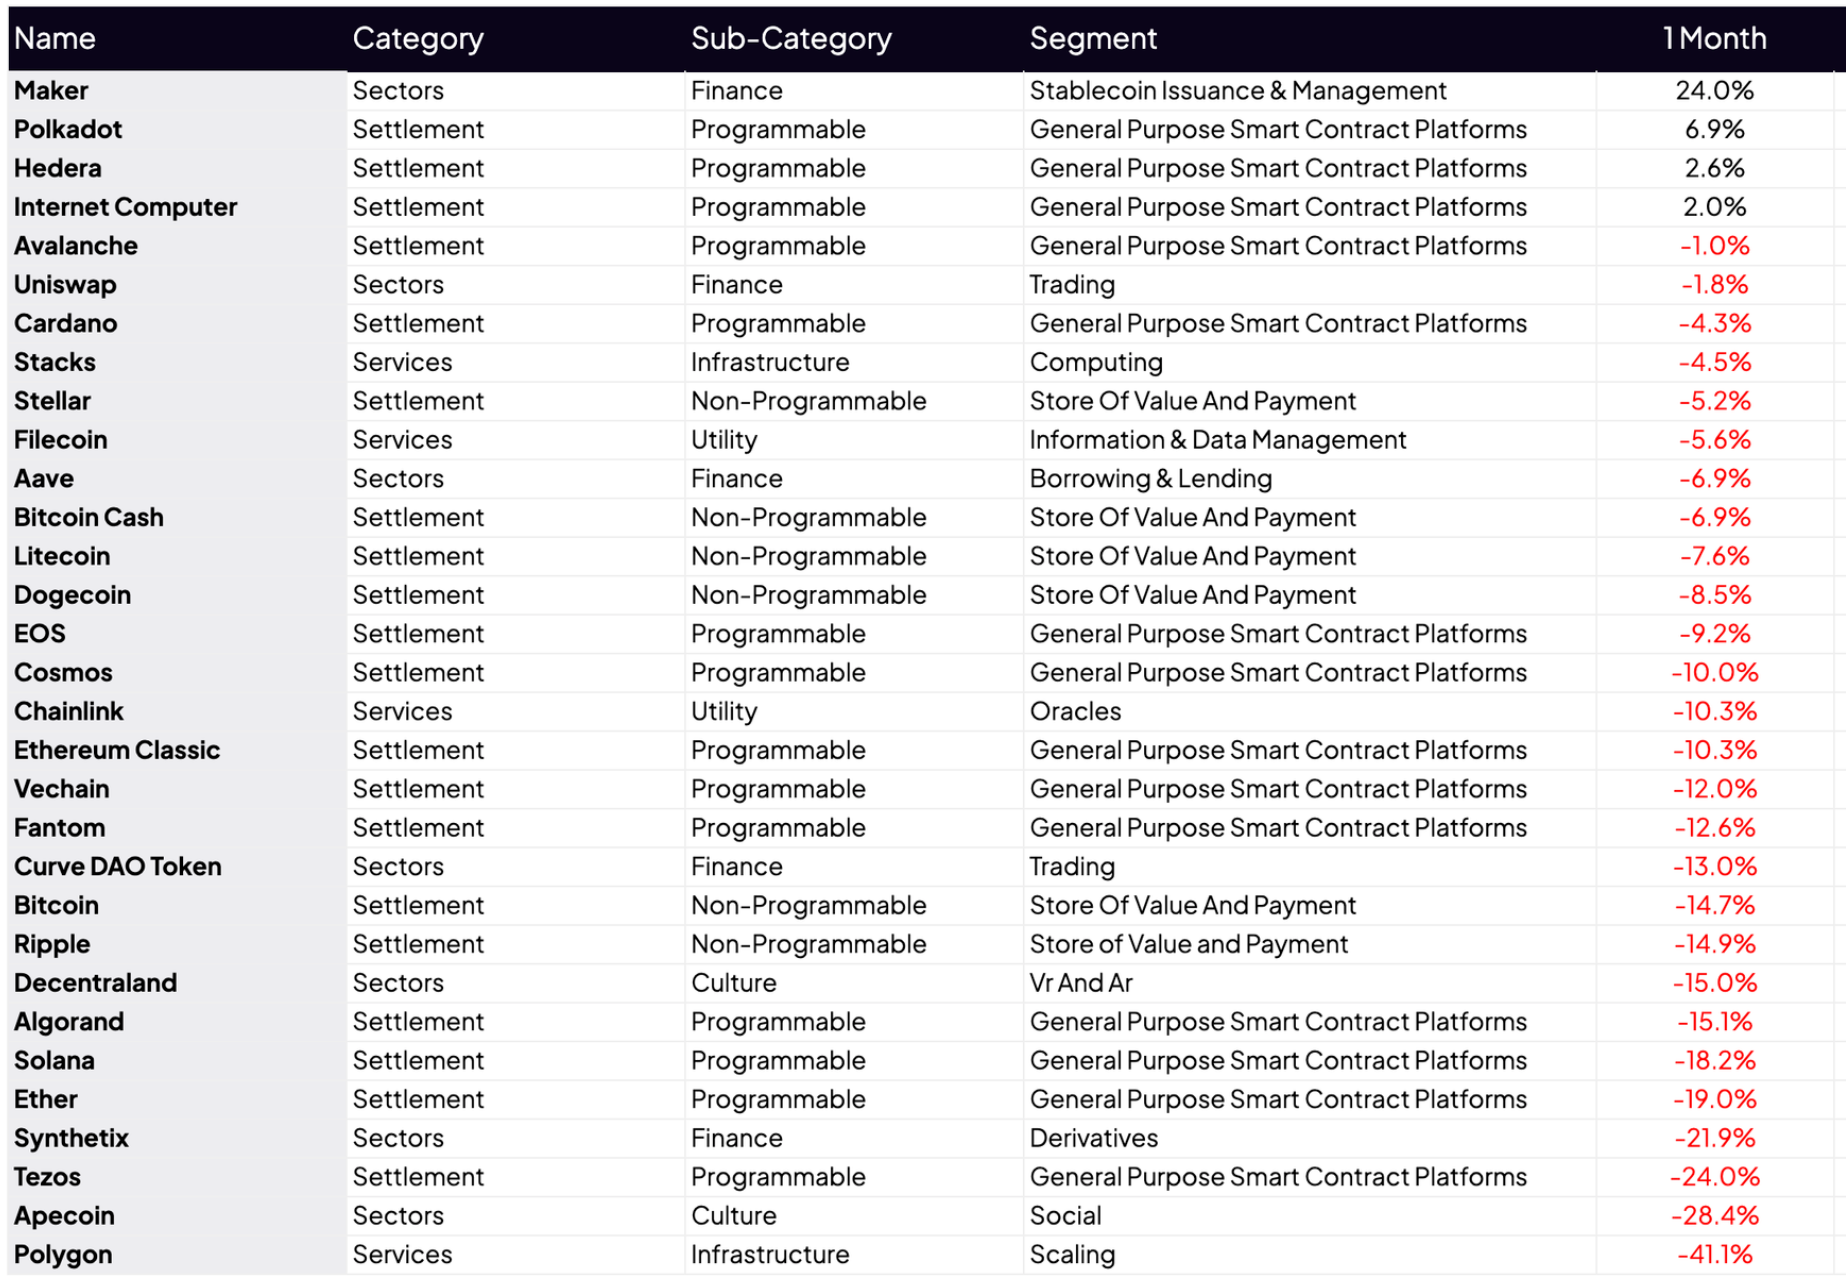
Individual Movers: Maker (MKR) led February's major crypto performers with a 24.0% gain, driven by strong DeFi lending activity and protocol revenue growth. Polkadot (DOT) followed at +6.9%, supported by interoperability developments and ecosystem expansion. Hedera (HBAR) held resilient with +2.6%, buoyed by enterprise adoption momentum and steady network growth. Polygon (POL) trailed February's majors with a -41.1% plunge, hit by competitive pressure from alternative Layer-2 solutions. Apecoin (APE) followed at -28.4%, pressured by continued NFT and metaverse apathy. Tezos (XTZ) rounded out the laggards with -24.0%, suffering from ecosystem stagnation and declining developer activity.
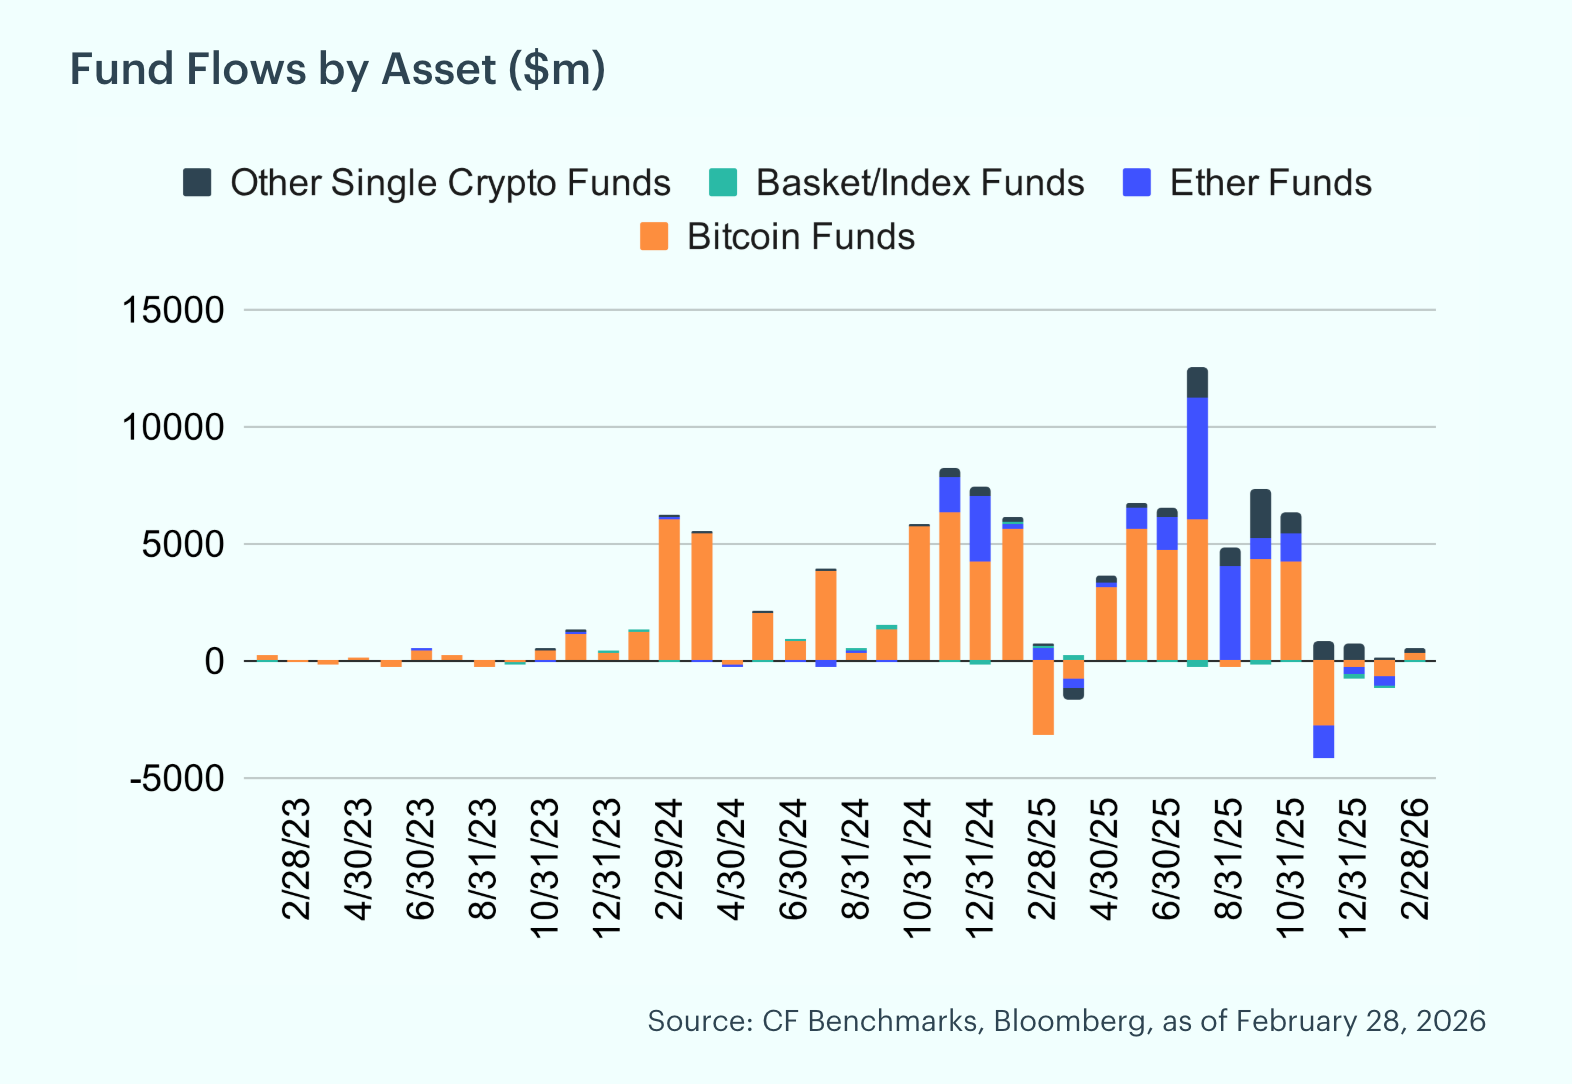
Fund Flows Reverse: February marked a notable reversal in fund flow dynamics, with digital asset funds recording approximately $484 million in net inflows after January's $1.0 billion in outflows. Bitcoin funds led the recovery with $327 million in inflows, while other single crypto funds attracted $195 million. Ether funds saw modest inflows of $5 million, while Basket/Index funds recorded $43 million in outflows. Regionally, inflows were broad-based, with North America contributing $271 million, Europe adding $240 million, South America at $43 million, and Asia Pacific at $38 million.
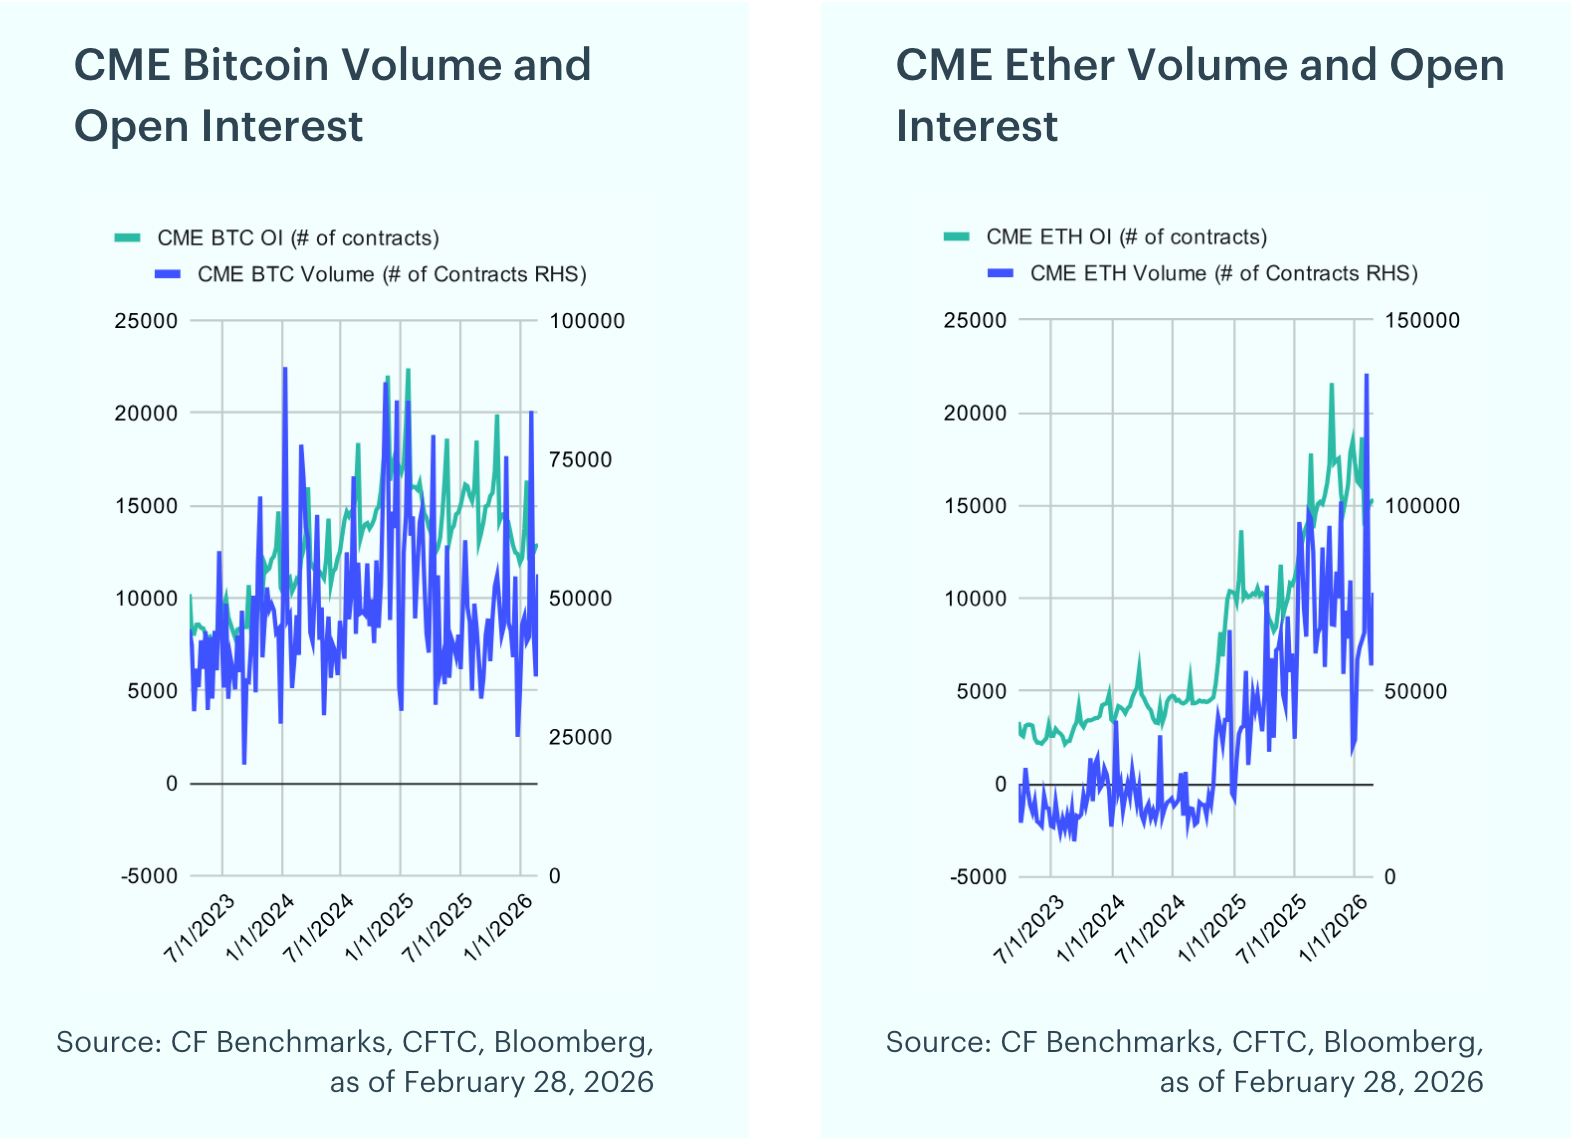
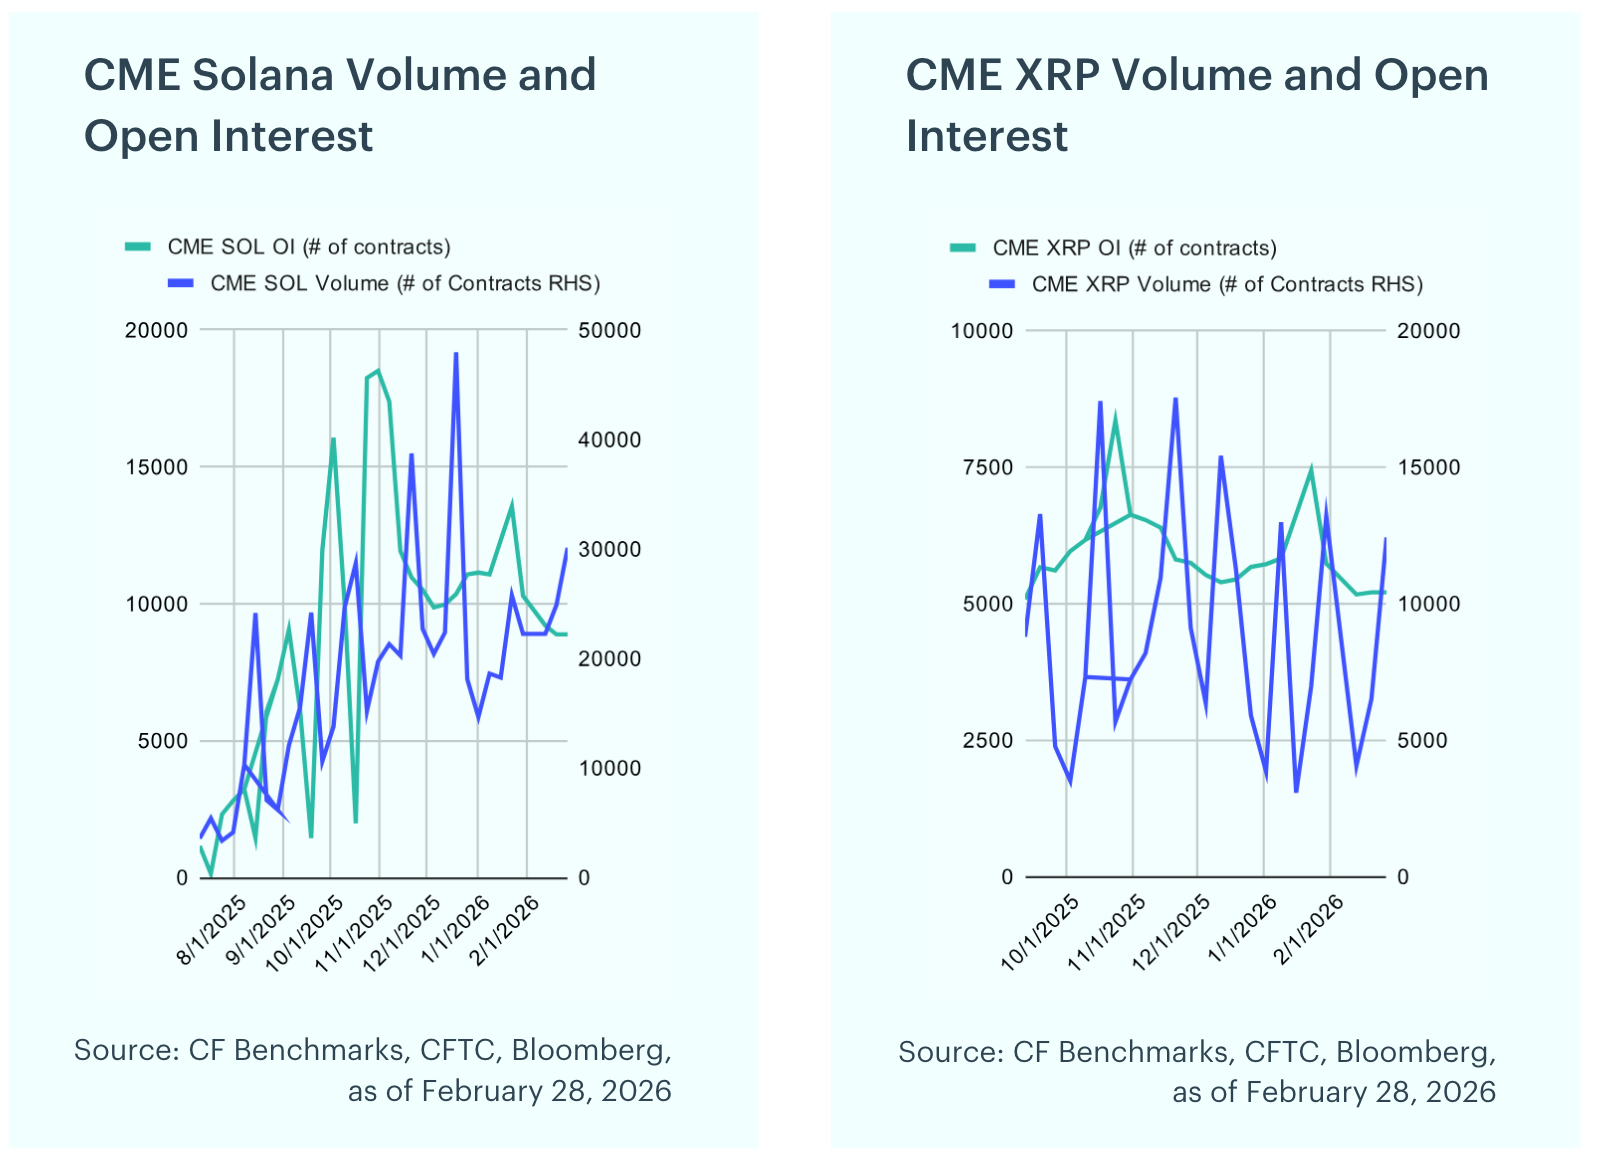
Futures Positioning Diverges: In February, open interest rose for Bitcoin (+5.4% to 12,853) and Ether (+6.4% to 15,330), while Solana (-13.9% to 8,880) and XRP (-9.2% to 5,207) declined. Peak volumes were recorded in early February: Bitcoin with 83,749 contracts, Ether 135,580 contracts, Solana 36,467 contracts, and XRP 13,515 contracts, coinciding with the peak volatility during the period.
Bitcoin Volatility Spikes: The CF Bitcoin Volatility Index Settlement Rate (BVXS) is a daily benchmark that provides a forward-looking, 30-day constant-maturity measure of implied volatility, derived from CFTC-regulated Bitcoin option contracts traded on the CME. The BVX reflects the fair strike of a variance swap. The BVX ranged from 49.07 to 76.60 in February, closing the month at 53.55. The 30-day z-score peaked at +4.47, indicating elevated volatility relative to historical norms as markets sold off sharply before stabilizing into month-end.
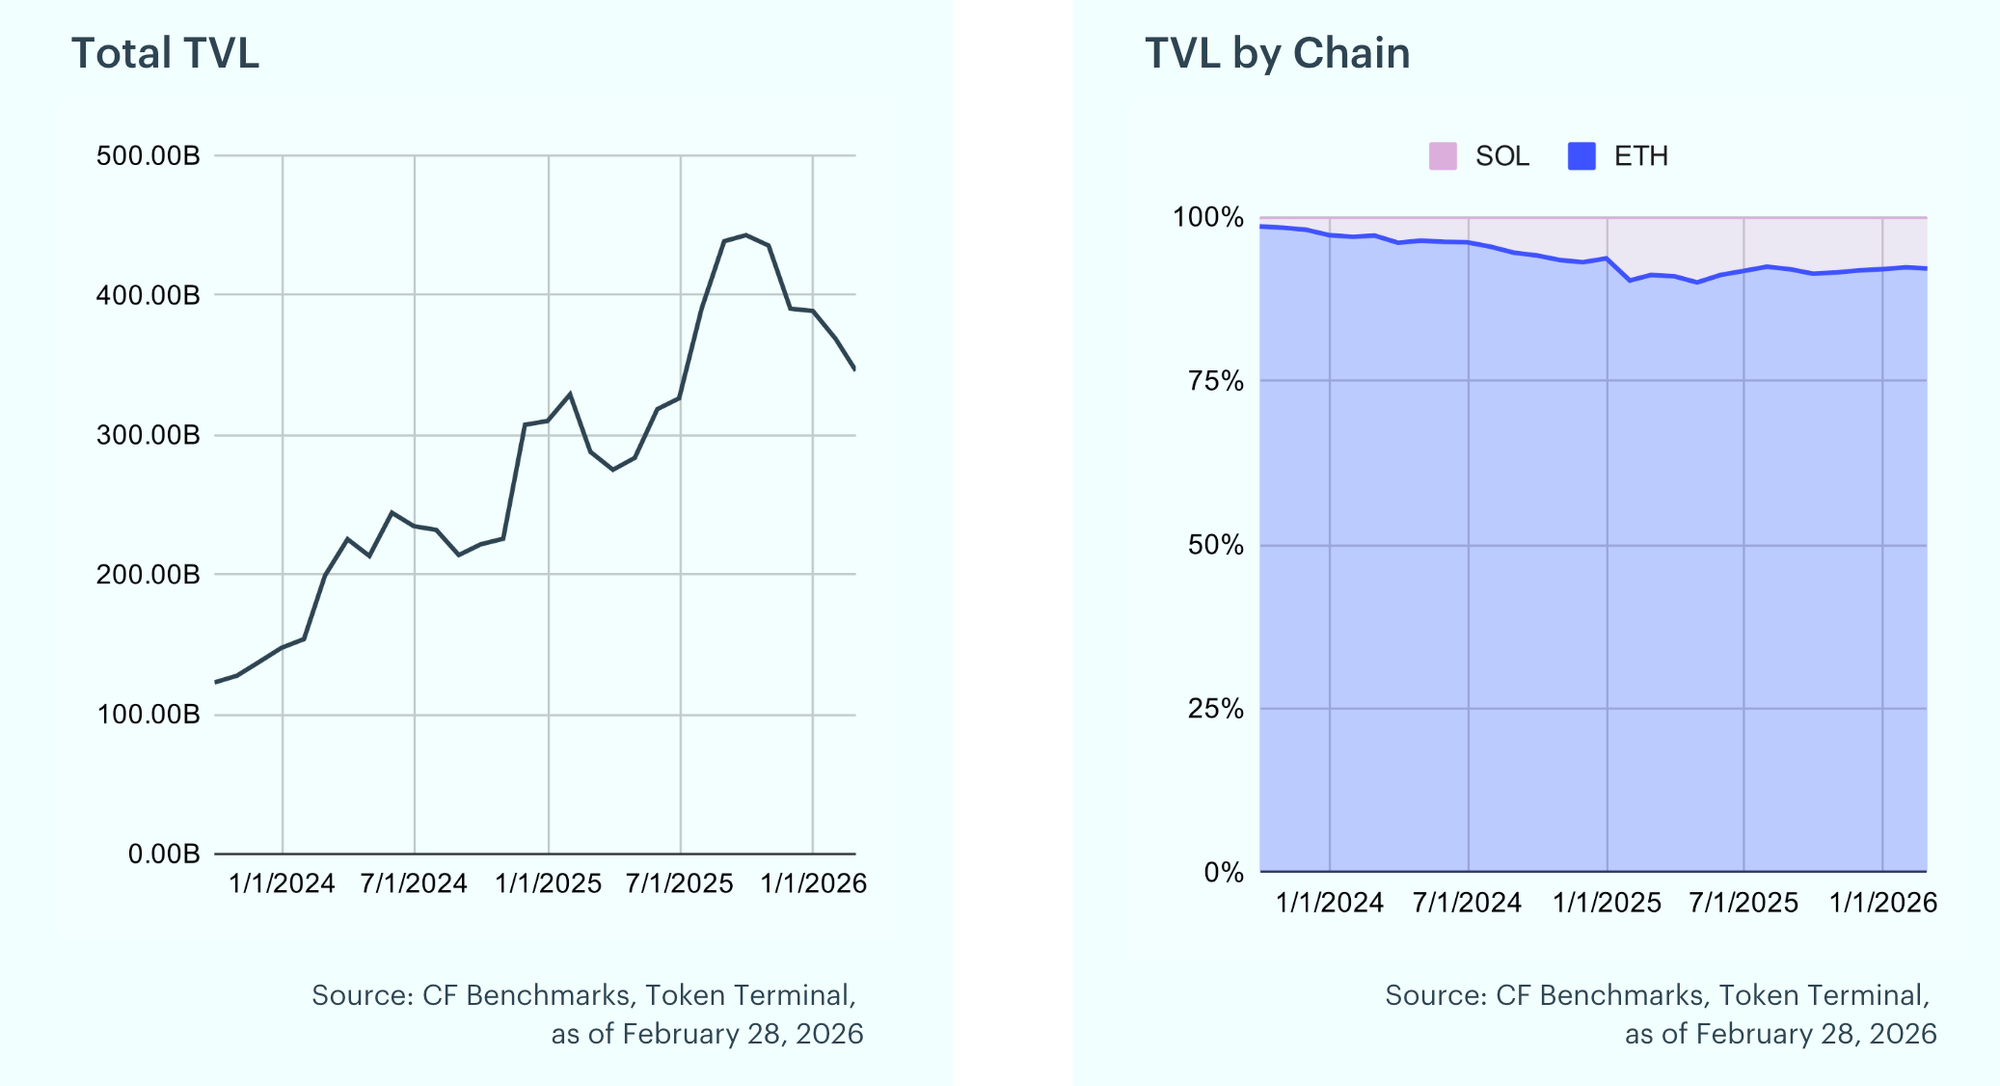
DeFi TVL Pulls Back: Total Value Locked declined 6.2% in February to $346.1B, down from $369.0B in January. The pullback reflects broader market weakness across DeFi protocols, with reduced user activity and lower asset valuations weighing on TVL across major chains.
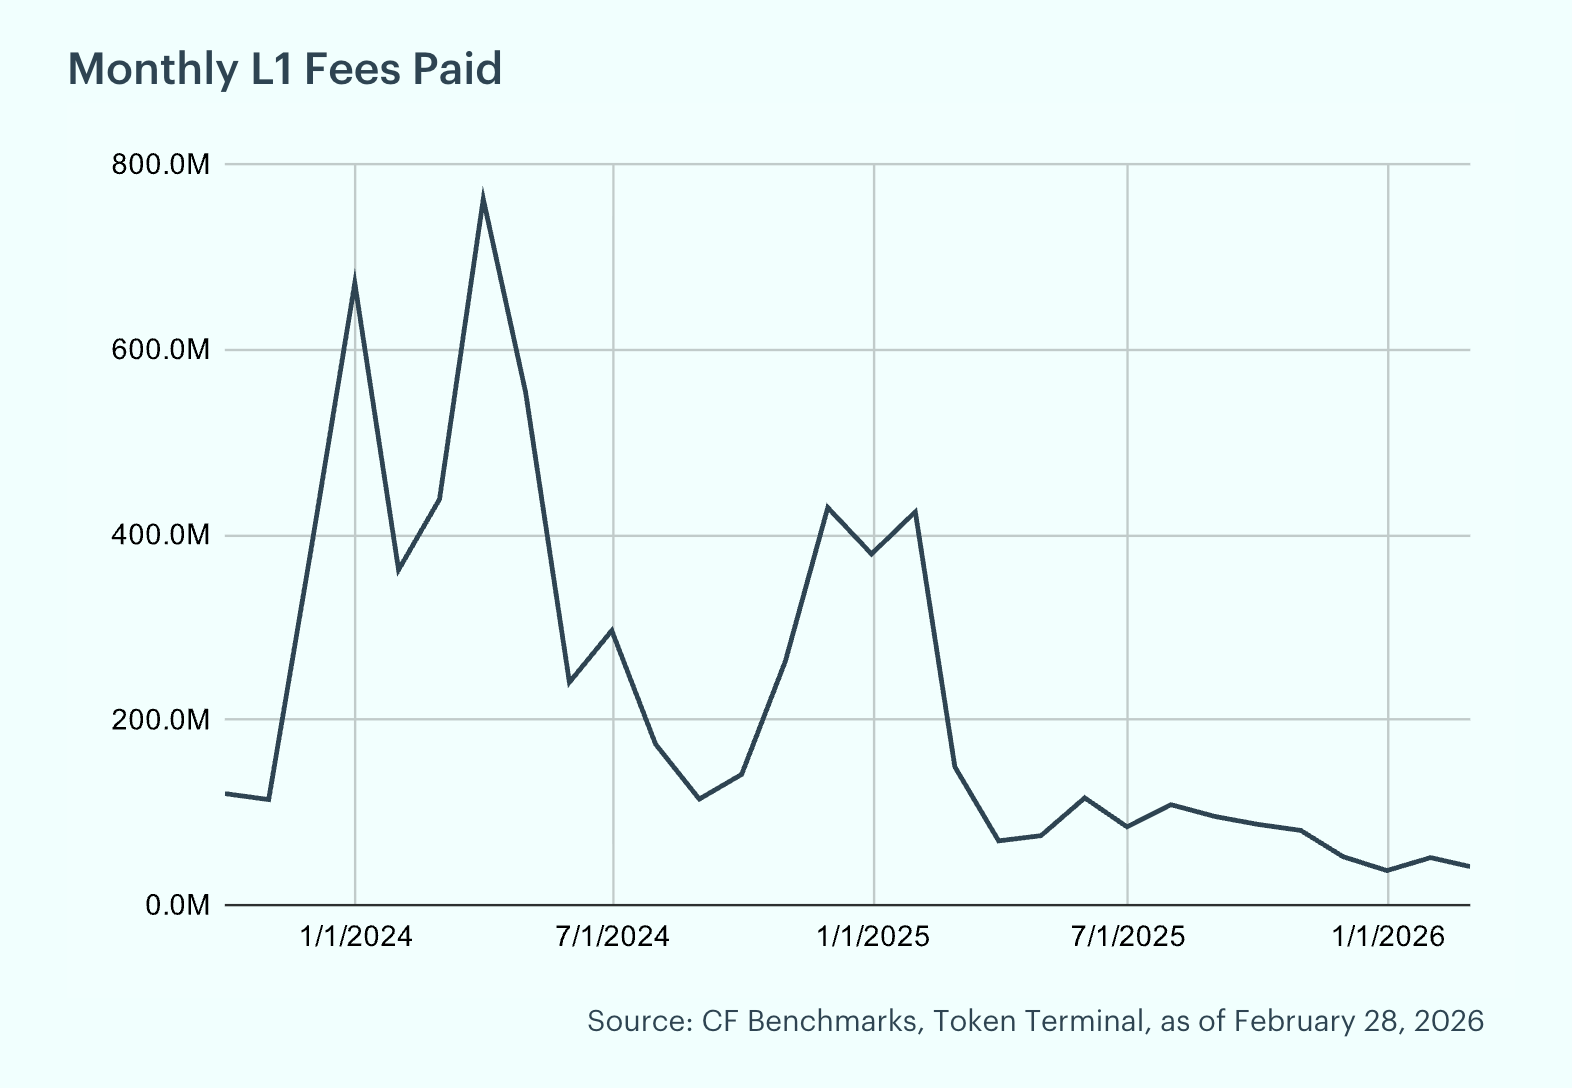
Layer-1 Fees Decline, Solana Still Leads: Fees are the charges users pay to record transactions and data on a blockchain and act as a gauge for demand to use these networks. They tend to rise when there is an influx of new users on-chain and can fall when activity wanes or scaling upgrades reduce costs. Total L1 fees declined to $41.5M in February from $51.2M in January. Solana led with $20.7M (49.9%), followed by Ethereum at $15.2M (36.8%) and Bitcoin at $5.5M (13.3%). The drop was driven primarily by lower activity on Solana.
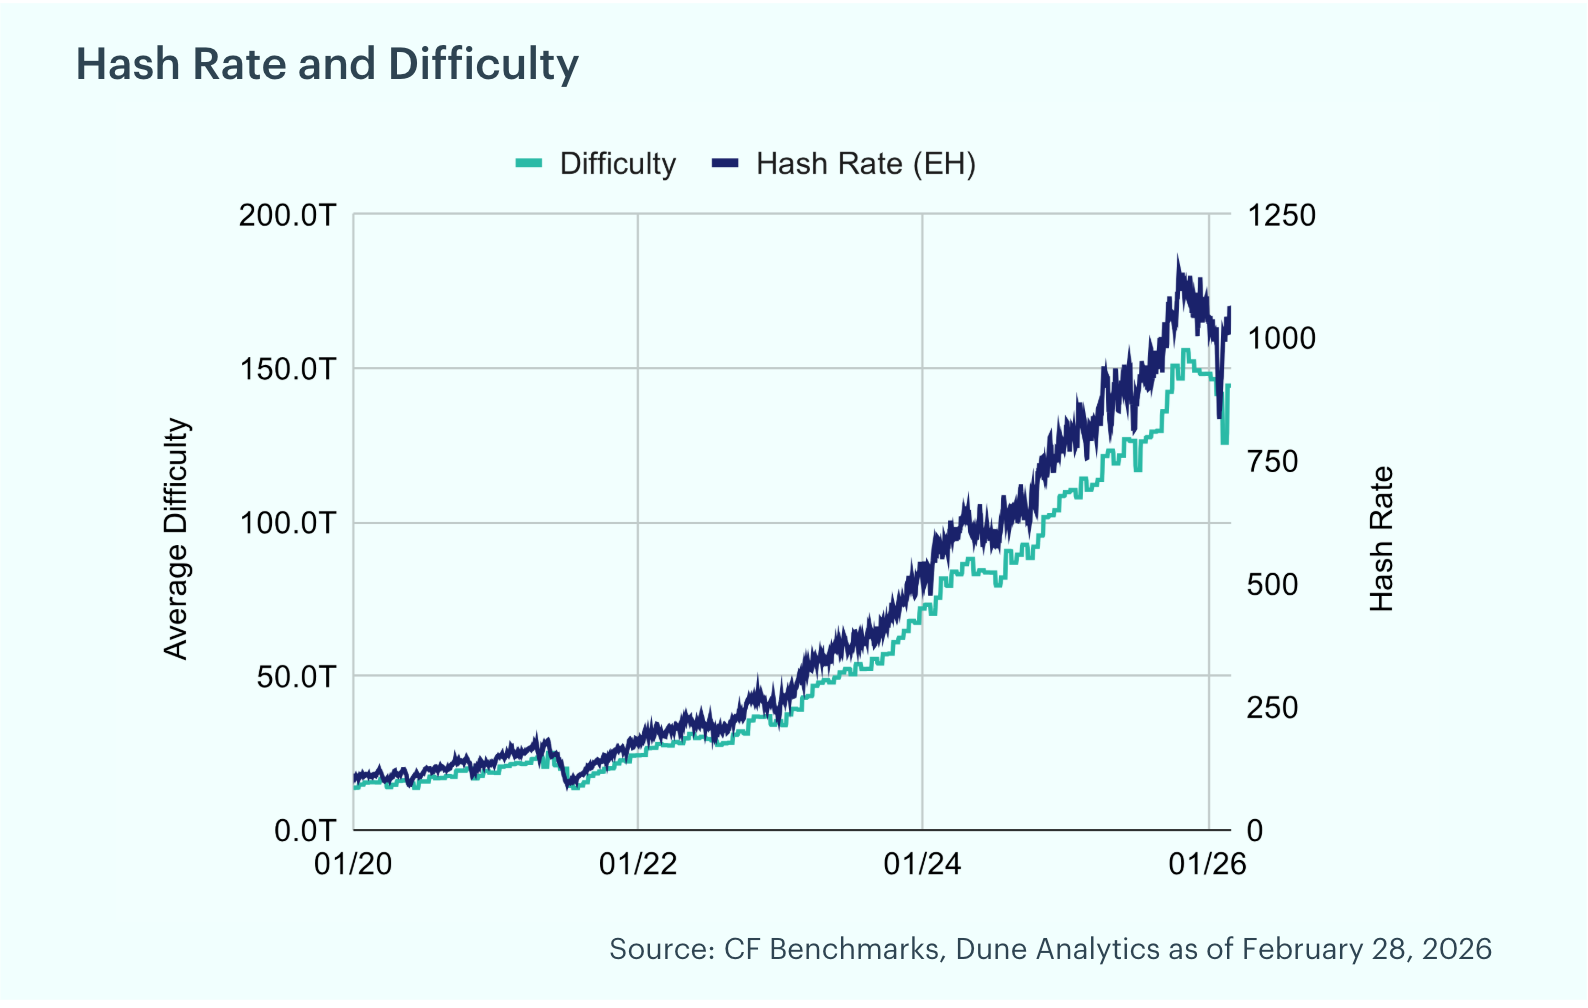
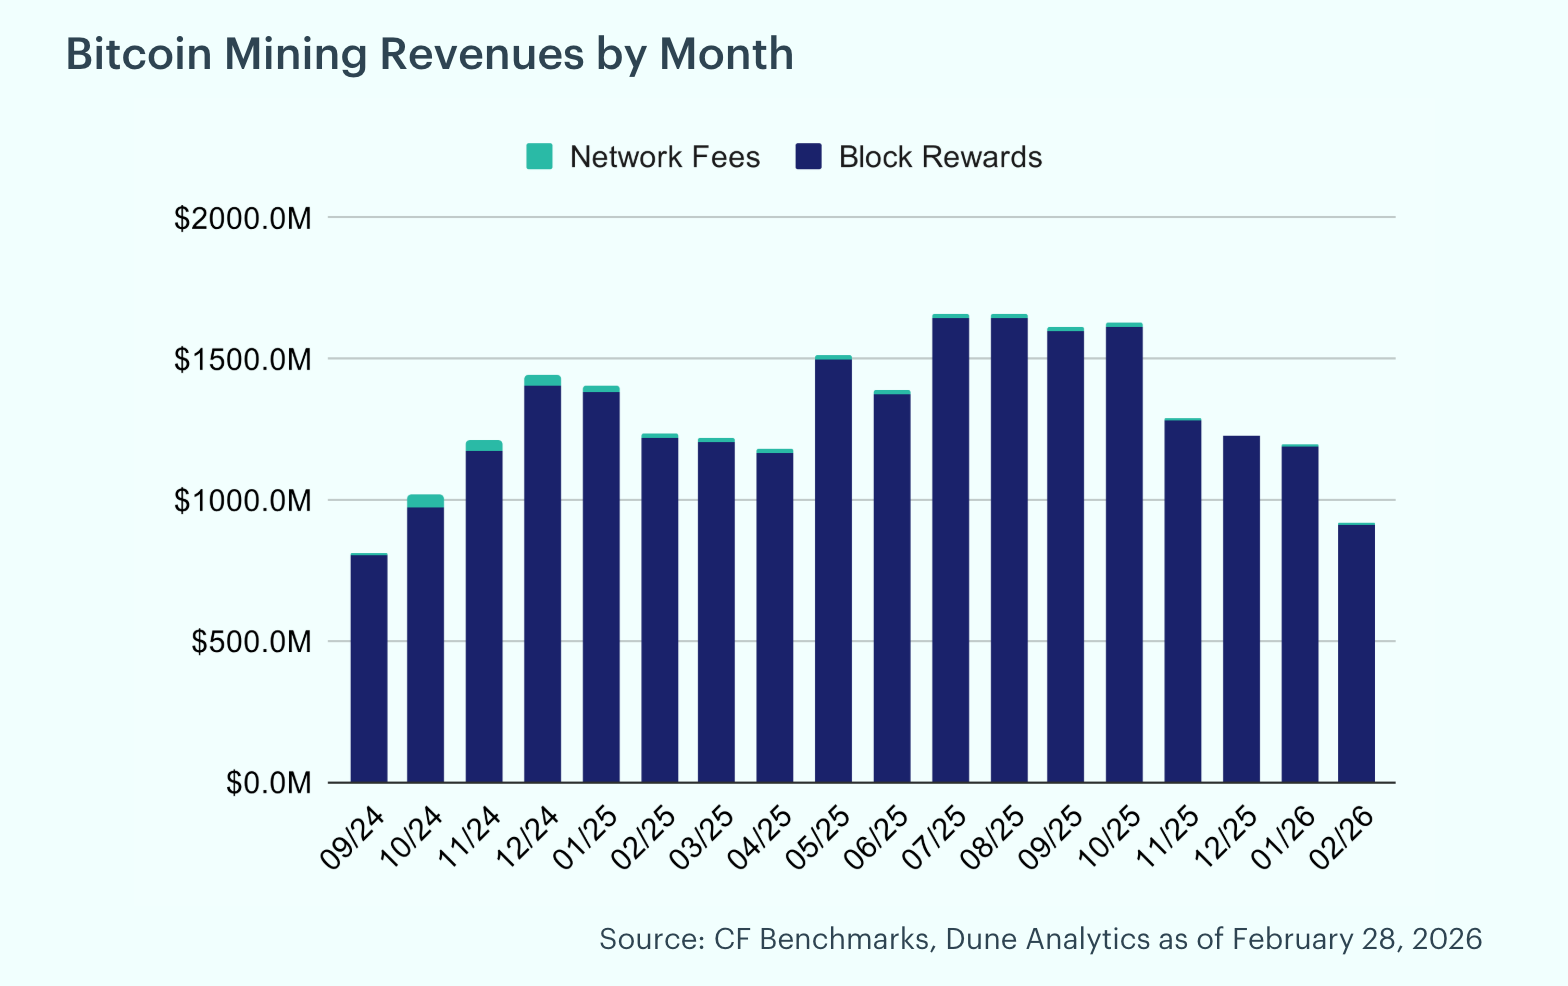
Hash Rate Rebounds, Mining Revenue Falls: Bitcoin's hash rate recovered strongly in February, rising 23.5% to 1,064 exahashes per second from 861 EH/s at January's end. Mining difficulty increased throughout the month, ending at 144.4T (+1.9%) as more computational power returned to the network. However, miners saw a 23.3% decrease in revenue, with total mining revenue of $918.0 million. Of the total rewards earned, 0.6% came from transaction fees, with block rewards totaling $912.5 million and fees contributing $5.5 million. The sharp decline was driven primarily by lower Bitcoin prices during the period.
To read the complete report, kindly click on the provided link (or click here to view a PDF version). Additionally, please do not forget to subscribe to our latest news and research for the most relevant institutional insights on digital assets and the top digital assets by market cap.
The information contained within is for educational and informational purposes ONLY. It is not intended nor should it be considered an invitation or inducement to buy or sell any of the underlying instruments cited including but not limited to cryptoassets, financial instruments or any instruments that reference any index provided by CF Benchmarks Ltd. This communication is not intended to persuade or incite you to buy or sell security or securities noted within. Any commentary provided is the opinion of the author and should not be considered a personalised recommendation. Please contact your financial adviser or professional before making an investment decision.
Note: Some of the underlying instruments cited within this material may be restricted to certain customer categories in certain jurisdictions.
Factor Friday - July 24, 2026
Beta's four-week grind higher stalled this week as style leadership rotated again: Momentum took the top spot, last week's leader Value fell to the bottom, and Growth stayed July's weakest factor. Size remains the only style factor positive on the year; beta, not style selection, is setting returns.

Mark Pilipczuk
Changes to the Token Market Price Benchmarks Series - Market Prices – 21 July 2026
The Administrator has confirmed changes to the Token Market Price Family for the period 14 July 2026 to 21 July 2026.
CF Benchmarks
Softer CPI Reprices July Hike Risk & Lifts Digital Assets
Digital assets extended their recovery over the past week as cooler US inflation prints repriced Fed expectations; the bid was broad across the large cap indices, growth factor leadership returned, stablecoin funding repriced lower, and stress stayed isolated in names hit by token-specific news.
Mark Pilipczuk
By clicking Accept, you consent to CF Benchmarks's use of cookies.
Visit Cookie Settings to learn how CF Benchmarks uses cookies and to adjust your preferences.