
Dec 01, 2025
Sell-Off Intensifies Amid Fed Uncertainty
Key takeaways for the month
November 2025 extended the risk-off turn, pushing digital assets deeper into correction territory. With December Fed cut odds fading, risk appetite deteriorated further, Bitcoin pulled back (falling into the lower $80K range), and crypto ETPs recorded some of their heaviest weekly outflows of the year. Volatility climbed sharply, and CME and CF Benchmarks delivered a timely launch of the CME CF Bitcoin Volatility Indices (BVX/BVXS)—providing allocators a standardized 30-day implied-vol gauge as hedging demand intensified. Meanwhile, market access and infrastructure progressed as the "second wave" of U.S. spot ETFs broadened access beyond BTC and ETH, even as hawkish policy signals dominated the downturn.
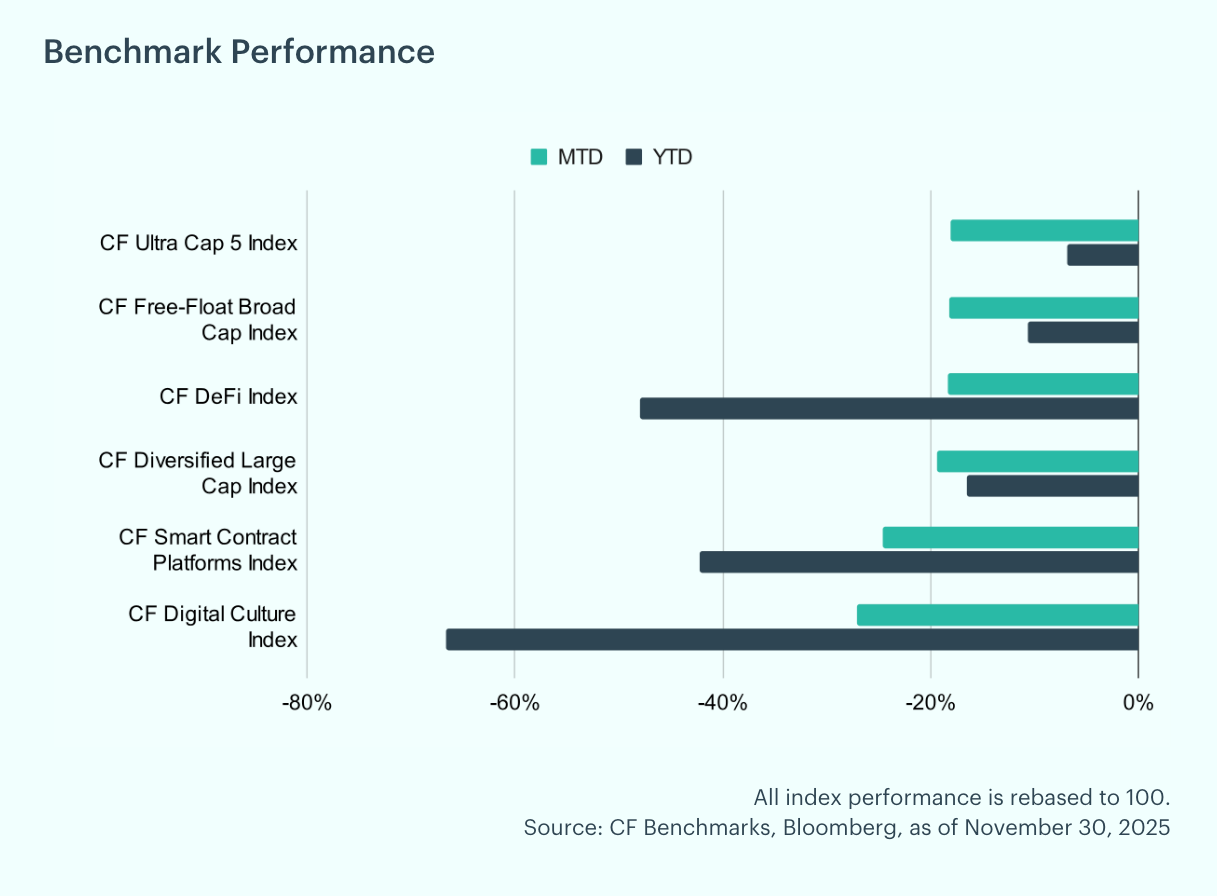
Indices posted steep declines: the CF Ultra Cap 5 fell 18.1% MTD (YTD −6.9%), the CF Free-Float Broad Cap dropped 18.2% (YTD −10.7%), and the CF Diversified Large Cap slid 19.5% (YTD −16.5%). Higher-beta segments led the selloff, with CF Smart Contract Platforms down 24.6% MTD (YTD −42.2%), CF DeFi off 18.4% (YTD −48.0%), and CF Digital Culture plunging 27.1% (YTD −66.6%). Performance dispersion widened as mega-cap cohorts proved relatively more resilient than niche segments. While month-end levels stabilized off intramonth lows, the indices closed November decisively lower across the board.
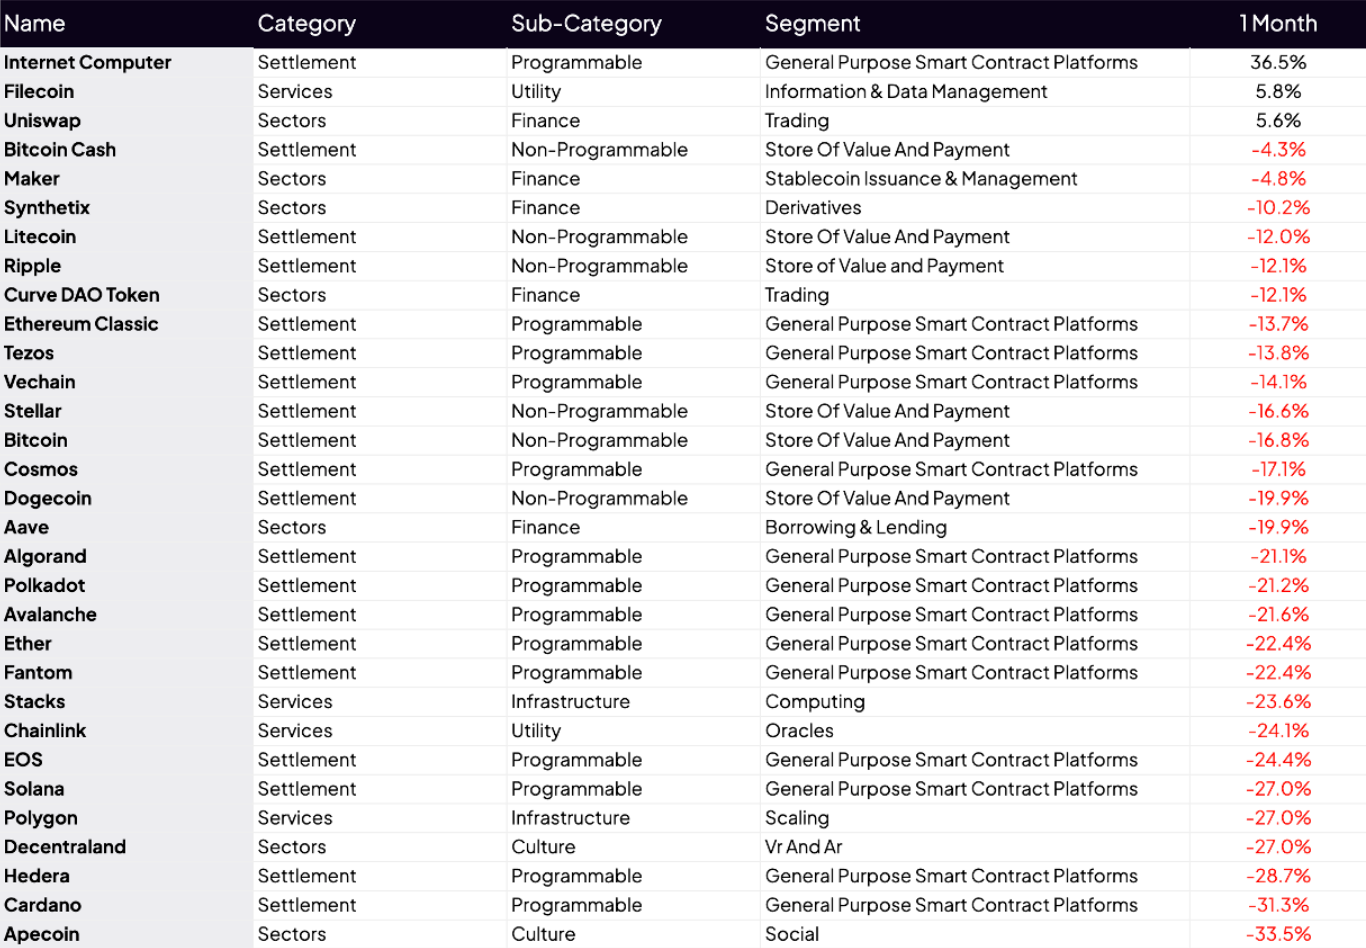
Individual Movers: Internet Computer (ICP) led the pack with a 36.5% monthly gain, driven primarily by aggressive token burns and sustained momentum for the AI narrative. Filecoin (FIL) followed, up 5.8% after announcing the Filecoin Onchain Cloud on November 18th. Uniswap (UNI) rounded out the top performers with a solid 5.6% advance, fueled by the fee-switch proposal and a 100 million UNI burn. Apecoin (APE), Cardano (ADA), and Hedera (HBAR) were the weakest performers over the past month, down 33.5%, 31.3%, and 28.7%, respectively. APE faced ongoing token unlocks, Cardano struggled with a brief outage, and Hedera was hit by continued liquidations in the alt-coin market.
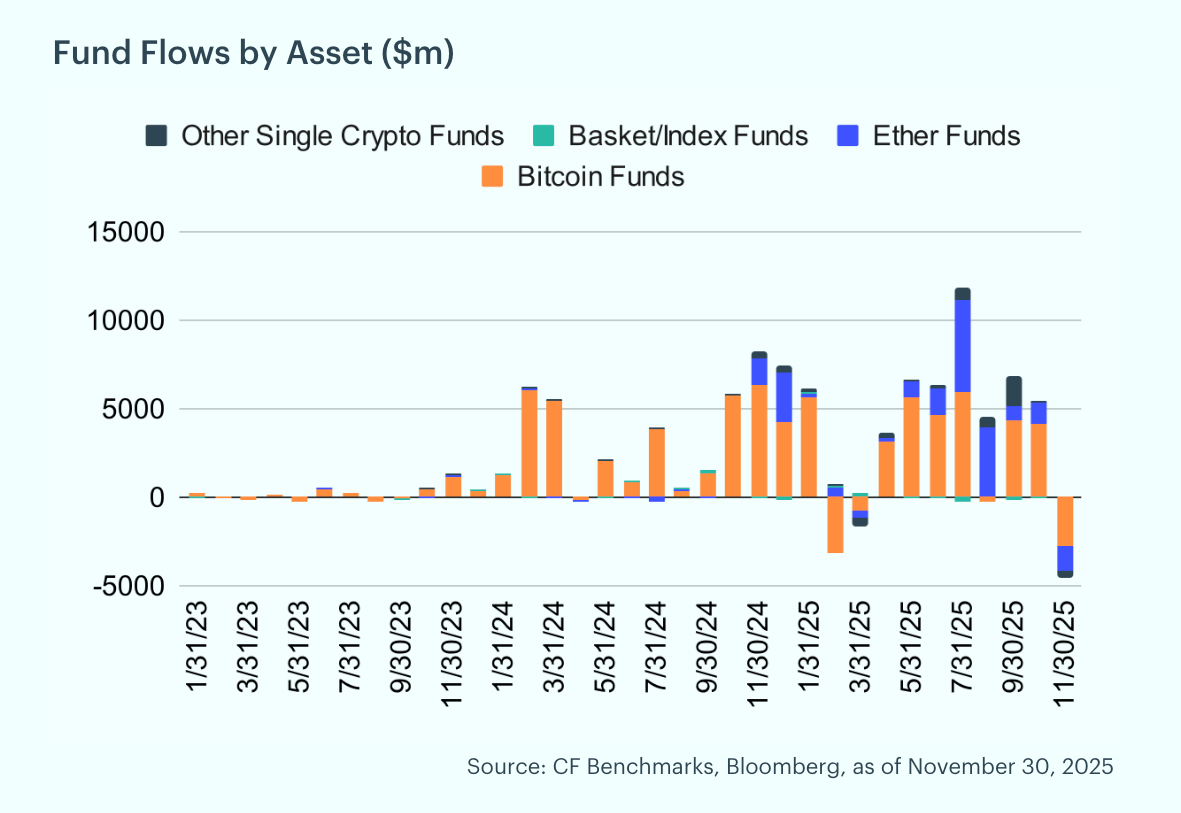
Fund Flows Exodus: November recorded significant outflows from digital asset funds, with investors redeeming roughly $4.5 billion. Bitcoin represented the lion's share at $2.8 billion, while Ether trailed at $1.4 billion. Regionally, North America drove the bulk of redemptions at approximately $4.4 billion, compared with Europe's $213 million, underscoring the concentration of selling pressure in U.S. markets.
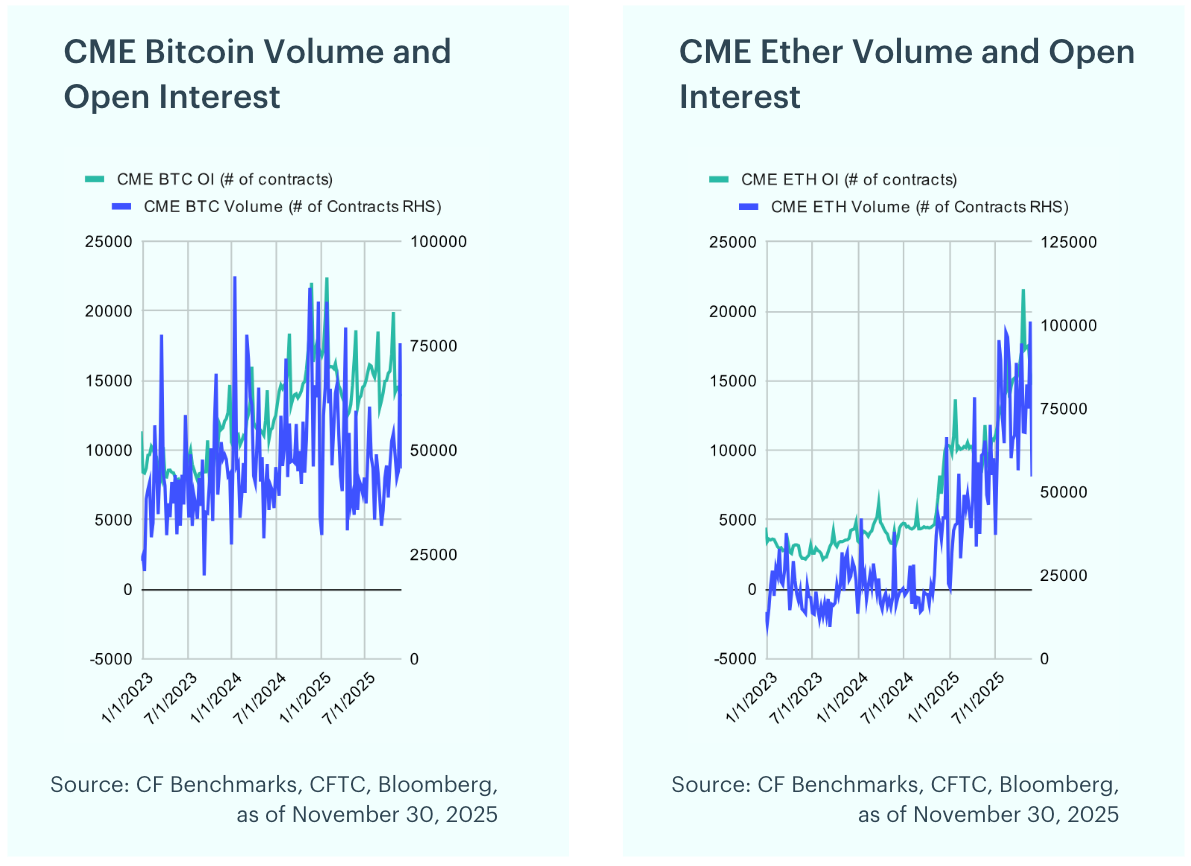
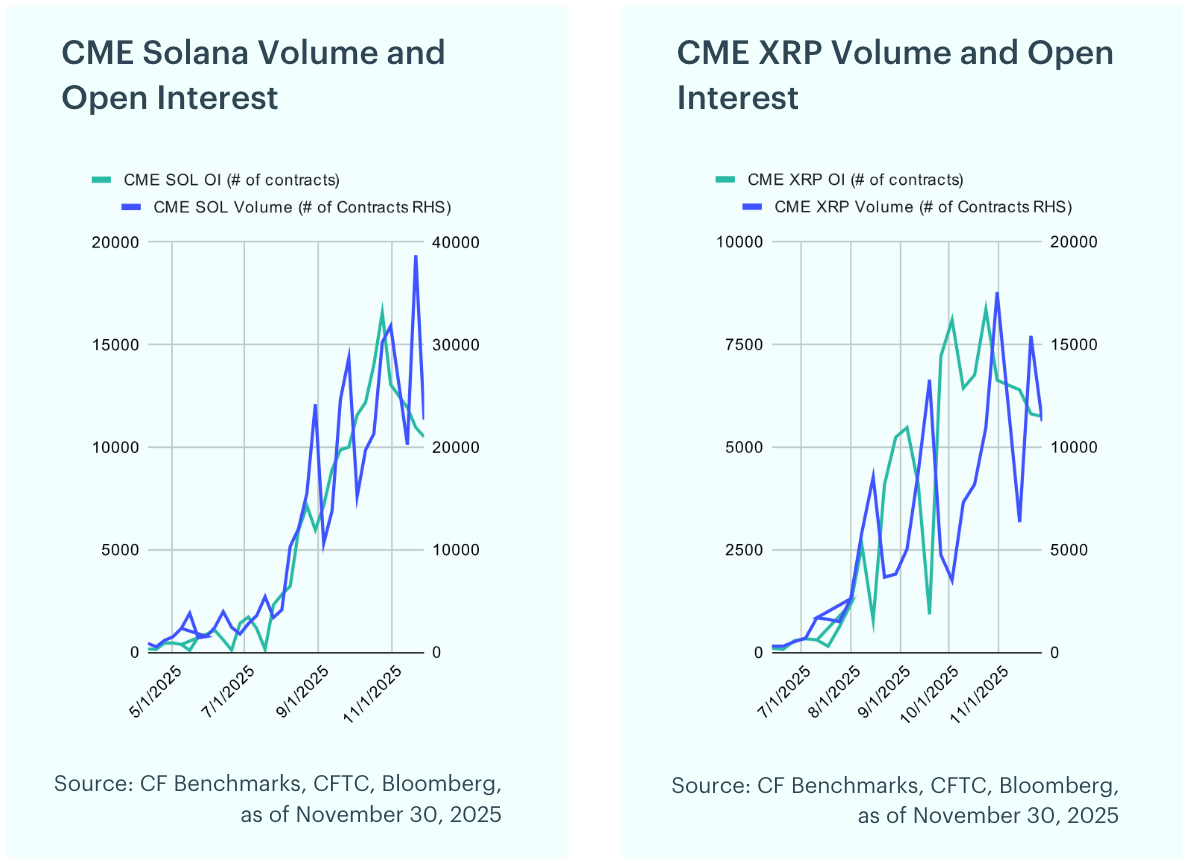
Futures Cool After Record October: Bitcoin futures saw a modest decline in open interest during November, slipping 0.8% from 14,157 to 14,029 contracts. Ether futures registered a steeper drop, with open interest falling 14.9% to 14,708 contracts despite robust trading activity that peaked at 101,130 contracts toward month-end. Meanwhile, Solana and XRP futures posted similar pullbacks following a record October: Solana's open interest declined 19.4% to 10,509 contracts as volumes exceeded 38,000 contracts, while XRP's open interest fell 13.3% to 5,745 contracts with volumes ticking modestly higher.
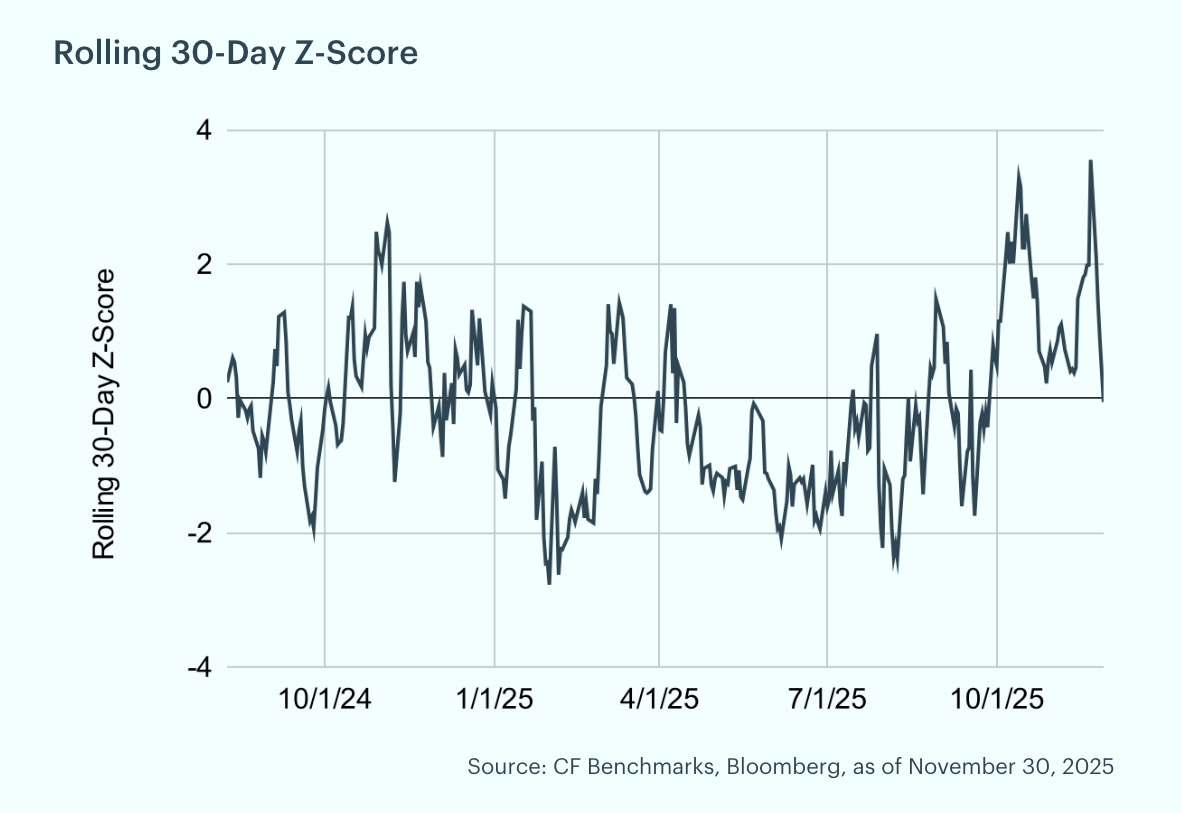
BVX spikes again: The CF Bitcoin Volatility Index Settlement Rate (BVXS) is a daily benchmark that provides a forward-looking, 30-day constant-maturity measure of implied volatility, derived from CFTC-regulated Bitcoin option contracts traded on the CME. The BVX reflects the fair strike of a variance swap. Over the past month, the BVX ranged between 38.1 and 52.0. During this period, volatility increased materially, with the BVX recording a 3.2 sigma move (based on our rolling 30-day z-score) around mid-month.
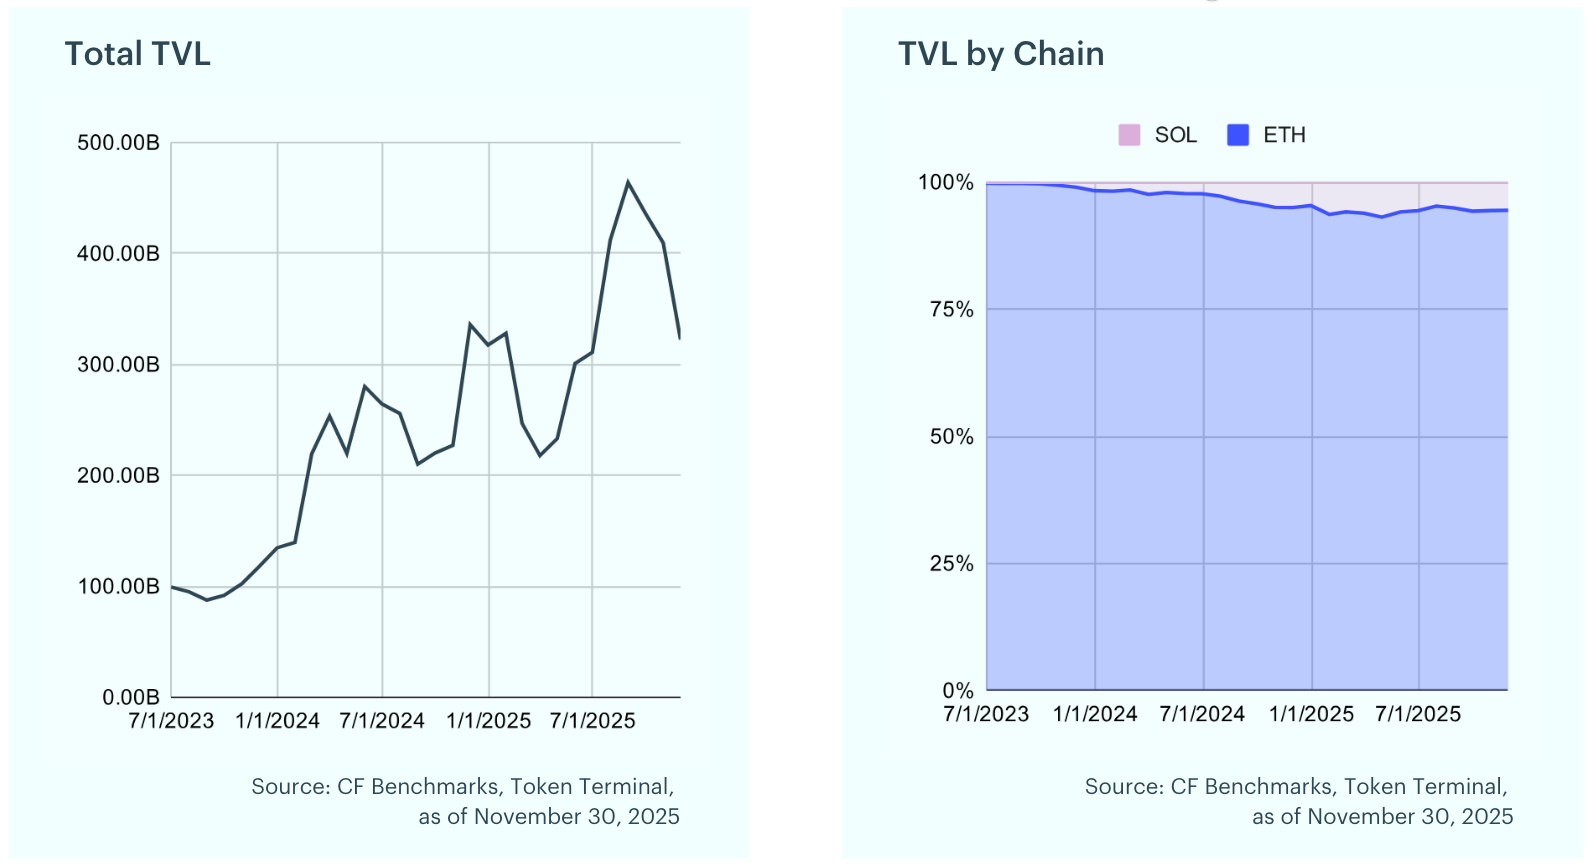
TVL Slides 21% Post-Summer Rally: Total Value Locked (TVL) in decentralized finance (DeFi) represents the aggregate value of assets deposited across DeFi protocols, expressed in U.S. dollars. It serves as a key indicator of the sector’s overall health and growth. Over the past month, total DeFi TVL declined by 21.2% to approximately $322 billion, as momentum continued to slow amid pullbacks in Ether and Solana following their summer rallies.
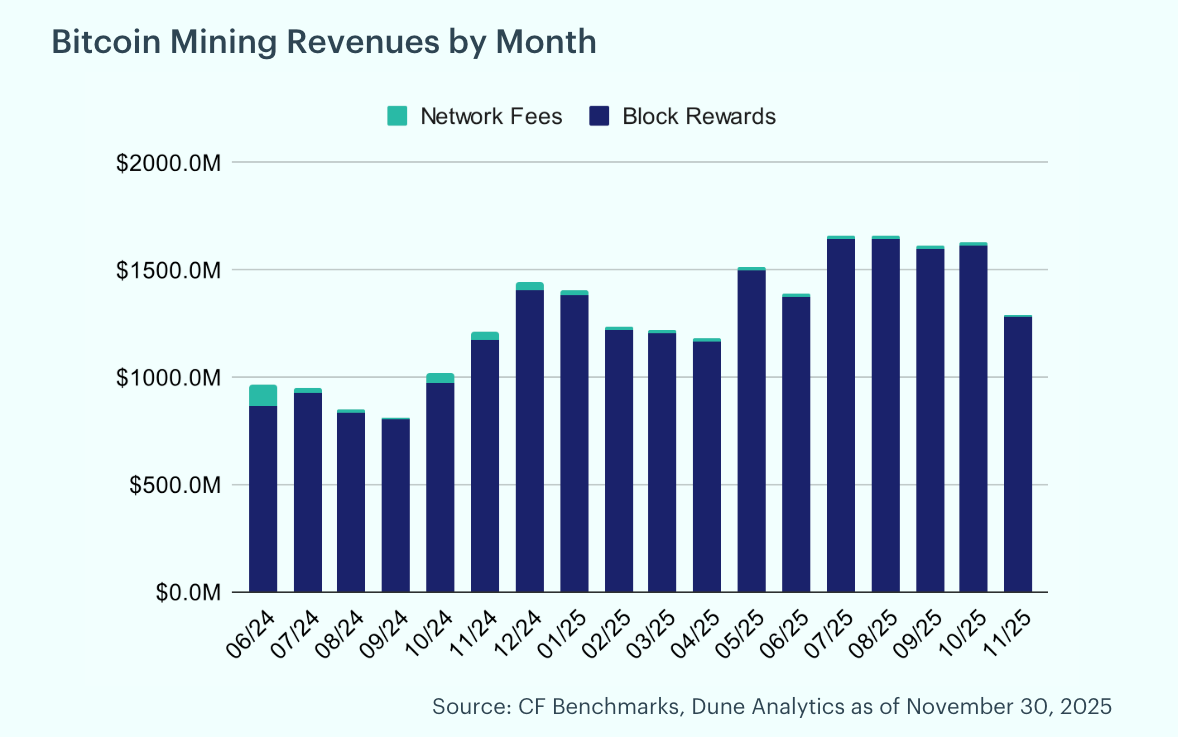
Miner Revenue Drops 20% on Price Pressure: Bitcoin miners saw a 20.5% decrease in revenue in November. Of the total rewards earned during the month, 0.6% came from transaction fees, down from 0.7% in October. The steep decline in revenue was driven primarily by Bitcoin’s price movements during the period.
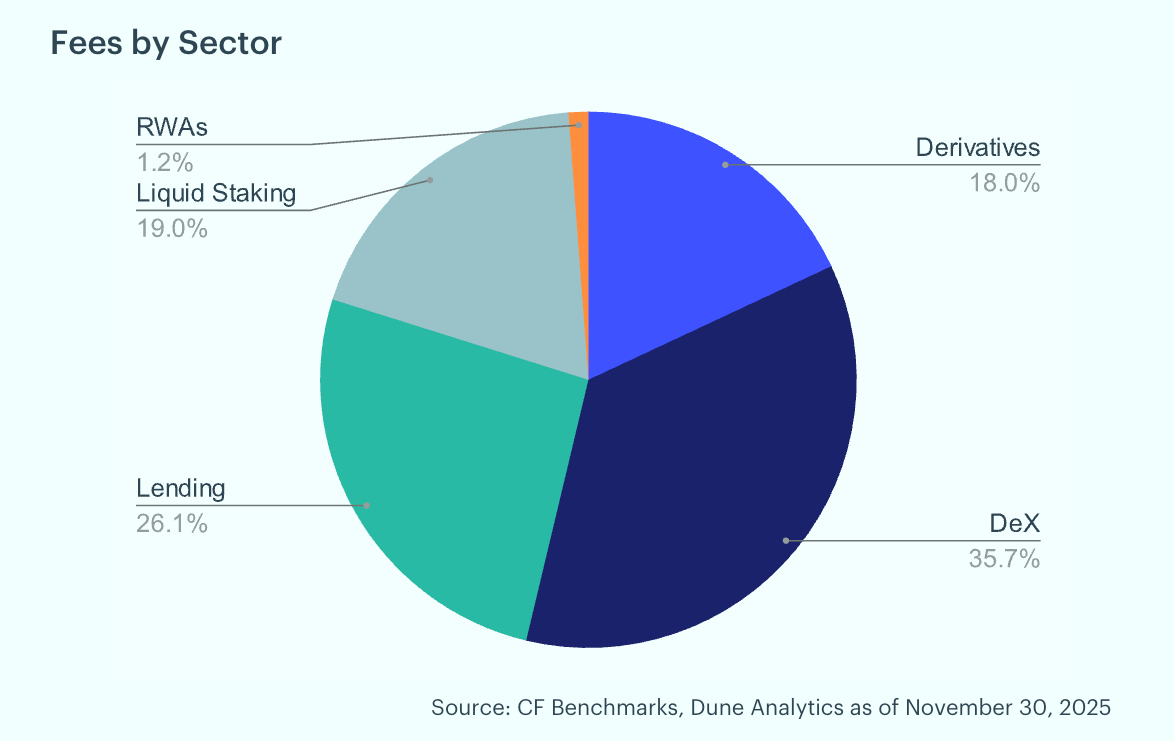
Network Activity Cools, DEXs Lead: Analyzing Ethereum’s total fees and their sector composition provides insight into the use cases driving network revenue. Ethereum layer-1 fees dropped 43.0% month-over-month, falling to $23.6 million in November from $41.4 million in October. Decentralized exchanges accounted for the largest share at 35.7%, followed by lending protocols at 26.1% and liquid staking at 19.0%. Derivatives contributed 18.0%, while real-world asset tokenization represented just 1.2%, underscoring the continued dominance of DEX activity in network fee generation.
To read the complete report, kindly click on the provided link (or click here to view a PDF version). Additionally, please do not forget to subscribe to our latest news and research for the most relevant institutional insights on digital assets and the top digital assets by market cap.
The information contained within is for educational and informational purposes ONLY. It is not intended nor should it be considered an invitation or inducement to buy or sell any of the underlying instruments cited including but not limited to cryptoassets, financial instruments or any instruments that reference any index provided by CF Benchmarks Ltd. This communication is not intended to persuade or incite you to buy or sell security or securities noted within. Any commentary provided is the opinion of the author and should not be considered a personalised recommendation. Please contact your financial adviser or professional before making an investment decision.
Note: Some of the underlying instruments cited within this material may be restricted to certain customer categories in certain jurisdictions.
Changes to the Token Market Price Benchmarks Series - Market Prices – 07 July 2026
The Administrator has confirmed changes to the Token Market Price Family for the period 30 June 2026 to 07 July 2026.

CF Benchmarks
Bitcoin-Led Drawdown Moves the Market Lower
The CF Free-Float Broad Cap Index fell 18.29% in June as a Bitcoin-led drawdown overwhelmed a thinning tape. Record ETF outflows, a rare Strategy sale, and a delayed Ethereum upgrade left Settlement assets supplying nearly the entire loss, with diversification offering little cover across the suite.
Mark Pilipczuk
Non-Programmable Tokens Lead Rebound as Hedging Demand Softens
Digital assets rebounded broadly over the past week as a soft US jobs print pared rate-hike fear and ETF flows turned positive. Payments and settlement names led, breadth favored diversified exposure, implied volatility compressed, and Bitcoin front-end funding eased toward its term curve.
Gabriel Selby
By clicking Accept, you consent to CF Benchmarks's use of cookies.
Visit Cookie Settings to learn how CF Benchmarks uses cookies and to adjust your preferences.