
Nov 29, 2025
CF Benchmarks Newsletter Issue 96
Boomers
‘This is not your grandfather’s Bitcoin market’. Obviously. Or is it? Given the evolution of market structure and the changing distribution across investor cohorts over the last decade, and the impact this is having on aggregate investor behavior, the typical sentiment behind the idiom misused above (i.e., progress) can pretty much stand.
But it’s also true that institutional holders of the most popular spot Bitcoin ETF in the world, BlackRock’s IBIT (benched to our BRRNY) are still less than 30% of the total (Q3 13F filings point to ~29%) with retail deemed to be circa ~71%. Yet despite this, holders did not react to recent torrid market conditions in typical ‘retail’ fashion, according to Bloomberg’s Eric Balchunas. He tweets here: “+$130m of inflows” surged into U.S. Bitcoin ETFs on November 26th alone, with “Boomers hanging tough in the face of a fire they didn’t start.” Your grandfather’s Bitcoin market after all, perhaps.
Interesting to think that even at $70.4 bln AuM, $IBIT institutional hldrs are still <30% ... not sure retail necessarily has an age! But if behavior's quite stable now, it'll be even steadier as insto hldgs rise https://t.co/34d7oTD5y1
— Ken Odeluga (@TheSquareMile) November 20, 2025
Bitcoin's worst drawdown of the year
Ahead of the relaunch of our CME CF Bitcoin Volatility Index within the CME CF family, the gauge offers mixed signals about prospects for a near-term return of risk appetite
Regardless of how sanguine IBIT holders may be, drawdowns aren’t particularly enjoyable. So, whether signs of relief that emerged towards the end of Wall Street’s holiday-shortened week presage a fleeting rebound or not, now is as fitting a time as any for a rough and ready appraisal of the impact on sentiment.
BTC stabilizes
Bitcoin had stabilized to stand at the $92k handle at the time of writing on Friday November 28th, a rise of some 12.6% from a print by the regulated CME CF Bitcoin Real Time Index (BRTI), at $81,897.6 on the Friday of a week before (at around 12:15 UTC) a 7-month low.
CME Bitcoin implied vol. eases
Meanwhile, Bitcoin implied volatility as measured by the CF Bitcoin Volatility Index – Settlement (BVXS) – our exclusive, once-a-day, UK-BMR-compliant measure of 30-day CME Bitcoin implied vol. – was still relatively elevated, settling at 48.95 ahead of publication.
Consistent with potentially easing risk aversion though, BVX was on a steeply declining path compared to its peak above 60 on Friday 21st November, its highest reading since March.
Analyzing BVX
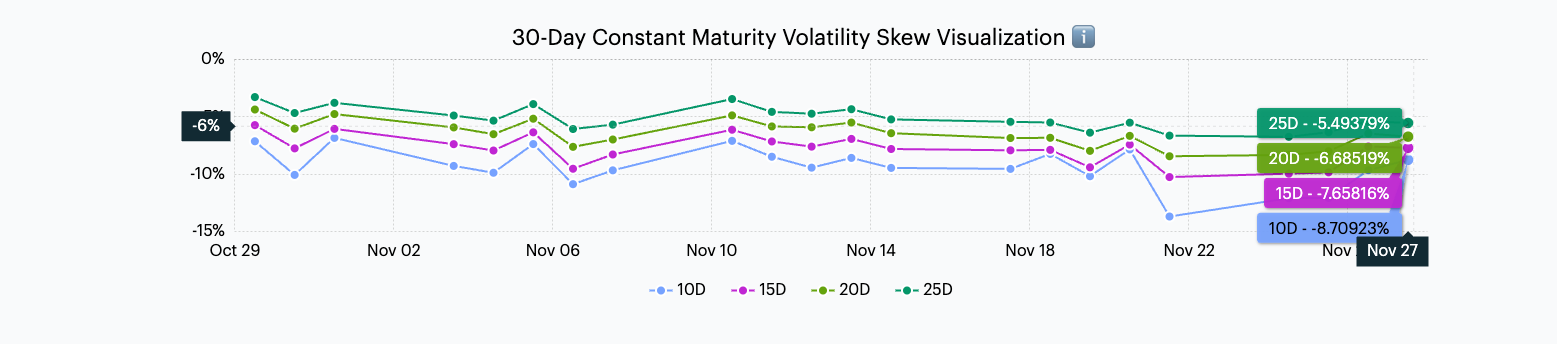
As well as line charts for BVXS and its live streaming variant, CF Bitcoin Volatility Index - Real Time (BVX), our BVX/BVXS pages host several professional-grade models, with which anyone can analyze implied volatility within Bitcoin’s primary CFTC-regulated options chain.
They include the 30-day constant maturity skew visualization - as seen below. At the time of writing, skew remained negative across all deltas, 10, 15, 20 and 25. That said, dispersion was visibly tighter versus mid‑November extremes. 30-day expectations signaled maintained though not escalating appetite for 'crash insurance'; another indication that's consistent with improving risk appetite.
Restive risk rebound
At best though, for now, the BVX complex looks more supportive of a rangebound recovery than an outright melt‑up. Downside protection would still be bid, judging by the indicators on our BVX page, with upside convexity looking comparatively inexpensive, typical of risk‑managed positioning. The putative checklist for a durable low—lower IV, term structure back to contango, skew nearer neutral—has been partially met (IV has eased from the spike; and skew is less extreme), but not conclusively so, as yet.
Fed moods
The effect of one initial catalyst for the most recent leg lower, a sudden onset of pessimism on rate expectations following comments by Fed chair Powell, continued to fade into the weekend. Swap trading-implied chances of a cut at the FOMC’s December meeting stood near 80% by Friday, from below 30% a week before, having spiked in reaction to the release of delayed September payrolls data. Also responding to comments by the president of the New York Fed, John Williams, which appeared contrary to the rate cut timing signaled by Powell.
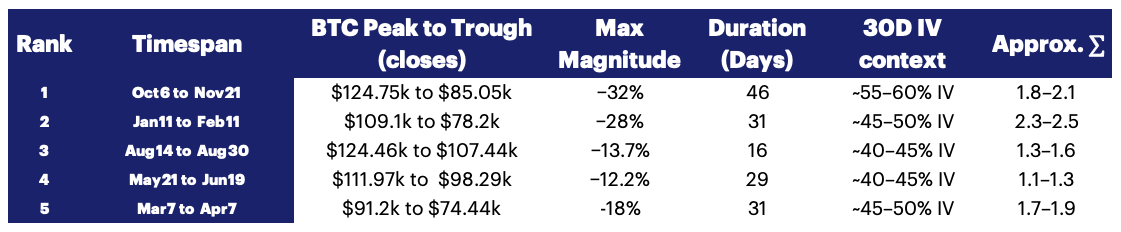
Bitcoin drawdowns 2025
Still, it’s worth noting Bitcoin’s current mild bounce follows a selloff during which it exhibited quantitatively its worst bout of volatility of the year, as shown below.
Challenging futures
As such, prospects for a quick recovery of risk seeking may be touch and go. Indeed, even limiting ourselves to the most rudimentary price technicals widely monitored by traders, it’s unsurprisingly a challenging picture that emerges. The proxy illustrated below is a continuation chart of front-month CME Micro Bitcoin futures (MBT) – which of course settle to BRR.
CME Micro Bitcoin futures (MBT) – March to November 2025
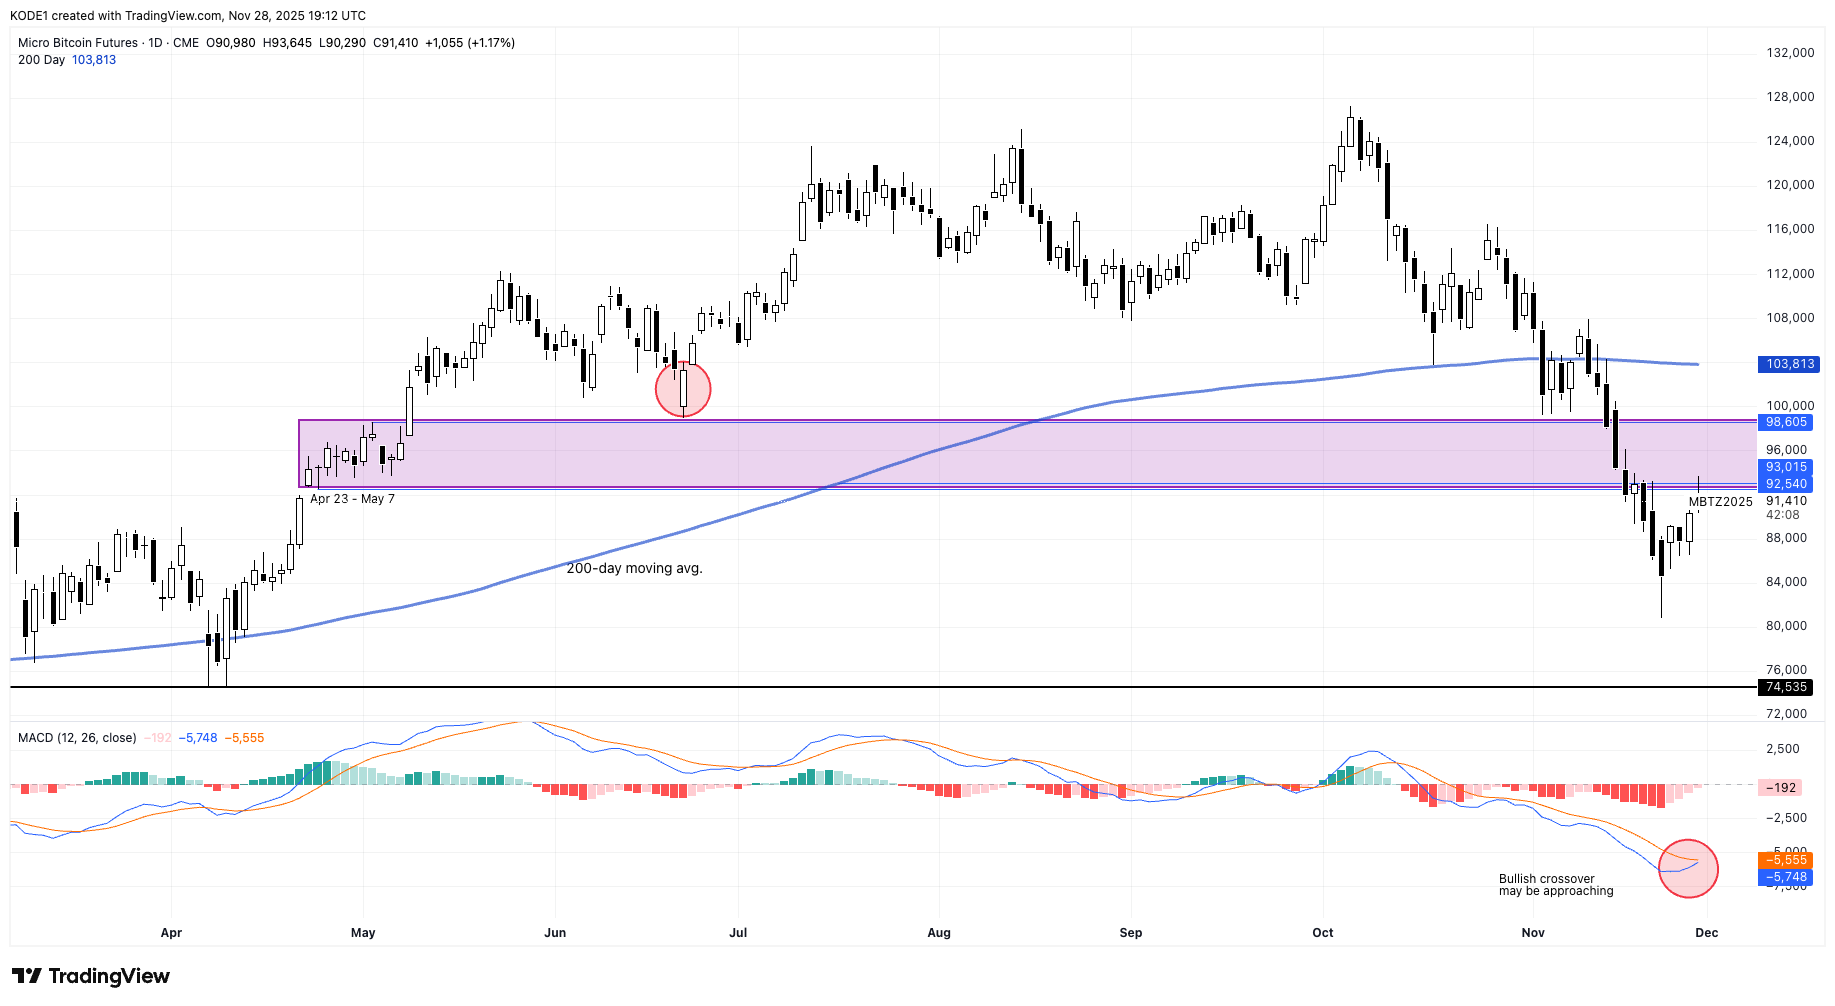
Following one of Bitcoin’s least wobbly weeks for around two months, at the time of writing, prices remained shy of the simplest gauge of medium-term relative strength, the 200-day moving average. Meanwhile, BTC had recouped back to the $92k-$98k range, a region of tell-tale consolidation between late-April and early-May. It's likely the area now contains a higher concentration of stops. More hopefully, the MACD histogram had compressed back toward zero, while MACD itself (blue) approached the signal line (red) for a potential bullish crossover. Even if that materializes though, a relapse would not be out of the ordinary.

BlackRock's IBIT launches in Australia
The largest U.S. spot Bitcoin ETF in terms of assets under management, the iShares Bitcoin ETF (IBIT) has seen a key cross listing overseas, with the launch of the ETF on Australia's ASX on November 14th.
The launch marks the latest expansion BlackRock's offering of exchange traded Bitcoin exposure beyond the U.S., where IBIT quickly became the most successful ETF listing in the history of the product class following its launch in January 2024.
In October, BlackRock's iShares Bitcoin ETP (IB1T) was listed on the London Stock Exchange, becoming one of the first crypto asset ETPs to trade on Britain's key equity trading venue, and the first UK-listed digital asset fund to be issued by the world's largest ETF provider.
Unlike IB1T though, the BlackRock Bitcoin fund stock now available on Australia's ASX, shares the same ticker as the stock that trades on the U.S. Nasdaq exchange - IBIT. That's because the ASX-traded shares are a true cross listing of the same fund, while IB1T is an adjacent but separate fund entity.
Either way, both funds reference CF benchmarks indices for NAV calculation: for IB1T, BRR, while IBIT tracks our 4:00 PM New York Time Bitcoin price, BRRNY.
Click below to watch a video of highlights from IBIT's ASX listing ceremony!
CF Bitcoin Volatility Index - Settlement (BVXS) Explainer
Responding to the need for a singular, comprehensive gauge of CME Bitcoin options implied volatility, CF Benchmarks launched the CF Bitcoin Volatility Index (BVXS) in April 2024. It remains the only true barometer of volatility based on the primary CFTC-regulated Bitcoin options chain.
As outlined above, next month, both BVXS and its streaming real-time variant, CF Bitcoin Volatility Index - Real Time, will transition to the CME CF family of indices. Typically, such transitions bring a step-change in terms of visibility to our indices that undergo the process of becoming co-branded with the world's leading derivatives marketplace, as well as CFB.
Well, here's a chance to get ahead of potentially increased inbound that may follow the arrival of the highest-profile regulated Bitcoin volatility measure.
Click below to watch our short BVX explainer video.
Find out more about the methodology that underlies our CF Volatility Series indices by clicking below.
The information contained within is for educational and informational purposes ONLY. It is not intended nor should it be considered an invitation or inducement to buy or sell any of the underlying instruments cited including but not limited to cryptoassets, financial instruments or any instruments that reference any index provided by CF Benchmarks Ltd. This communication is not intended to persuade or incite you to buy or sell security or securities noted within. Any commentary provided is the opinion of the author and should not be considered a personalised recommendation. Please contact your financial adviser or professional before making an investment decision.
Note: Some of the underlying instruments cited within this material may be restricted to certain customer categories in certain jurisdictions.
Changes to the Token Market Price Benchmarks Series - Market Prices – 21 July 2026
The Administrator has confirmed changes to the Token Market Price Family for the period 14 July 2026 to 21 July 2026.

CF Benchmarks
Softer CPI Reprices July Hike Risk & Lifts Digital Assets
Digital assets extended their recovery over the past week as cooler US inflation prints repriced Fed expectations; the bid was broad across the large cap indices, growth factor leadership returned, stablecoin funding repriced lower, and stress stayed isolated in names hit by token-specific news.
Mark Pilipczuk
Notice of the Demising of CF Dai-Dollar Settlement Price and Spot Rate
The Administrator announces that it will demise the CF Dai-Dollar Settlement Price (DAIUSD_RR) and CF Dai-Dollar Spot Rate (DAIUSD_RTI) which are members of the CF Digital Asset Index Family.
CF Benchmarks
By clicking Accept, you consent to CF Benchmarks's use of cookies.
Visit Cookie Settings to learn how CF Benchmarks uses cookies and to adjust your preferences.