
Jan 13, 2021
A Quiet Breakthrough for the Bitcoin Reference Rate
Our latest research validates the CME CF Bitcoin Reference Rate (BRR) as a fully compliant benchmark with consistently achievable prices
![]() Background
Background
Four years since the inception of CF Benchmarks’ Bitcoin Reference Rate (BRR) and Bitcoin Real Time Index (BRTI), the only fully regulated Bitcoin benchmarks, evidence of their validity has accumulated. This passing of time affords the opportunity for in-depth research into the BRR, the index used as the settlement value for CME Group’s Bitcoin futures contracts. We decided to take that opportunity by producing a comprehensive examination of the qualities and capabilities of the BRR in a formal research paper. The specific focus was on key use cases for institutional clients, like those looking for a regulated price of Bitcoin on which to base financial consumer products, chiefly a Bitcoin ETF.
What’s the paper about and why did we publish it?
- The paper describes how Bitcoin purchases at an institutional scale can be transacted at the CME CF Bitcoin Reference Rate price. The BRR is published and administered by CF Benchmarks, the only cryptocurrency Benchmark Administrator authorised under the EU’s Benchmark Regulation regime (EU BMR) and regulated by the UK Financial Conduct Authority. The Benchmark Regulation regime subjects CF Benchmarks to the same scrutiny and controls as providers of traditional financial market benchmarks like ICE LIBOR, SONIA and ICESWAP. Likewise, CF Benchmarks is subject to active oversight and supervision by the UK’s financial regulator the FCA
- This official accreditation requires CF Benchmarks to satisfy rigorous standards and be subject to ongoing scrutiny. The ultimate aim of this scrutiny is to ensure the market and price integrity of the CF Benchmarks instruments that regulators have ascribed benchmark status to. To corroborate the BRR’s market and price integrity even further, the paper also details an audit of CF Benchmarks’ Control Procedures with respect to EU BMR
- The CME CF Bitcoin Reference Rate price is the only Bitcoin price provided by an authorised Benchmark Administrator. Hence, due to its transparent and regulated status, it follows that users of the BRR can have full confidence that it is a Bitcoin price with the highest possible standards of price and market integrity
- Consequently, given that institutional market participants and financial product providers are obligated by regulation to participate in or offer products based only on regulated markets with price and market integrity, the process by which Bitcoin can be bought at the BRR price at institutional scale, as described in the paper, is something of a quiet breakthrough
- Why? Because, by following the methodology described in the paper for purchasing Bitcoins at a large scale, financial product providers now have a Bitcoin price that has market and price integrity whilst also being replicable (i.e., achievable)
What we did in a nutshell
- Conducted an exhaustive analysis of Constituent Exchange trading volumes
- Measured cross-exchange price deviation
- Modelled massive daily purchases of Bitcoin for 686 days in a row
Key findings and takeaways
BRR input prices from Constituent Exchanges are highly correlated:
An analysis was undertaken of the pair-wise correlation of prices from Constituent Exchanges on a per-minute basis (the price difference between transactions for each minute at each exchange) during the 686-day observation period. The full data set is illustrated in the graphic below.
Figure 1 - Pair-wise correlation of BRR Constituent Exchange Pricing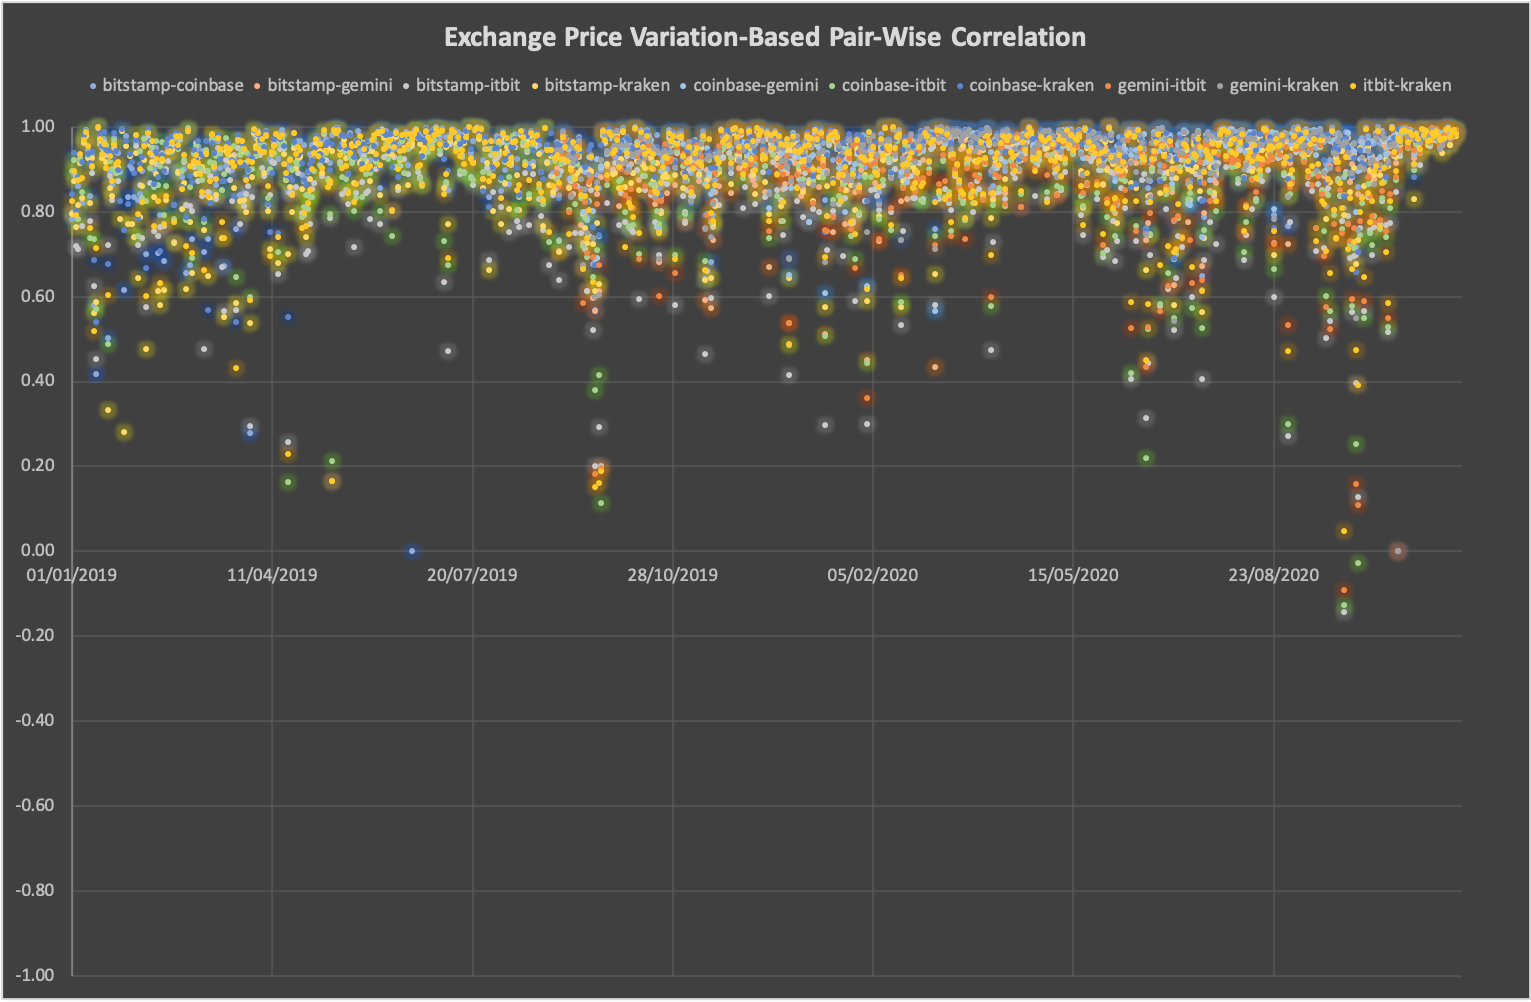 Source: CF Benchmarks
The clustering towards correlation coefficients of 1.00 and less than 1% of days when any exchange had a correlation with another exchange below 0.5 demonstrate a strong price correlation between Constituent Exchanges. In turn, the strong price correlation is evidence of a lack of manipulation within Constituent Exchange prices that might potentially have occurred on a smaller scale than would be captured by CF Benchmarks control procedures (such as the Potentially Erroneous Data Parameter) and to which the BRR is immune due to its aggregate construction. (Read an explanation of our Potentially Erroneous Data Parameter here.) Takeaway: There’s solid evidence that the BRR has not been subject to manipulation through manipulation of prices on individual Constituent Exchanges.
The BRR comprises sufficient volume to be valid as a benchmark:
On average it was possible to trade 1,848 Bitcoins a day at the BRR price during the one-hour measurement window of 15.00 to 16.00 London Time, during the 686-day observation period. That volume represented an average of 7,447 transactions each day, worth in excess of $17 million (at contemporaneous prices). Takeaway: There’s no doubt about the availability of sufficient volumes of Bitcoin at the BRR price.
The BRR price is replicable:
Volume data summarised above represents some evidence of the ‘achievability’ – another word for ‘replicability’ – of the BRR price. However the paper also prescribed a close observation of much larger daily transaction volumes of Bitcoin purchases, for the specific purpose of simulating the extent of ‘slippage’. (‘Slippage’ in market terms is the difference between the expected price of a trade and the price at which the trade was actually executed.) Slippage is almost an ‘industrial hazard’ for institutional market participants. That’s often because the trades they’re obliged to undertake are so large, it is difficult to complete them at the intended price, given that third parties can become aware of these large orders and try to take advantage by driving prices higher (or sometimes lower).
The exercise described in the paper was aimed at removing any lingering doubts about the ability of the BRR price to sustain multiple large-scale purchases of Bitcoin every day, whilst remaining replicable to a high degree. The paper contains the fine details. Suffice to say here that multiple purchases of Bitcoin were simulated on each of the 686 observation days, with the goal of completing one 50-Bitcoin purchase every second in a 3,600-second calculation window.
Defining slippage as the percentage difference between the replication price minus the BRR itself, results of the slippage analysis are presented in the graphic below.
Figure 2 - Slippage rates vs. BRR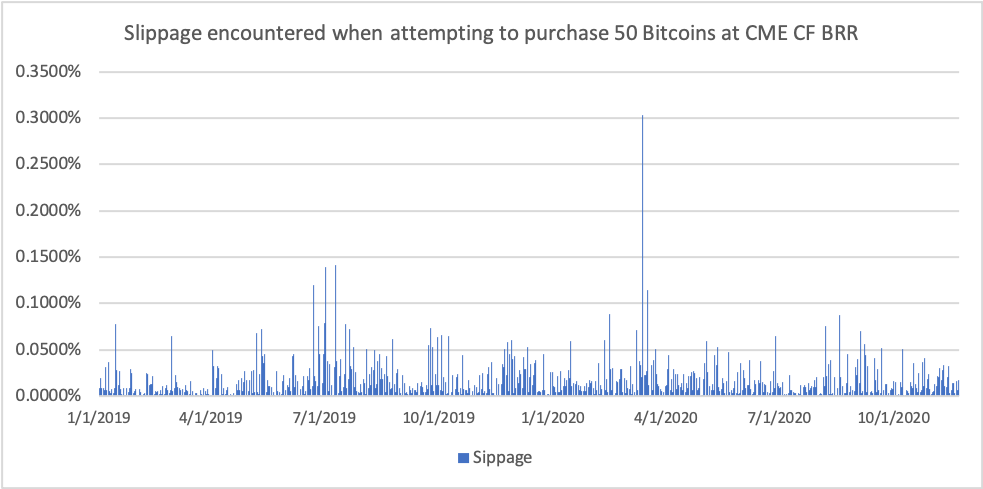 Source: CF Benchmarks
The chart’s obvious standout data point show’s a 0.3% slippage on one day of the exercise in April 2020. It is clear that that was the maximum slippage observed on a single day during the observation period, with the remainder of values congregating approximately within the ranges of 0%-to-0.05% and 0.05%-to-just-below-0.15%. Takeaway: slippage can self-evidently be described as having been largely negligible or, at worst, minor during the observation period.
Conclusions
- Our latest research demonstrates that the BRR answers a longstanding call from institutional product providers for a compliant Bitcoin price that is replicable
- We’ve confirmed the existence of a Bitcoin market with integrity and sufficient liquidity on which institutions can confidently base financial products
READ OR DOWNLOAD THE FULL RESEARCH PAPER: An analysis of the suitability of the CME CF BRR for the creation of regulated financial products
FIND OUT MORE ABOUT THE CME CF BITCOIN REFERENCE RATE: https://www.cfbenchmarks.com/indices/BRR
The information contained within is for educational and informational purposes ONLY. It is not intended nor should it be considered an invitation or inducement to buy or sell any of the underlying instruments cited including but not limited to cryptoassets, financial instruments or any instruments that reference any index provided by CF Benchmarks Ltd. This communication is not intended to persuade or incite you to buy or sell security or securities noted within. Any commentary provided is the opinion of the author and should not be considered a personalised recommendation. Please contact your financial adviser or professional before making an investment decision.
Note: Some of the underlying instruments cited within this material may be restricted to certain customer categories in certain jurisdictions.
Factor Friday - May 8, 2026
Size extended its multi-week dominance as the market rallied 4.3% to start May. Value posted its best week in over a month, a notable shift amid ongoing DeFi TVL dislocation following the Kelp DAO exploit. Momentum and growth lagged.

Mark Pilipczuk
Announcement of Changes to the Token Market Price Benchmarks - Methodology Guide
The Administrator is announcing changes to the Token Market Price Benchmarks - Methodology Guide.
CF Benchmarks
CF Benchmarks' xStocks Product Suite is Live - with Regulated Indices and a Corporate Actions Feed
We are excited to announce the launch of the CF Benchmarks xStocks Product Suite: xStocks Indices — approximately 100 regulated real-time benchmarks — and the Corporate Action Data Feed.
Ken Odeluga
By clicking Accept, you consent to CF Benchmarks's use of cookies.
Visit Cookie Settings to learn how CF Benchmarks uses cookies and to adjust your preferences.