
Dec 09, 2022
Quarterly Attribution Report: CF Diversified Large Cap Index
The CF Diversified Large Cap Index - is a liquid, investible benchmark portfolio index designed to track the performance of large-cap digital assets. The index seeks to capture 95% of the total market capitalization of the investible digital asset universe as its constituents. Index constituents are weighted using the diversified market capitalization which is determined by the free-float market capitalization adjusted by the application of the harmonic series' terms. This has the benefit of discounting the higher capitalization assets within the portfolio in accordance with the CF Multi Asset Series Ground Rules and the CF Diversified Large Cap Index Methodology. The index is calculated and published every second. The index is re-constituted on a twice yearly basis and rebalanced quarterly. The CF Diversified Large Cap Index - was incepted on December 1st 2021 with a value of 1,000. The index was launched on February 14th, all values from inception date to launch date provided are back tested.
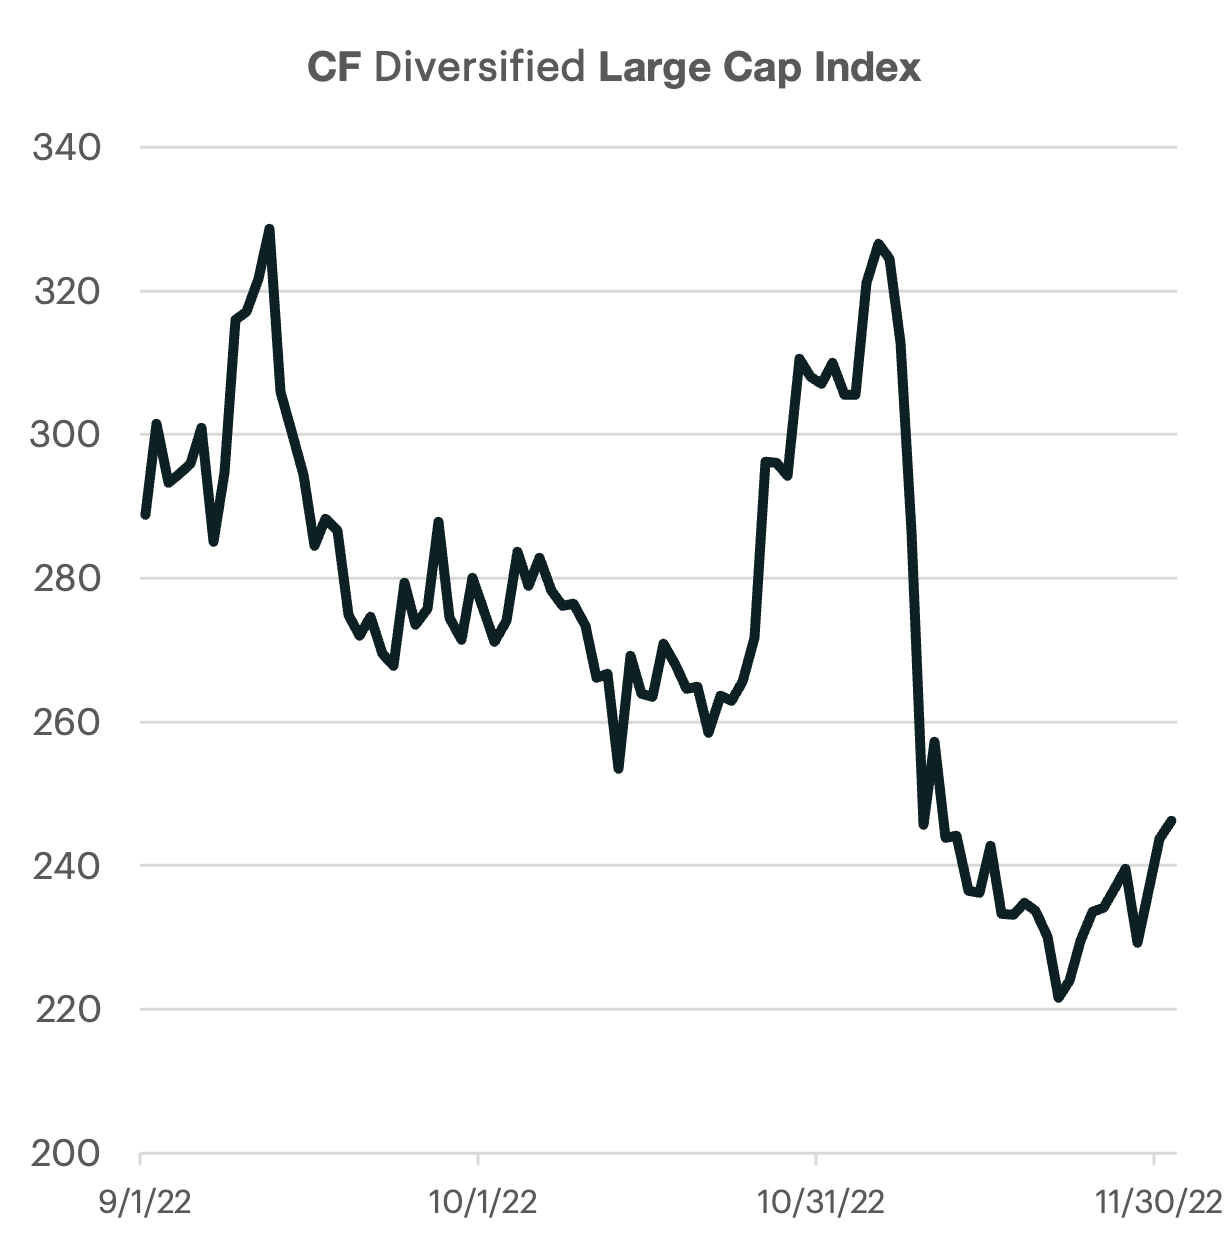
Settlement drags large-caps lower
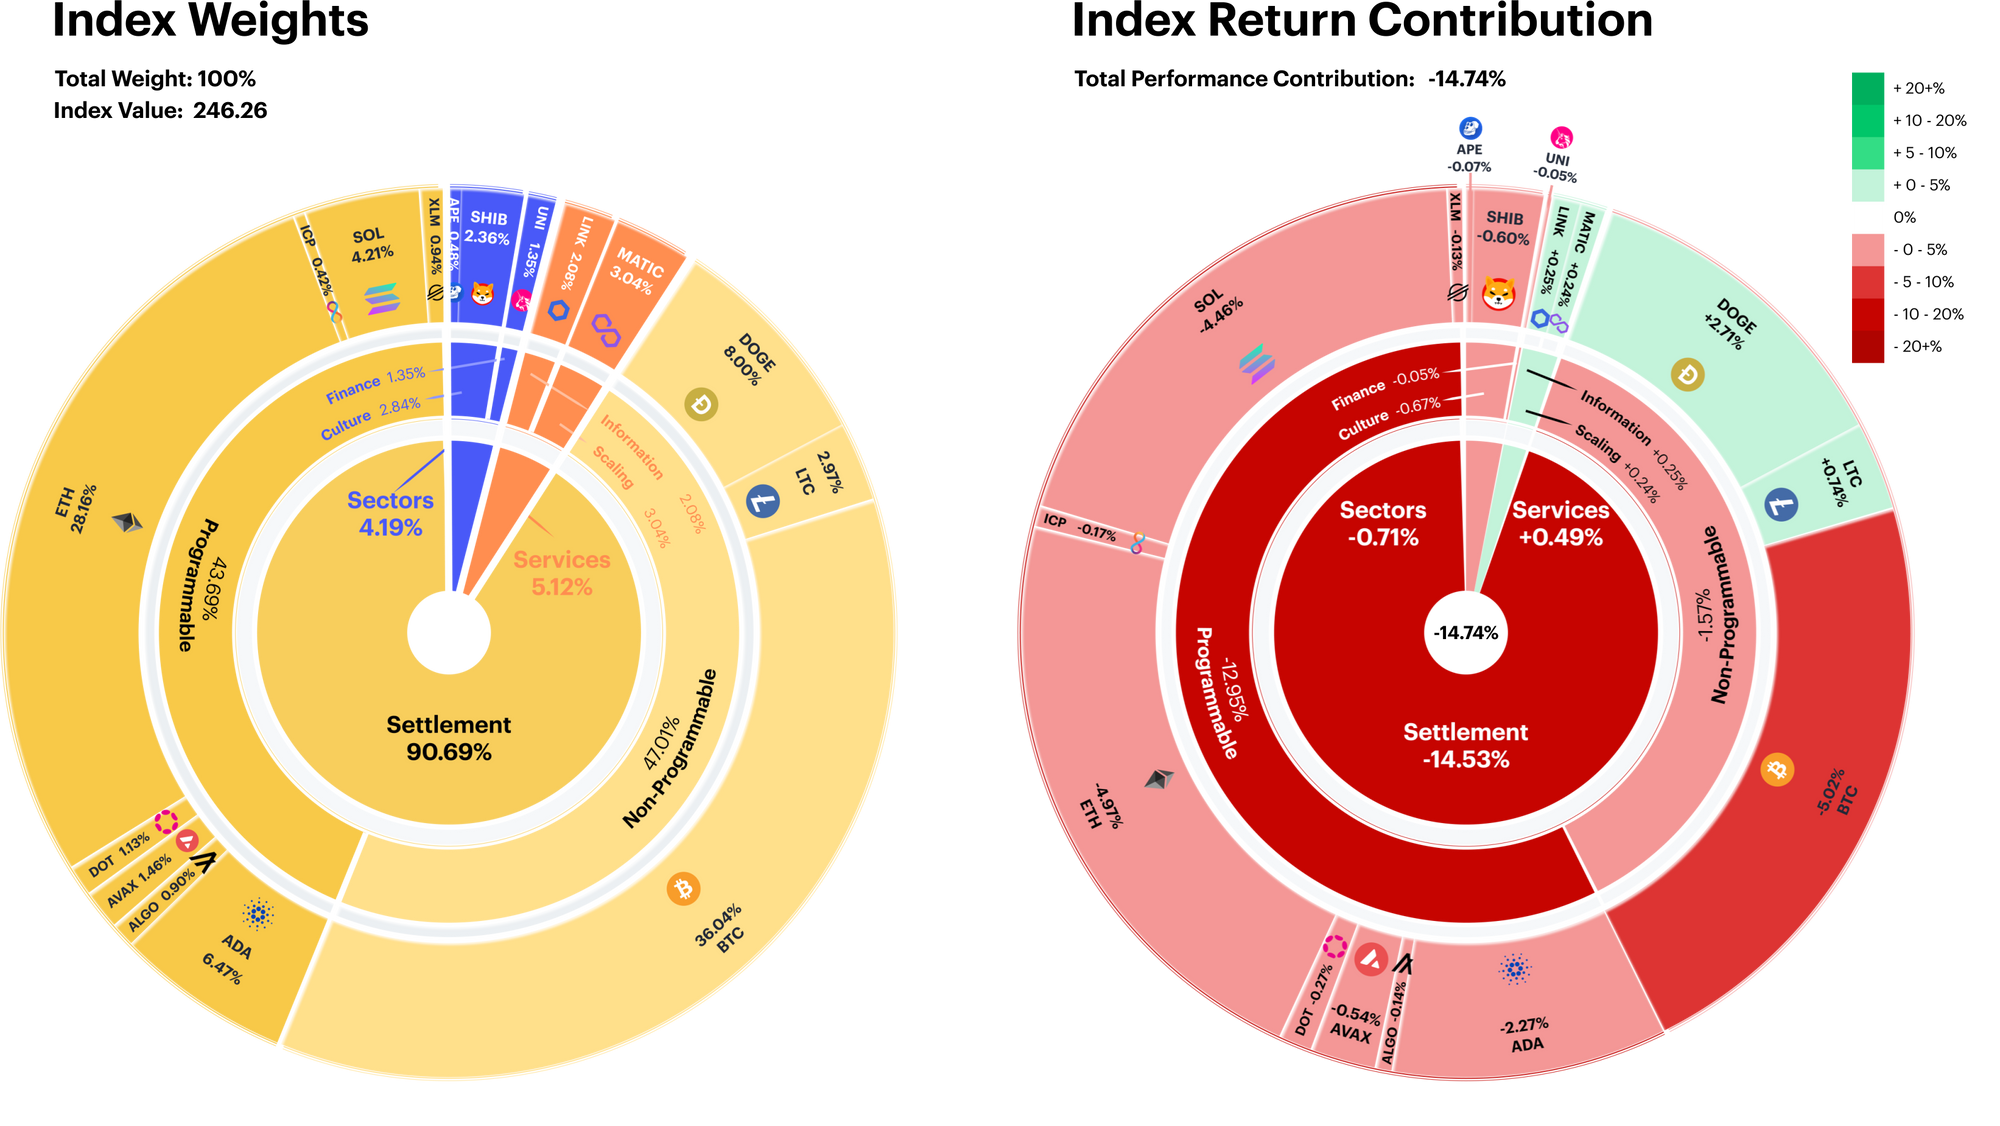
Large-cap tokens continued on their downward trajectory, falling over -14%. From a Level 1 Digital Asset Classification Structure (DACS) perspective, the heavily weighted Settlement segment contributed most to the index’s decline (-14.5%), with Solana providing a disproportionate amount of negative performance.
The Services segment saw a slightly positive performance contribution, and conversely, Sectors’ contribution was slightly negative.
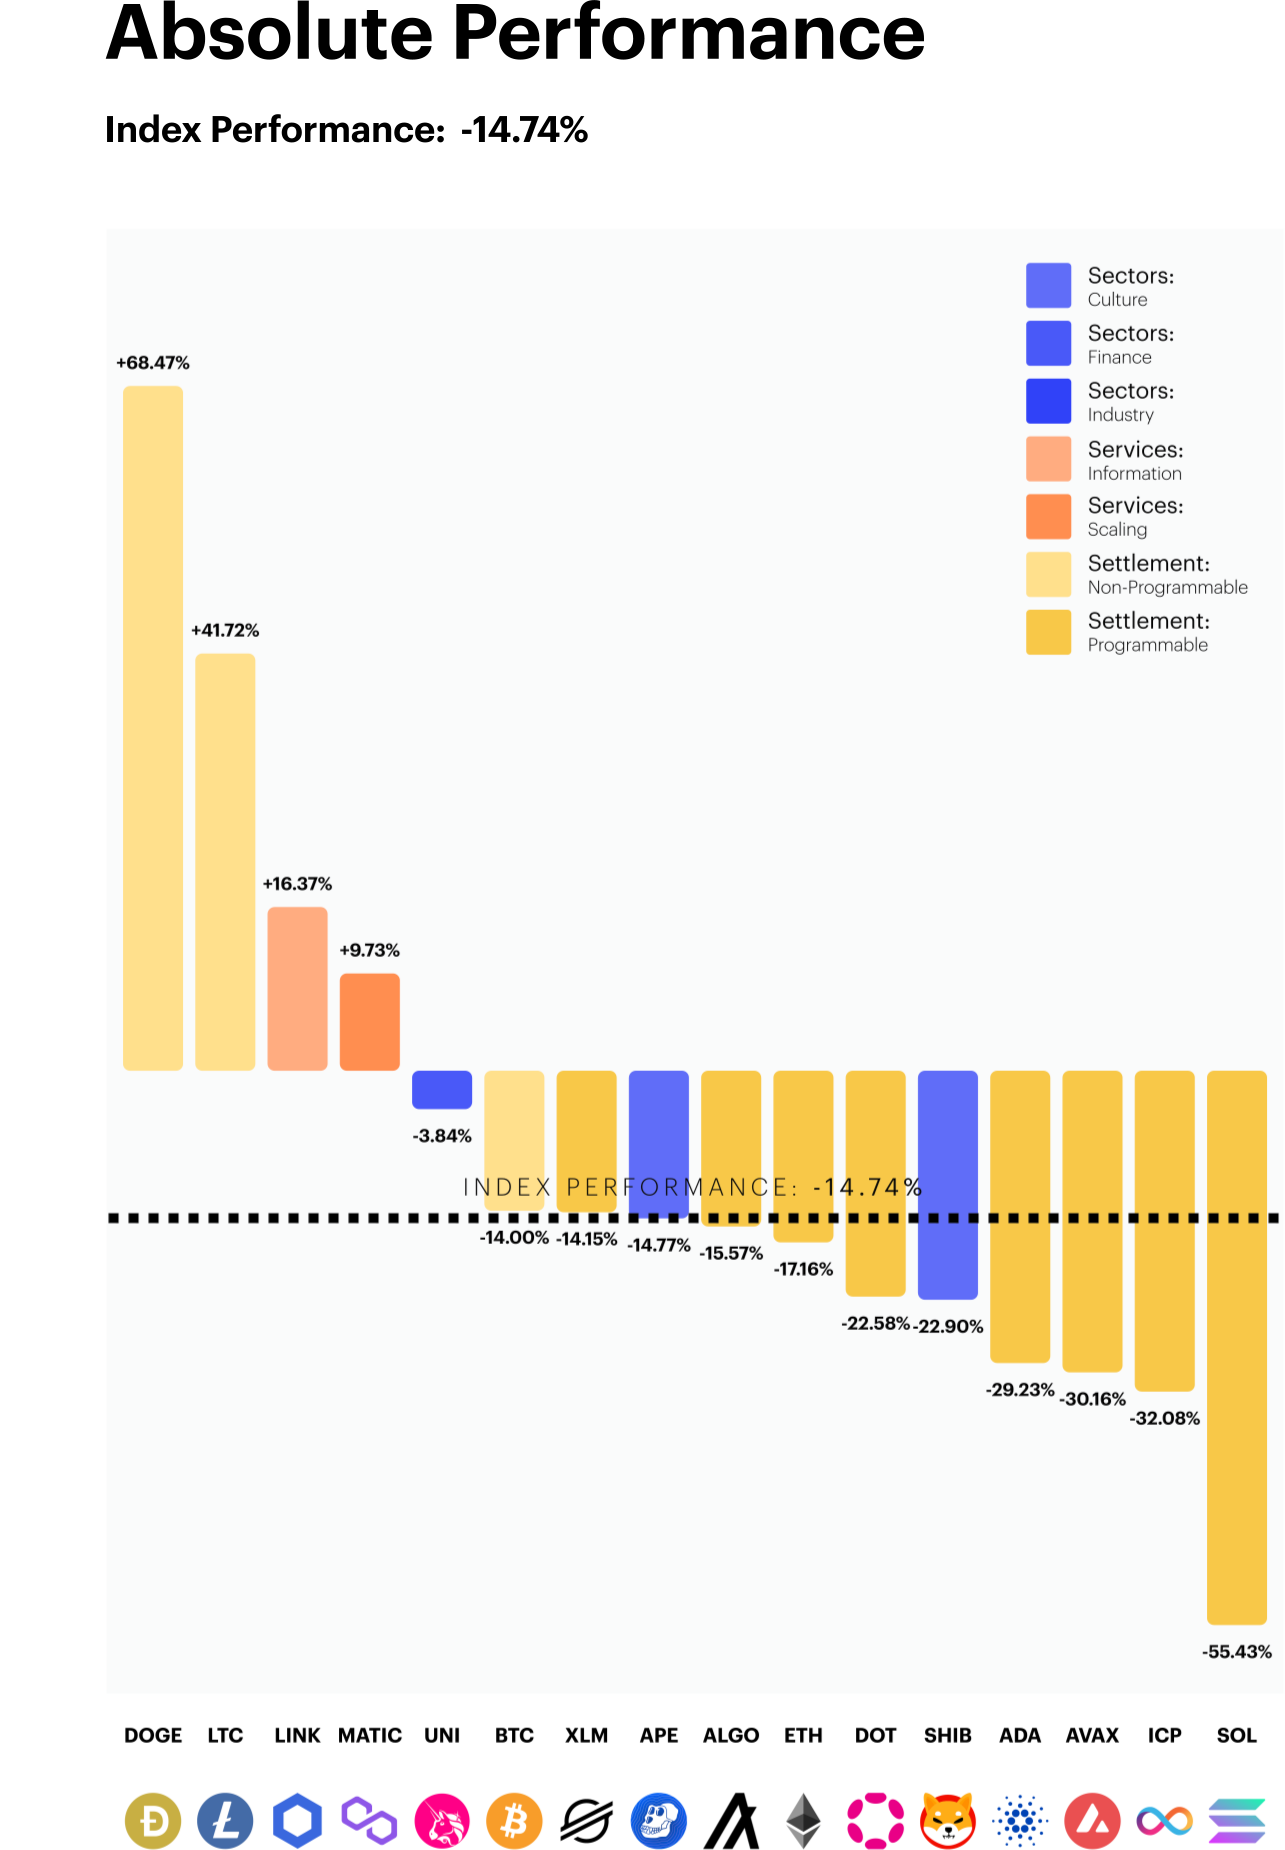
Dogecoin surges on Twitter take over
Non-programmable, Settlement altcoins led their peer group as Dogecoin finished the rebalancing period as the top performer. The popular meme coin saw a significant rally in price performance following Elon Musk’s takeover of Twitter. Mr. Musk has been a frequent advocate for Dogecoin. Therefore, the fundamental catalyst for the bullish price action is centered on speculation that Mr. Musk will utilize Doge in some capacity in the Twitter 2.0 payments arena. Litecoin, the fourth largest non-programmable token, soared after the announcement of a planned halving for mid 2023. This exercise will change the tokenomics of Litecoin by reducing the issuance supply for miners.
Solana (SOL) prices fell -55.4%, finishing the rebalance period as the worst performer. The Ethereum competitor saw steep price declines due to the fallout from FTX/Alameda where it was reported that the foundation had significant exposure to the now defunct crypto exchange. SOL now trades over 90% lower from its November peak.
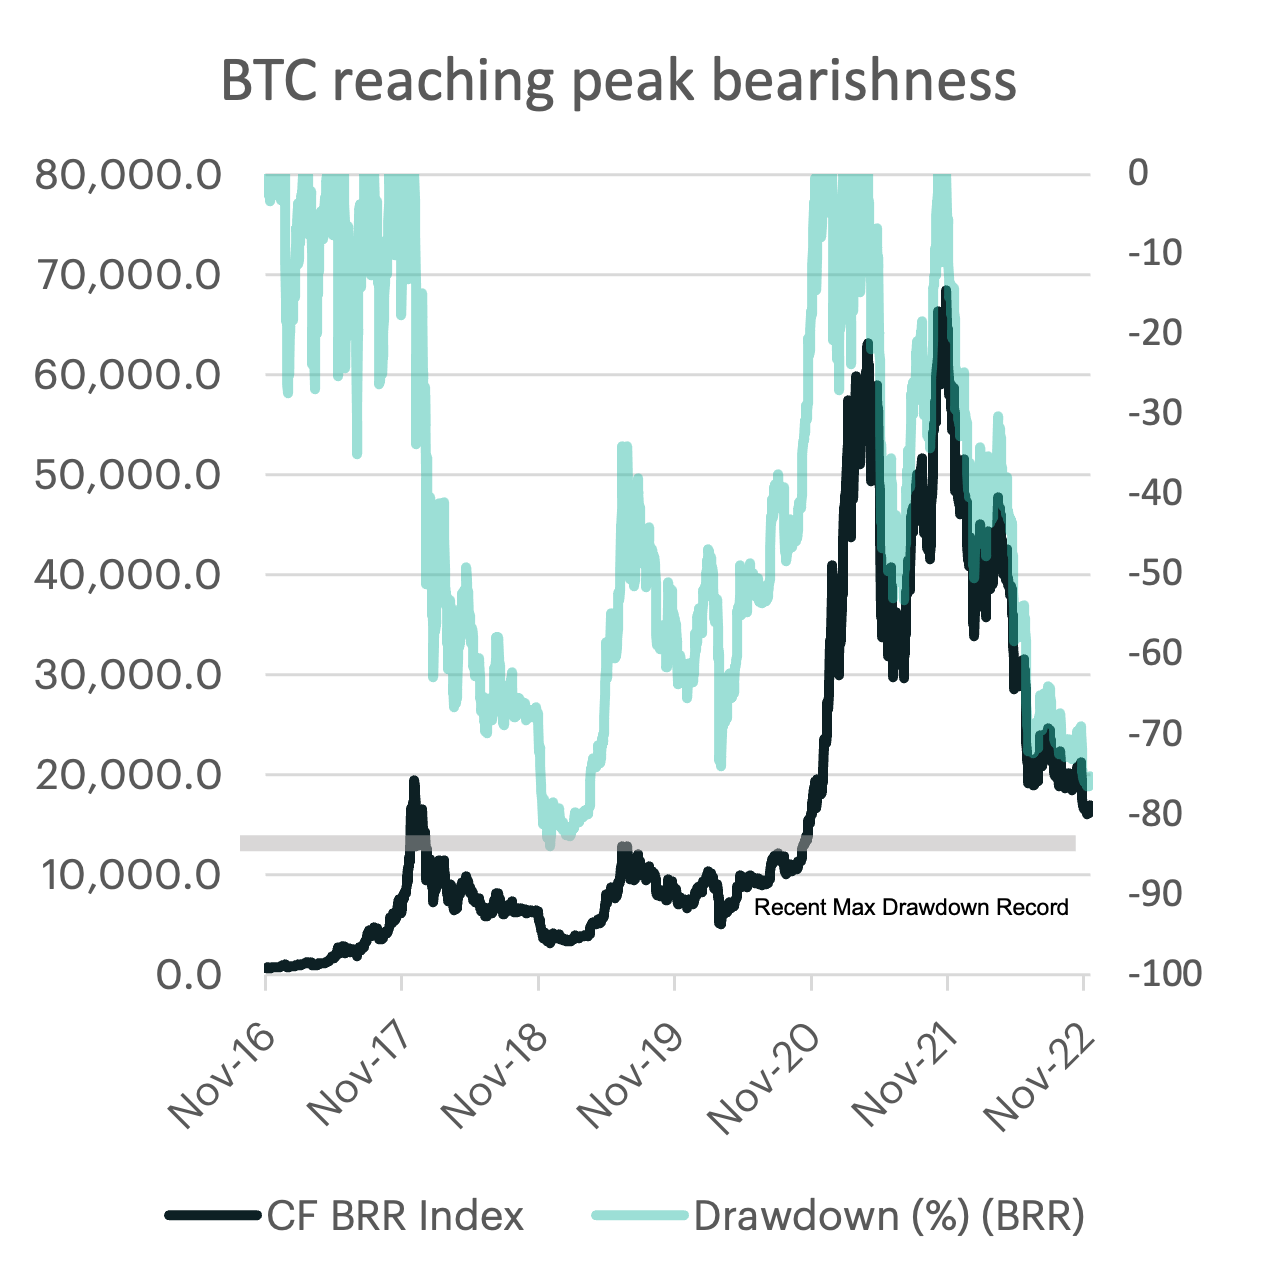
Bitcoin continues search for bottom
The latest exogenous shock in the crypto industry has pushed bitcoin prices another leg lower, bringing the maximum drawdown from the 2021 peak to just over 76%. But how does this compare to previous bear market cycles?
To answer this question, one could consider using history as a guide. Bitcoin price action has impressively displayed similar drawdown characteristics over the course its existence. Since 2011, bitcoin peak-to-trough depreciations have averaged approximately -85%, with the 2011- 2013 cycle marking a record -93%. The fallout from FTX and subsequent contagion impacts have pushed this bear market cycle’s low closer to the most recent historical threshold. Lastly, it is also worth noting that each bear-market cycle trough was slightly less deep than the prior, leaving the -83% level seen in 2018 potentially a stone’s throw away
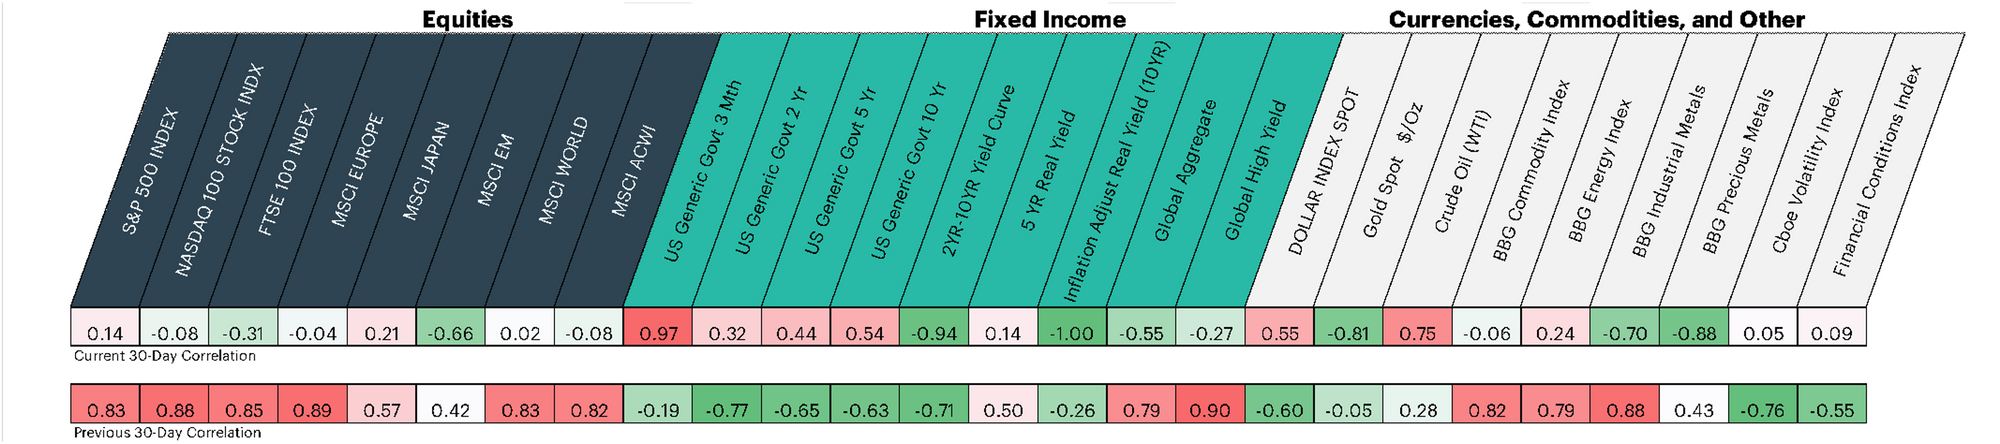
What’s Driving Crypto? Rolling 30-Day Large Cap Correlations
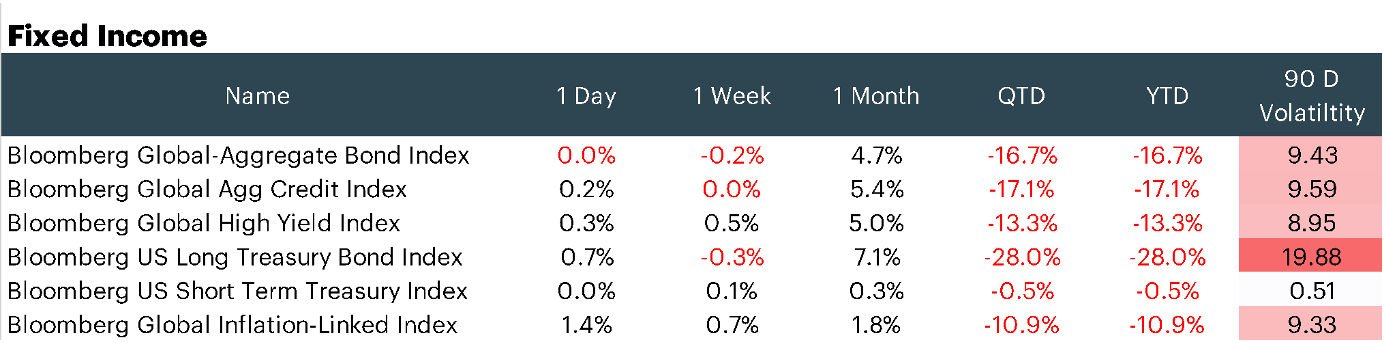
The CF Diversified Large Cap Index has seen a sharp drop in its rolling 30-day correlation with equity markets. This is likely due to the asset-class specific challenges, which have been certainly are more impactful to crypto markets and less so for other risky assets. Meanwhile, crypto has maintained a sensitivity to rates market. However, the relationship has shift from nominal short-dated Treasuries to longer-dated inflation linked Treasury issues. It is likely that digital asset correlations will repair their relationship among their risky-asset peer group once industry specific uncertainty eases.
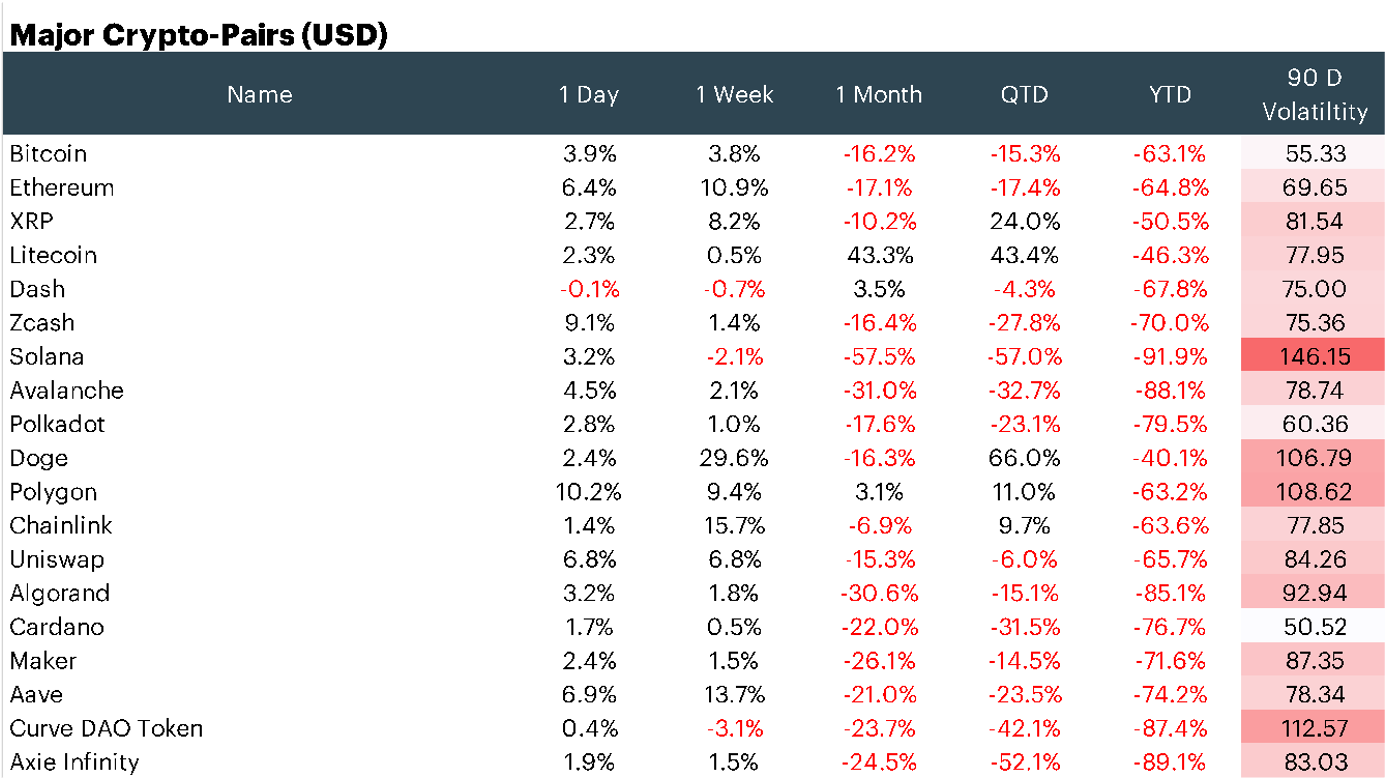
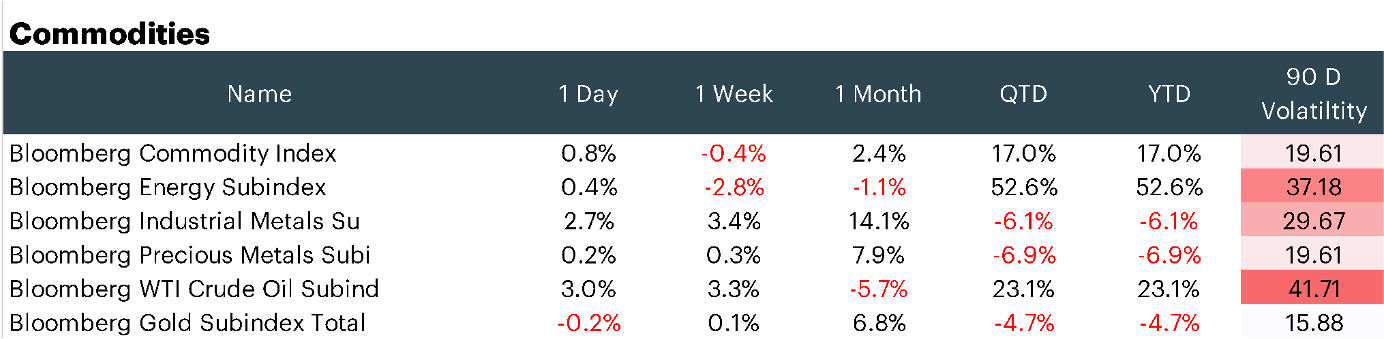
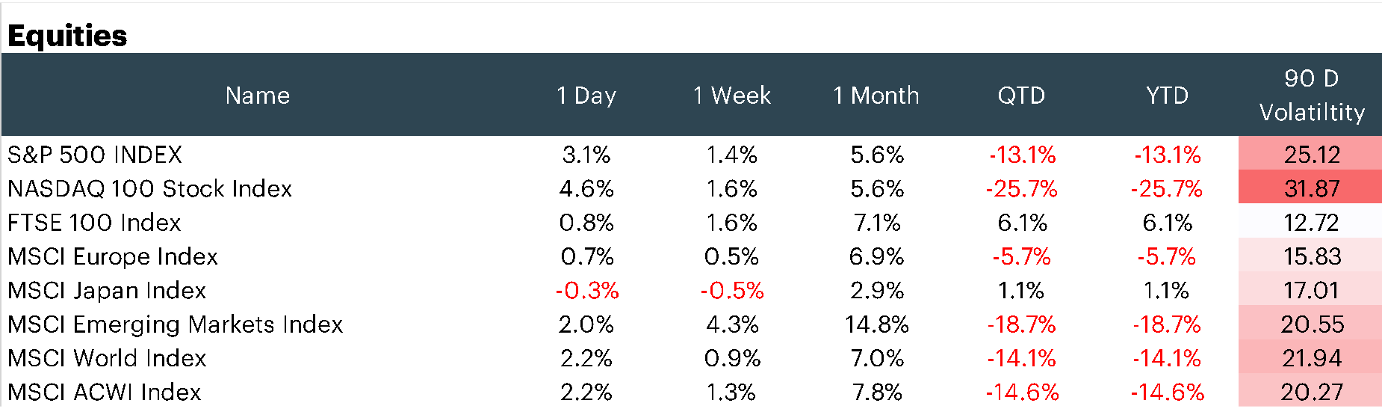
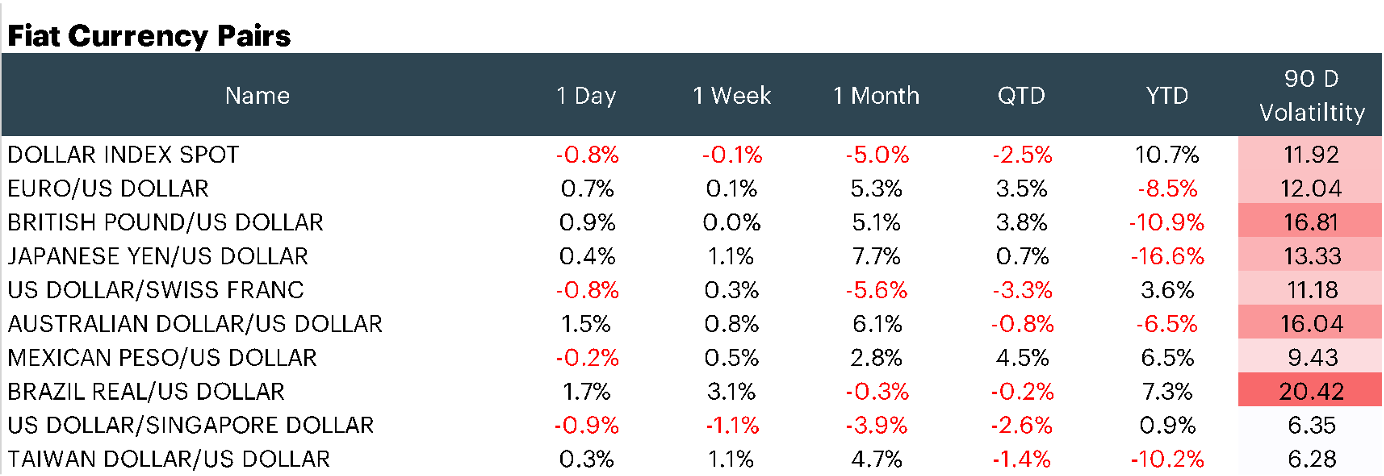
Appendix: Market Performance Overview
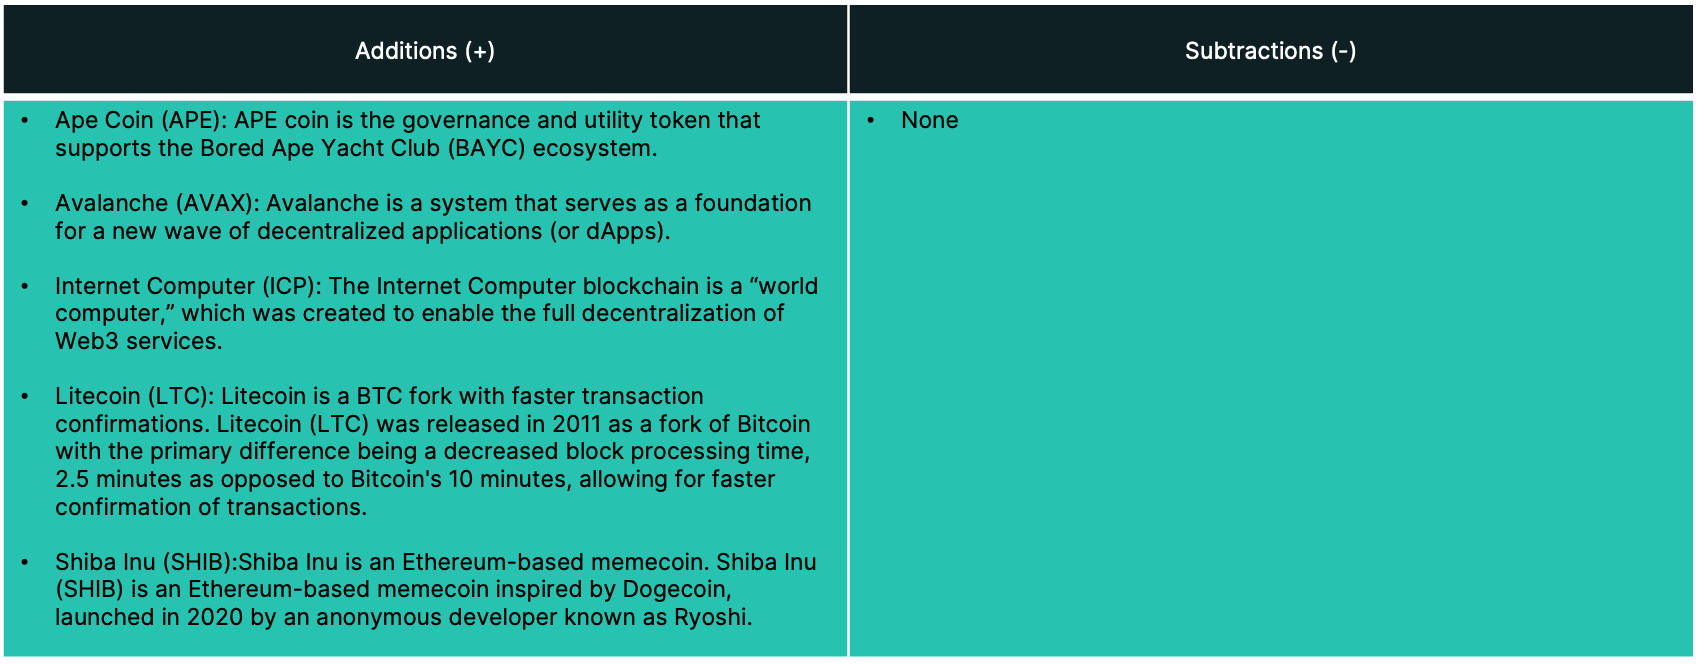
Appendix: constituent changes for current period
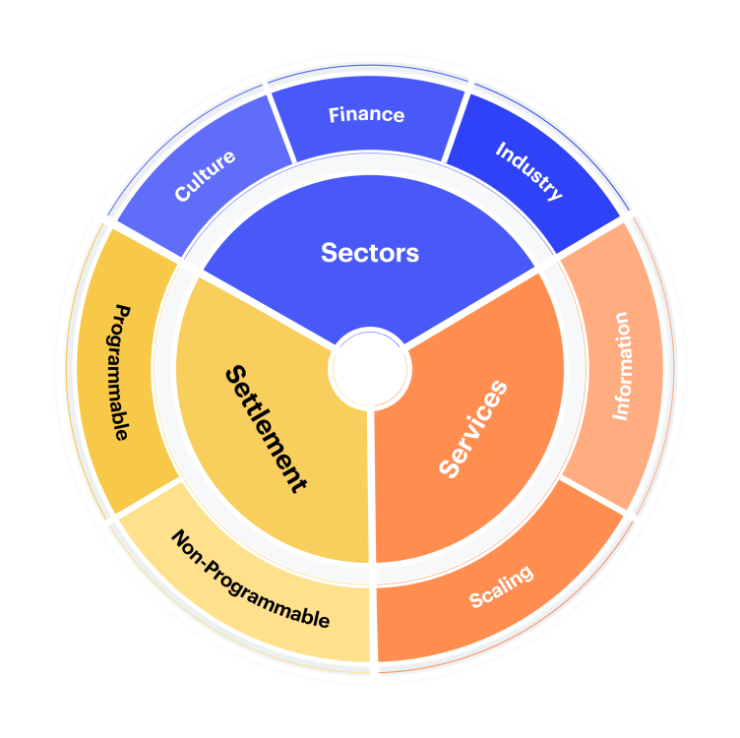
Appendix: CF Digital Asset Classification Structure
The CF Digital Asset Classification Structure (DACS) classifies coins and tokens based on the services that the associated software protocol delivers to end users, grouping assets by the role they play in delivering services to end users. The CF DACS powers CF Benchmarks' sector composite and category portfolio indices and allows users to perform attribution analysis to better understand the fundamental drivers of returns within their digital asset portfolios.
Additional Resources
For more information about our CF Benchmark indices and our methodologies, please visit the respective web links below:
- CF Diversified Large Cap Index
- CF DeFi Composite Index
- CF Web 3.0 Smart Contract Platforms Index
- CF Digital Culture Composite Index
- CF Blockchain Infrastructure Index
- CF Cryptocurrency Ultra Cap 5 Index
Contact Us
Have a question or would like to chat? If so, please drop us a line to:
The information contained within is for educational and informational purposes ONLY. It is not intended nor should it be considered an invitation or inducement to buy or sell any of the underlying instruments cited including but not limited to cryptoassets, financial instruments or any instruments that reference any index provided by CF Benchmarks Ltd. This communication is not intended to persuade or incite you to buy or sell security or securities noted within. Any commentary provided is the opinion of the author and should not be considered a personalised recommendation. Please contact your financial adviser or professional before making an investment decision.
Note: Some of the underlying instruments cited within this material may be restricted to certain customer categories in certain jurisdictions.
Changes to the Token Market Price Benchmarks Series - Market Prices – 21 July 2026
The Administrator has confirmed changes to the Token Market Price Family for the period 14 July 2026 to 21 July 2026.

CF Benchmarks
Softer CPI Reprices July Hike Risk & Lifts Digital Assets
Digital assets extended their recovery over the past week as cooler US inflation prints repriced Fed expectations; the bid was broad across the large cap indices, growth factor leadership returned, stablecoin funding repriced lower, and stress stayed isolated in names hit by token-specific news.
Mark Pilipczuk
Notice of the Demising of CF Dai-Dollar Settlement Price and Spot Rate
The Administrator announces that it will demise the CF Dai-Dollar Settlement Price (DAIUSD_RR) and CF Dai-Dollar Spot Rate (DAIUSD_RTI) which are members of the CF Digital Asset Index Family.
CF Benchmarks
By clicking Accept, you consent to CF Benchmarks's use of cookies.
Visit Cookie Settings to learn how CF Benchmarks uses cookies and to adjust your preferences.