
Dec 09, 2022
Quarterly Attribution Report: CF Ultra Cap 5 Index
The CF Cryptocurrency Ultra Cap 5 (CFUC5) is an investible benchmark index tracking the performance of a free float market capitalization weighted portfolio of the 5 largest cryptocurrencies by market capitalization. It is the first true measure of the market beta of cryptocurrencies being a Registered Benchmark under EU BMR. All pricing sources for constituents of the index are also themselves Registered Benchmarks. The index is calculated and published once every second in accordance with the methodology. The portfolio composition is determined by the CF Digital Asset Index Family Multi Asset Series Ground Rules with constituent reviews taking place twice a year and monthly rebalancing. The index was launched on August 18th 2020 with an inception date of September 1st 2018 at a value of 1000.
'FUD’ top of mind despite easing macro uncertainty
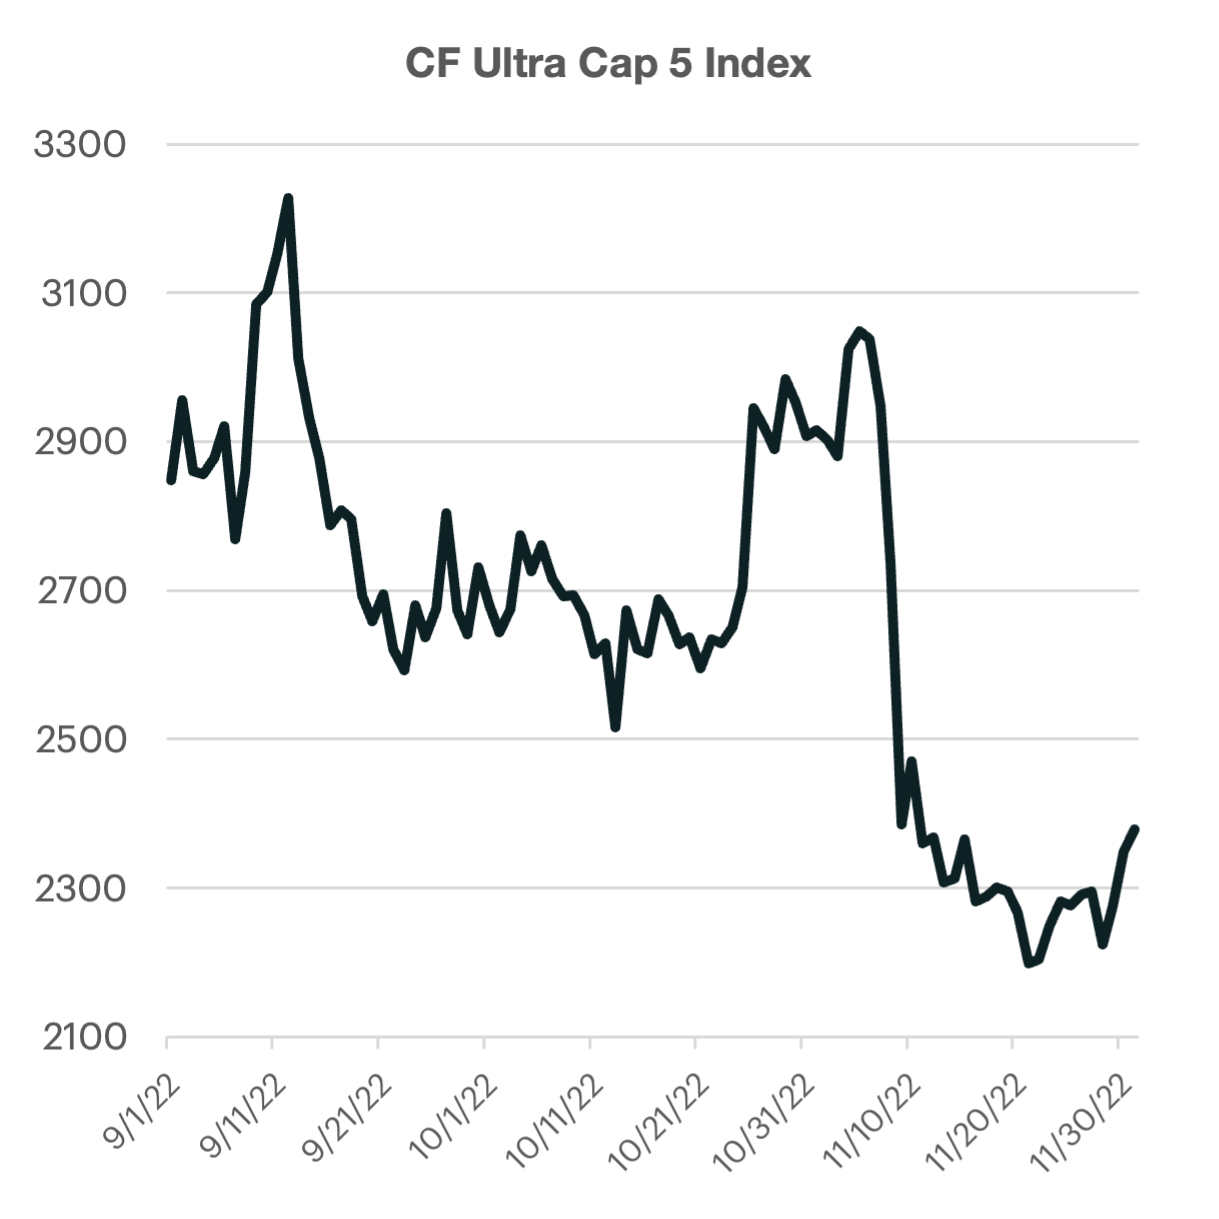
Another exogenous shock has led crypto markets lower over the last rebalancing period as one of the world’s largest exchanges surprisingly filed for bankruptcy. The CF Ultra Cap 5 Index fell over -16% with pricing volatility surging in the month of November. The bear market that began earlier this year has only intensified after each over-levered institution or organization collapses. These failures have had a cascading impact on the overall asset class, with the falling prices of crypto markets sparking an industry deleveraging exercise, spreading contagion that leads to even further discounting of crypto assets.
Regarding the macro-environment, risk sentiment has begun to look toward an eventual pivot or slowdown in monetary tightening. The most recent inflationary trends indicate that headline pricing pressures may have peaked in June. This dynamic is expected to be supportive of crypto markets, which face particularly pronounced headwinds from a rising interest rate environment. However, core inflation is likely to be more difficult to tame and the overall level of inflation is likely to remain above any acceptable threshold for some time. This has left crypto market participants in limbo when trying to balance the improving data on the inflation side and spillover impacts from the latest fallout of a major market player.
Big-blues outweigh LINK’s rise
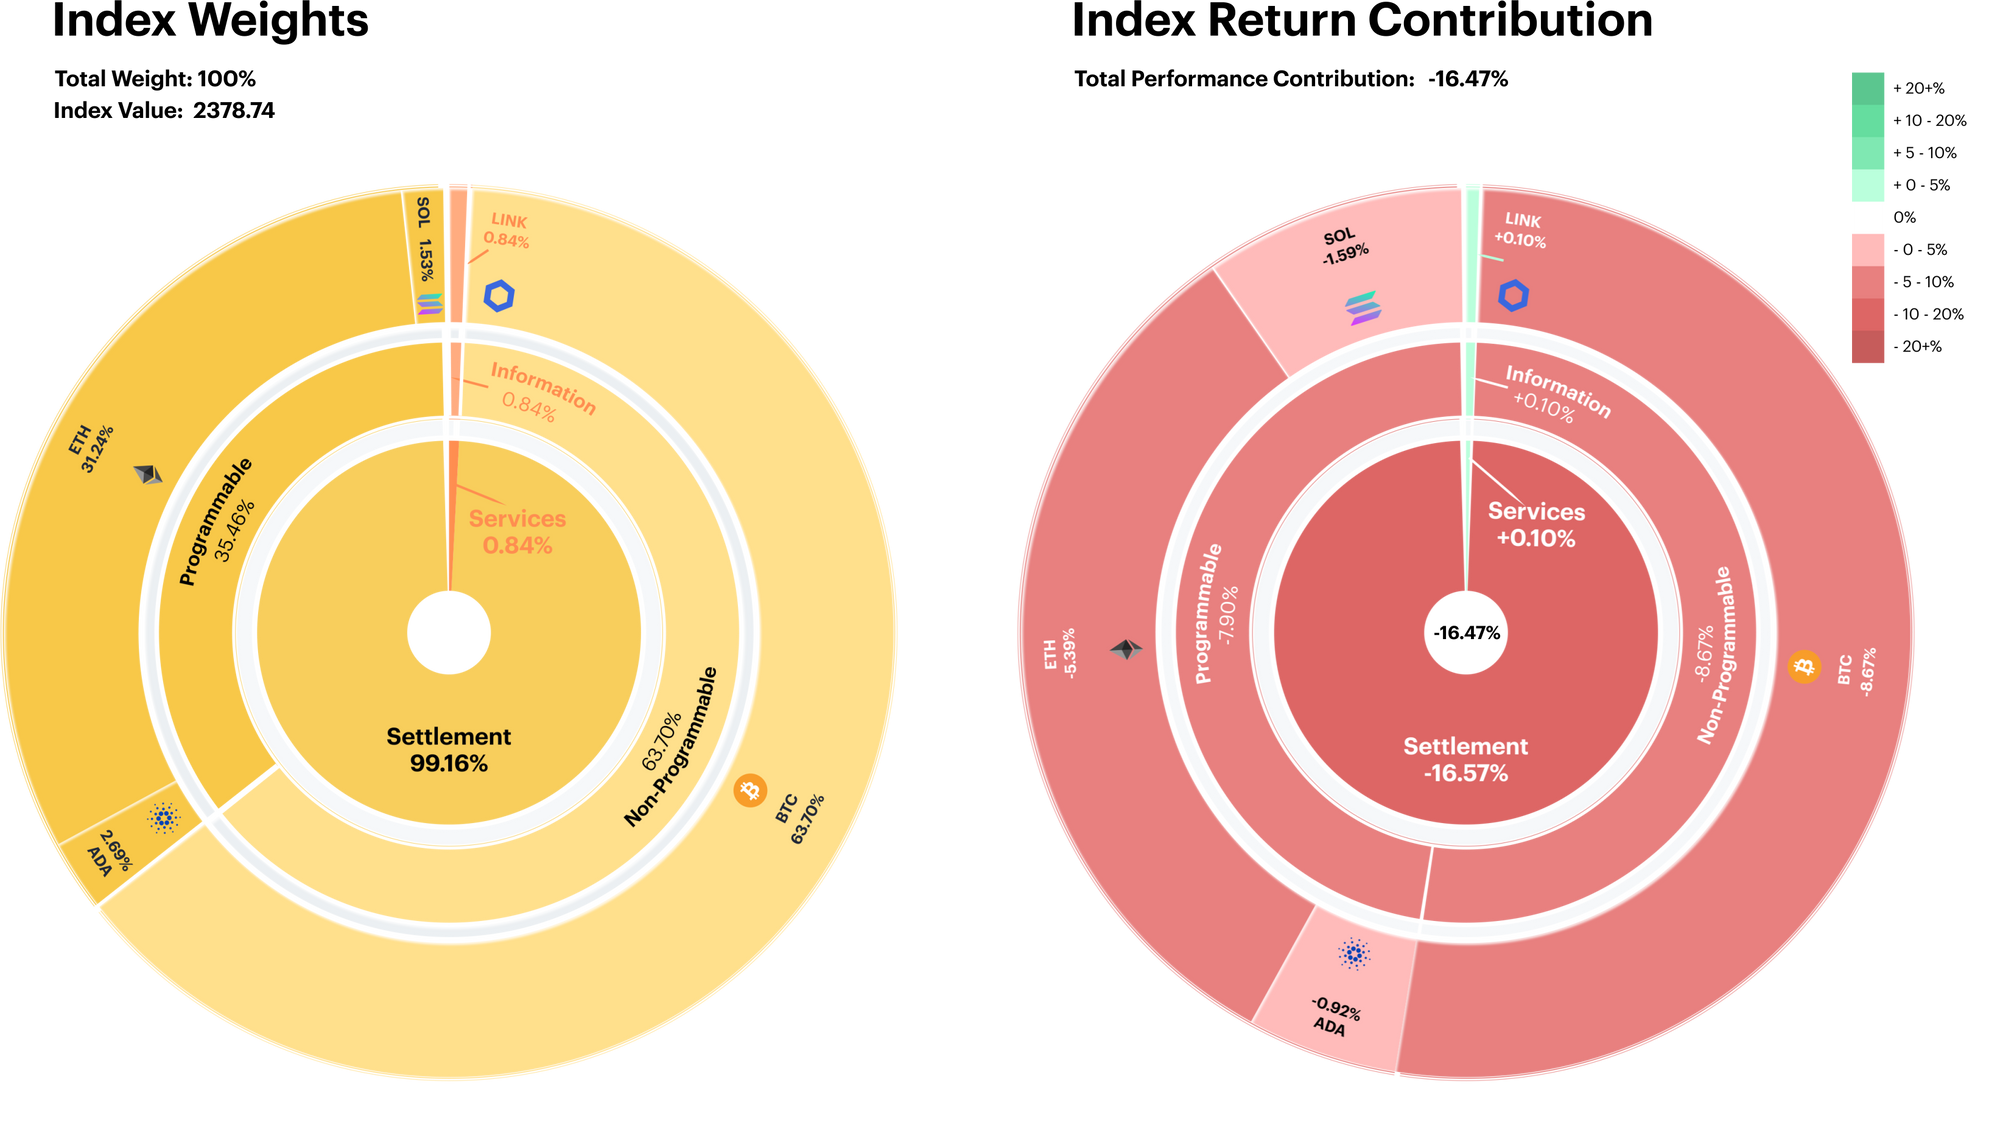
Our barometer for mega-cap tokens remained under pressure, falling approximately -16.5%. The index is heavily weighted towards the Settlement segment, which contributed over 100% of the negative performance during the last rebalancing period.
The Level 2 layer was heavily impacted by Solana’s (SOL) weak performance. The Ethereum competitor detracted almost 1.6% of performance despite its modest 2.8% initial weighting. Lastly, the Services segment ended in positive territory due to Chainlink’s (LINK) resilient quarter.
Planned staking launch boosts LINK
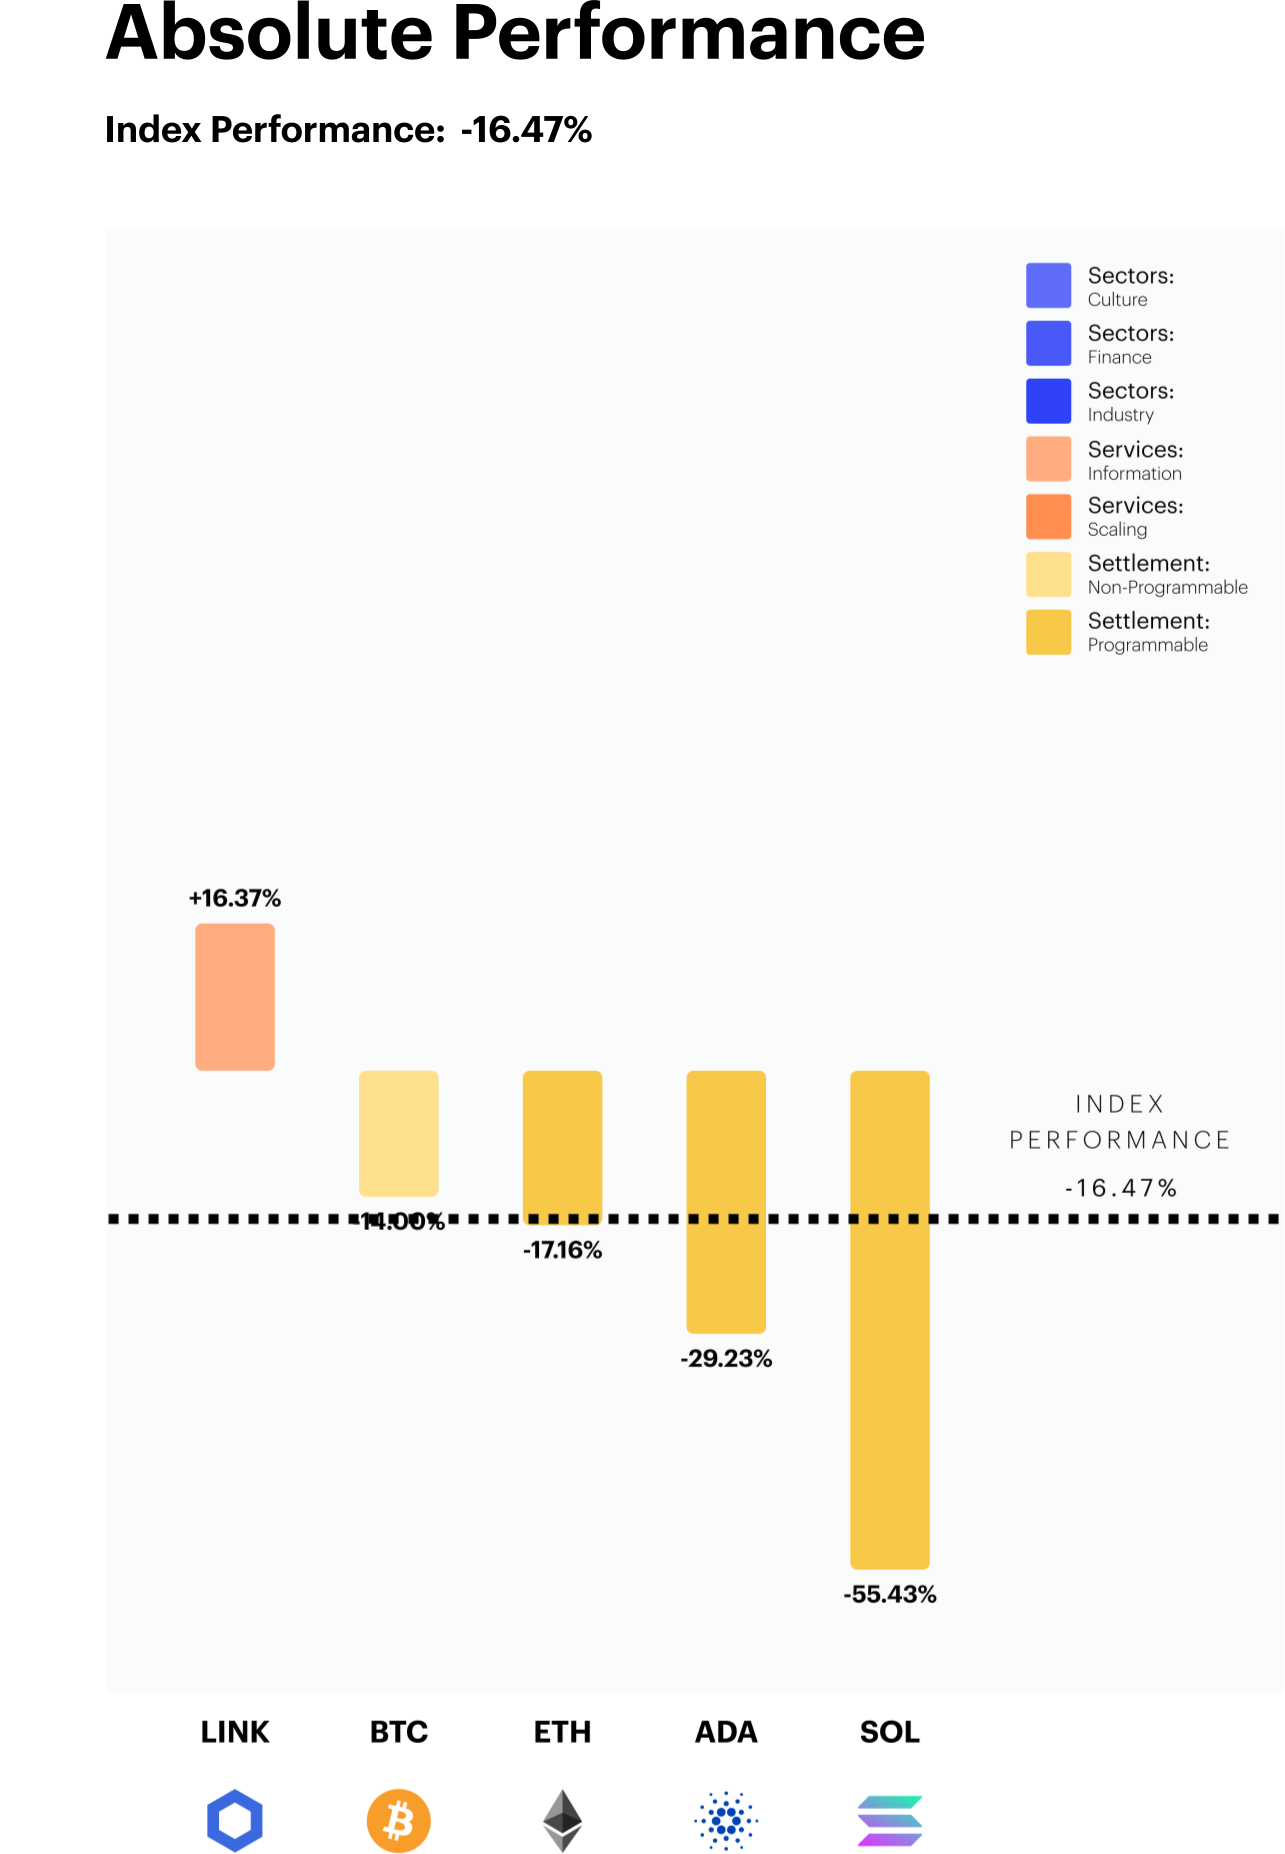
Chainlink (LINK) outperformed the mega-cap peer group by a significant margin, rising over 16% for the quarter. This marks the second straight quarterly-rebalance period that LINK has remained on top. Bullish price action began in late October after its developers announced plans to launch a novel staking program. This will eventually allow token holders to earn passive income on their holdings. Furthermore, staking activity should potentially provide steady burning of LINK tokens, adding a deflationary catalyst for its tokenomics.
Solana (SOL) saw its market cut in half over the last three months. The Ethereum competitor came under pressure the wake of FTX/Alameda fallout. The FTX empire was a major investor and supporter of Solana. FTX’s fatal liquidity crunch ultimately led to forced selling of SOL holdings, sending the token to levels last seen in March of 2021.
Market sentiment swings favours BTC over ETH
The CF Ultra-Cap index is intended to represent the mega-cap tokens in the crypto universe. Of which, a large portion is then allocated to the two largest: bitcoin (BTC) and ethereum (ETH). The relative pricing performance of the two crypto-behemoths are often cited as gauges for risk sentiment of the overall crypto market. An example of this would be when BTC outperforms ETH, which would indicate a more defensive sentiment in the marketplace (or vice versa).
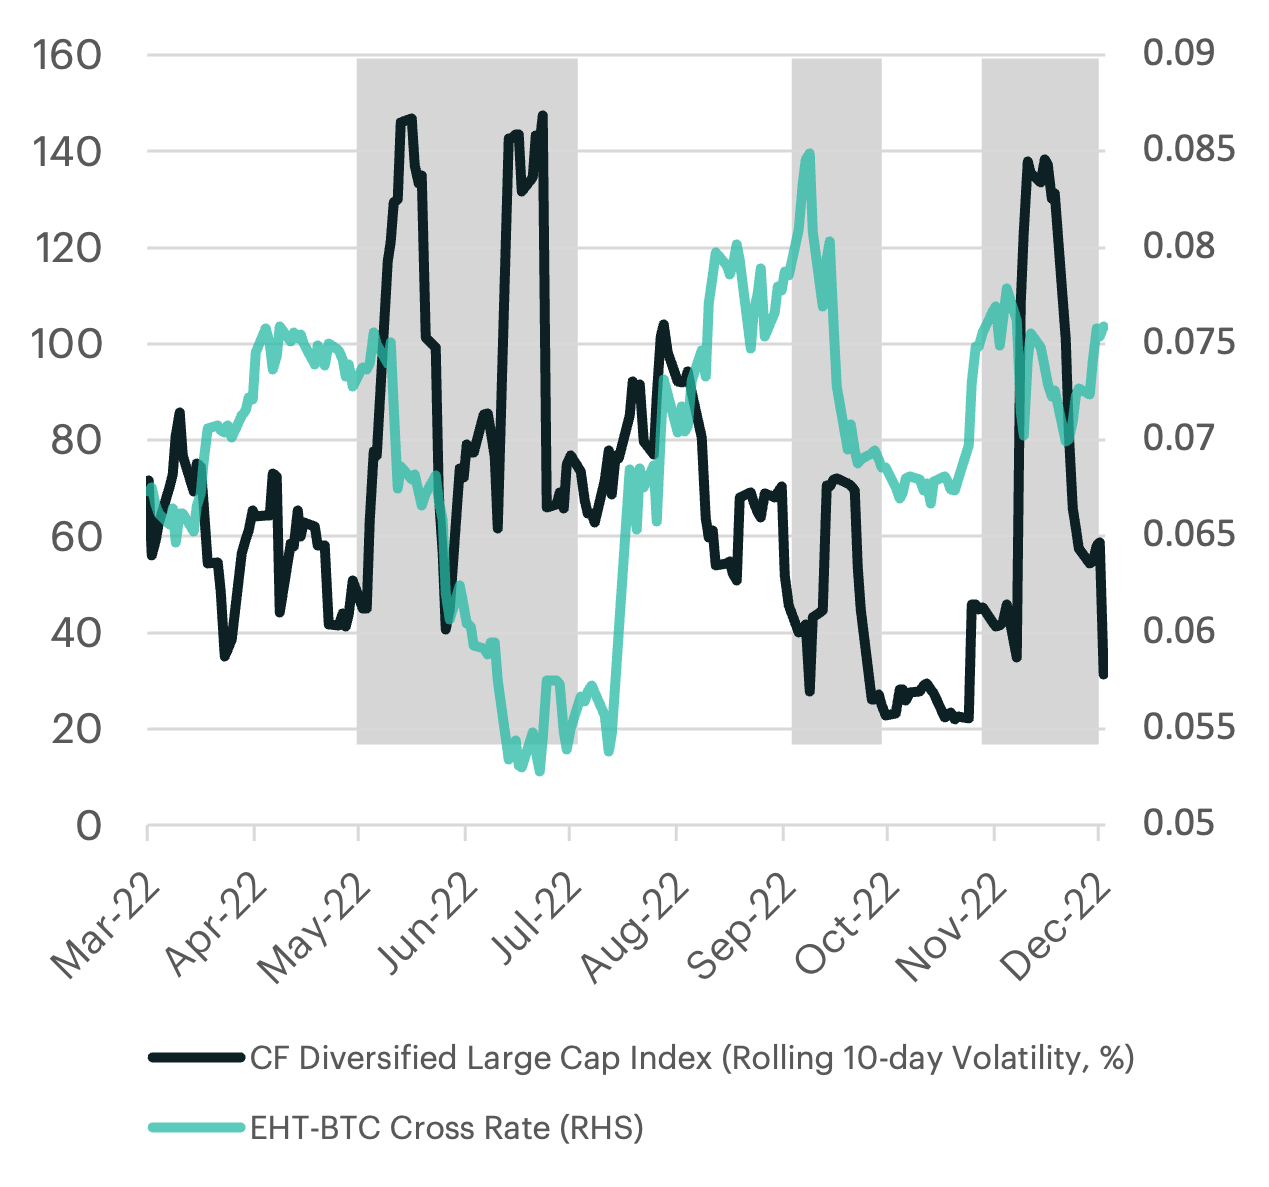
For the first time since the April-June quarter, bitcoin has seen a relatively stronger performance when compared to its programmable peer. If we study the 10-day rolling volatility measure of a broader index, such as our Diversified Large Cap, we see that the recent volatility spikes in mid September and early November has had a diminishing impact on ETH’s relative performance. However, the quick collapse in volatility back to the sub-40% level is likely to remain supportive for ETH once again.
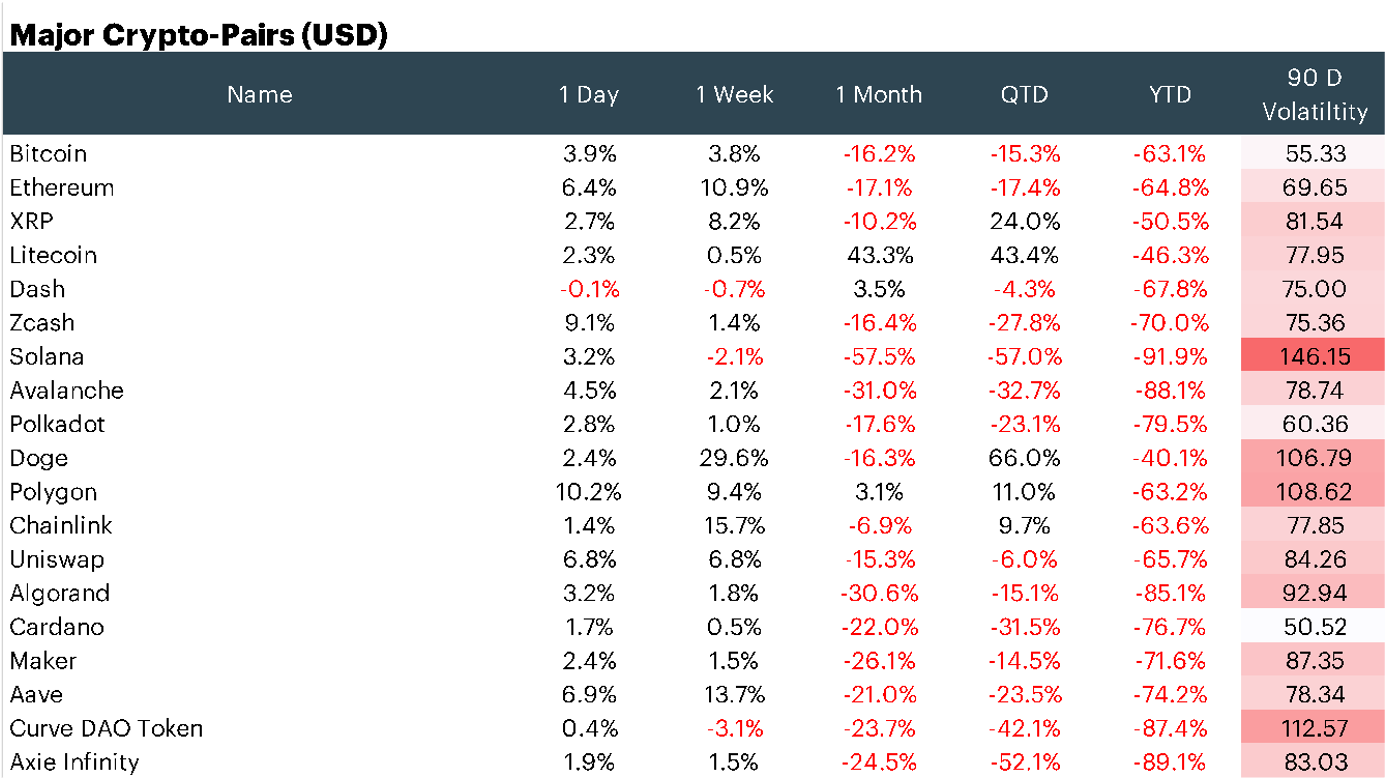
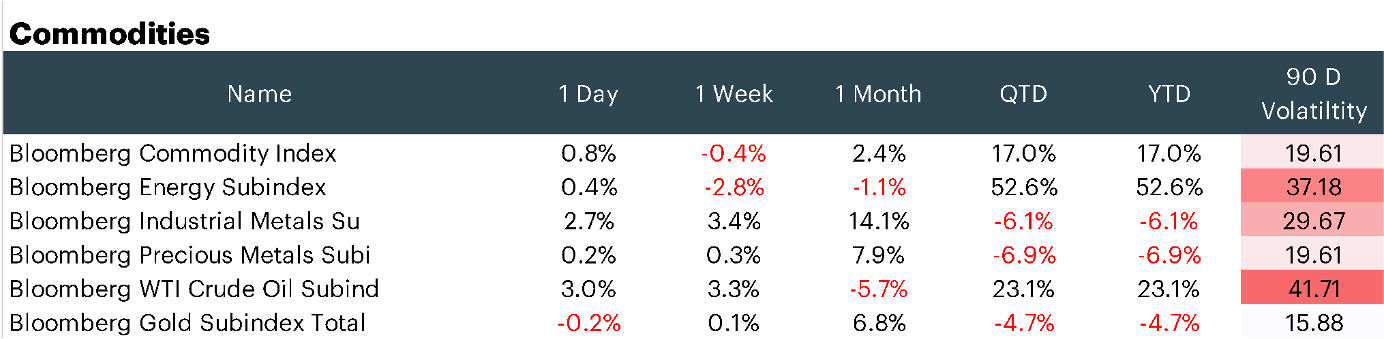
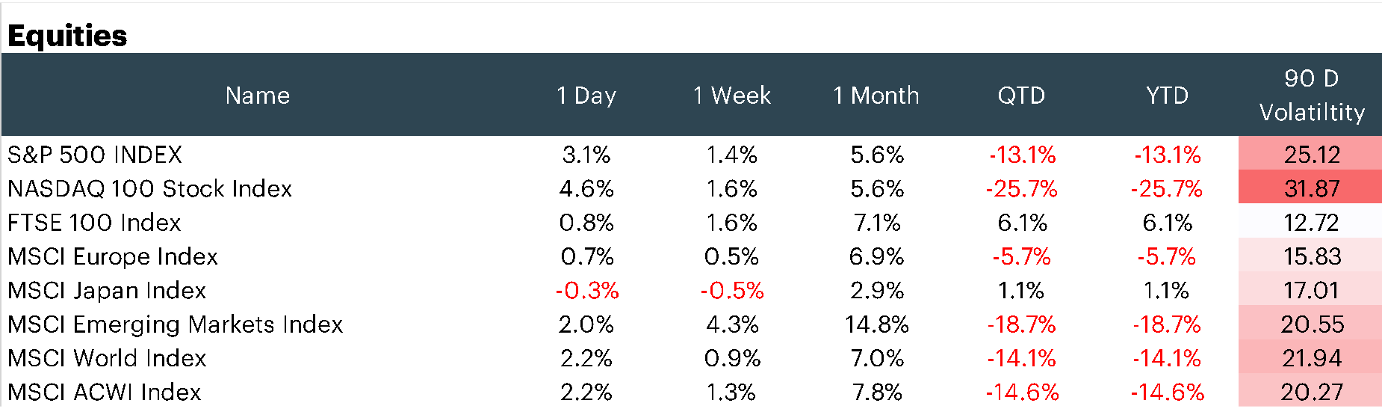
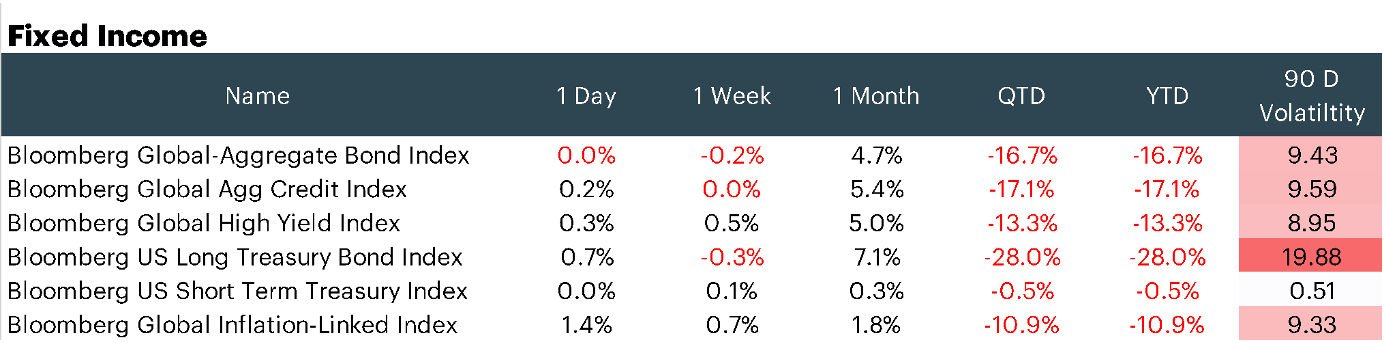
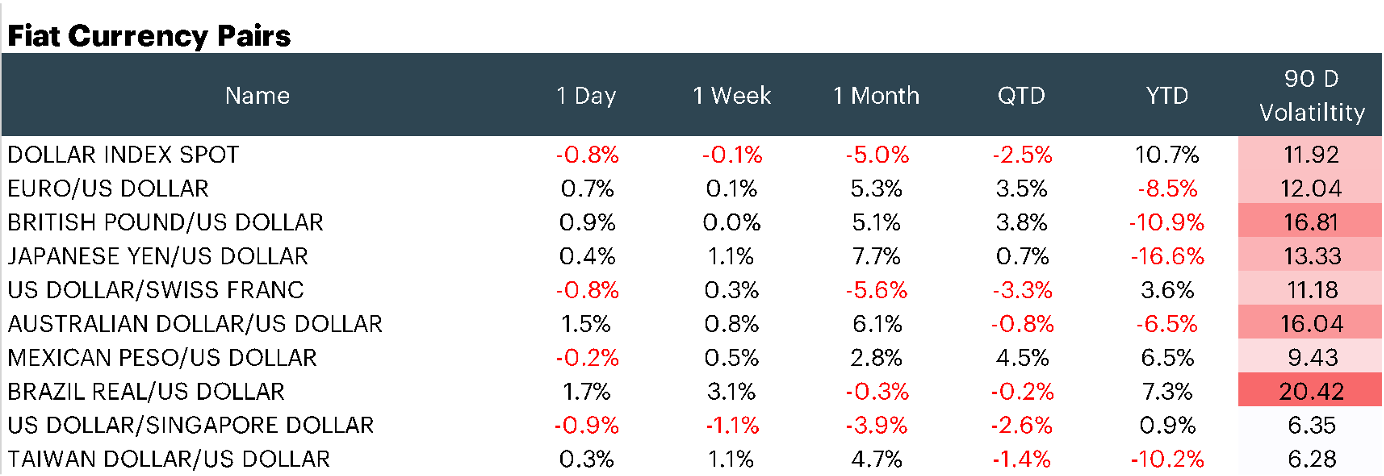
Appendix: Market Performance Overview
Appendix: constituent changes for current period
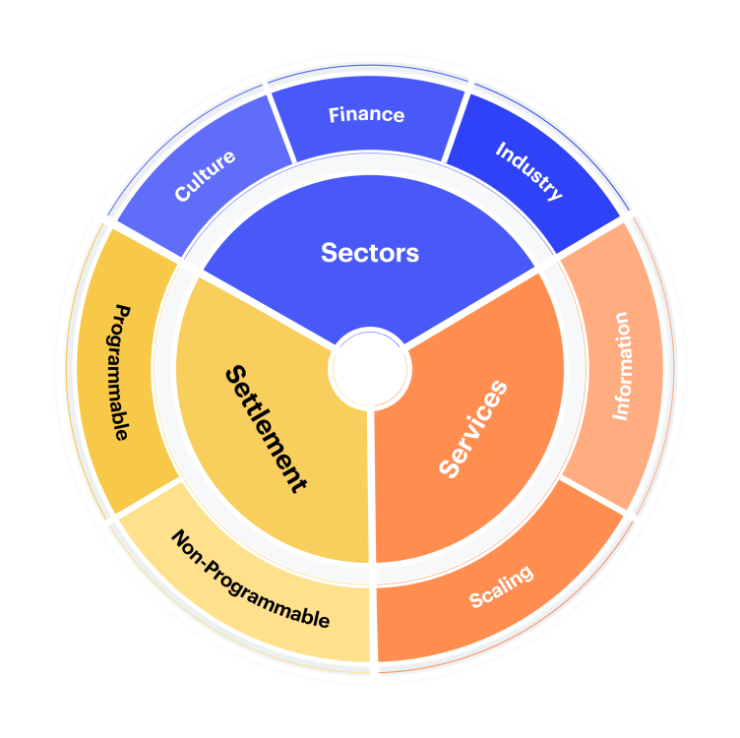
Appendix: CF Digital Asset Classification Structure
The CF Digital Asset Classification Structure (DACS) classifies coins and tokens based on the services that the associated software protocol delivers to end users, grouping assets by the role they play in delivering services to end users. The CF DACS powers CF Benchmarks' sector composite and category portfolio indices and allows users to perform attribution analysis to better understand the fundamental drivers of returns within their digital asset portfolios.
Additional Resources
For more information about our CF Benchmark indices and our methodologies, please visit the respective web links below:
- CF Diversified Large Cap Index
- CF DeFi Composite Index
- CF Web 3.0 Smart Contract Platforms Index
- CF Digital Culture Composite Index
- CF Blockchain Infrastructure Index
- CF Cryptocurrency Ultra Cap 5 Index
Contact Us
Have a question or would like to chat? If so, please drop us a line to:
The information contained within is for educational and informational purposes ONLY. It is not intended nor should it be considered an invitation or inducement to buy or sell any of the underlying instruments cited including but not limited to cryptoassets, financial instruments or any instruments that reference any index provided by CF Benchmarks Ltd. This communication is not intended to persuade or incite you to buy or sell security or securities noted within. Any commentary provided is the opinion of the author and should not be considered a personalised recommendation. Please contact your financial adviser or professional before making an investment decision.
Note: Some of the underlying instruments cited within this material may be restricted to certain customer categories in certain jurisdictions.
Factor Friday - July 24, 2026
Beta's four-week grind higher stalled this week as style leadership rotated again: Momentum took the top spot, last week's leader Value fell to the bottom, and Growth stayed July's weakest factor. Size remains the only style factor positive on the year; beta, not style selection, is setting returns.

Mark Pilipczuk
Changes to the Token Market Price Benchmarks Series - Market Prices – 21 July 2026
The Administrator has confirmed changes to the Token Market Price Family for the period 14 July 2026 to 21 July 2026.
CF Benchmarks
Softer CPI Reprices July Hike Risk & Lifts Digital Assets
Digital assets extended their recovery over the past week as cooler US inflation prints repriced Fed expectations; the bid was broad across the large cap indices, growth factor leadership returned, stablecoin funding repriced lower, and stress stayed isolated in names hit by token-specific news.
Mark Pilipczuk
By clicking Accept, you consent to CF Benchmarks's use of cookies.
Visit Cookie Settings to learn how CF Benchmarks uses cookies and to adjust your preferences.