
Aug 18, 2020
Introducing the CF Cryptocurrency Ultra Cap 5 Index
The CF Cryptocurrency Ultra Cap 5 Index accurately reveals which coins are driving the crypto market
There’s no mistaking that the crypto world is evolving at a dizzying pace. ‘Total Value Locked’ in DeFi (decentralized finance) recently passed $4bn for the first time. High profile investors like Paul Tudor Jones and hedge fund Renaissance Technologies have piled in of late. Ether futures volumes notched new daily highs in early August after Bitcoin’s turbo-charged acceleration a few months earlier.
Less flashy though no less important developments at the margins include that the U.S. Office of the Comptroller of the Currency, a banking regulator, last month confirmed that banks are allowed to custody cryptos for customers. The announcement is the latest milestone on the asset class’s road to broader acceptance by traditional financial institutions.
The irony accompanying this pace of developments though is that in many respects, the more things in crypto change, the more they stay the same – especially the lack of a reliable measure of market performance. Without more sophisticated performance measures than the “price of Bitcoin” (a problem that our CME CF Bitcoin Reference Rate has largely solved) it’s difficult to see how digital assets can achieve the mind share and resultant velocity required to escape niche status.
For now, crypto markets still lack the most rudimentary of barometers possessed of mainstream markets. It may seem flippant to note that there’s no S&P 500 of cryptocurrencies, but the dearth of reliable crypto indices that give investors a quick and easy way to gauge market performance is a key roadblock on their path to Main Street.
In fact, the shortfall between this asset class and wider market norms is even more fundamental. There is, after all, no broadly agreed definition of what ‘The Market’ is, when it comes to crypto. Without one, discussion and participation in that market must be conducted on the basis of approximation. That’s no way for a financial market to operate in the 21st Century.
More prosaically, it is highly problematic for key actors in the institutional space to participate in the crypto asset class as it stands. Most pension funds, asset management firms and financial advisors would struggle to articulate to clients an accurate and consistent measure of performance of the crypto asset class, let alone measure risk-adjusted returns.
As such, one basic starting point to begin addressing the definition problem would be to implement credible ways of determining market direction and returns at any given time. Whilst crypto has always been a “top heavy” asset class due to Bitcoin’s dominance in terms of market capitalisation, this in itself is not a barrier to a meaningful measure of market beta. Zooming out further, we can see that the top 5 cryptocurrencies have long accounted for the bulk of the crypto market’s total capitalisation. In fact, narrow leadership of an asset class is a common phenomenon, with many markets capable of being approximated by their top four or five assets. For instance, the entire US tech sector is often approximated by the performance of just four stocks, the so-called FANGs (Facebook, Amazon, Netflix, Google).
As the crypto asset class matures, broader gauges of the market will be required, and even further down the line, more granular gauges akin to sector indices in the equity asset class will be needed. But for now, a simple but rigorously calculated and maintained index that tracks the returns of the top 5 cryptocurrencies will suffice in providing Main Street with a quick way to understand how the crypto market is moving. To that end we propose the CF Cryptocurrency Ultra Cap 5 Index, a rules-based, capitalisation-weighted portfolio constituted of the top-five cryptocurrencies.
Figure 1. - CF Ultra Cap 5 capitalisation (total fungible supply) as a percentage of total market capitalisation; monthly: 31-08-2018 to 31-07-2020
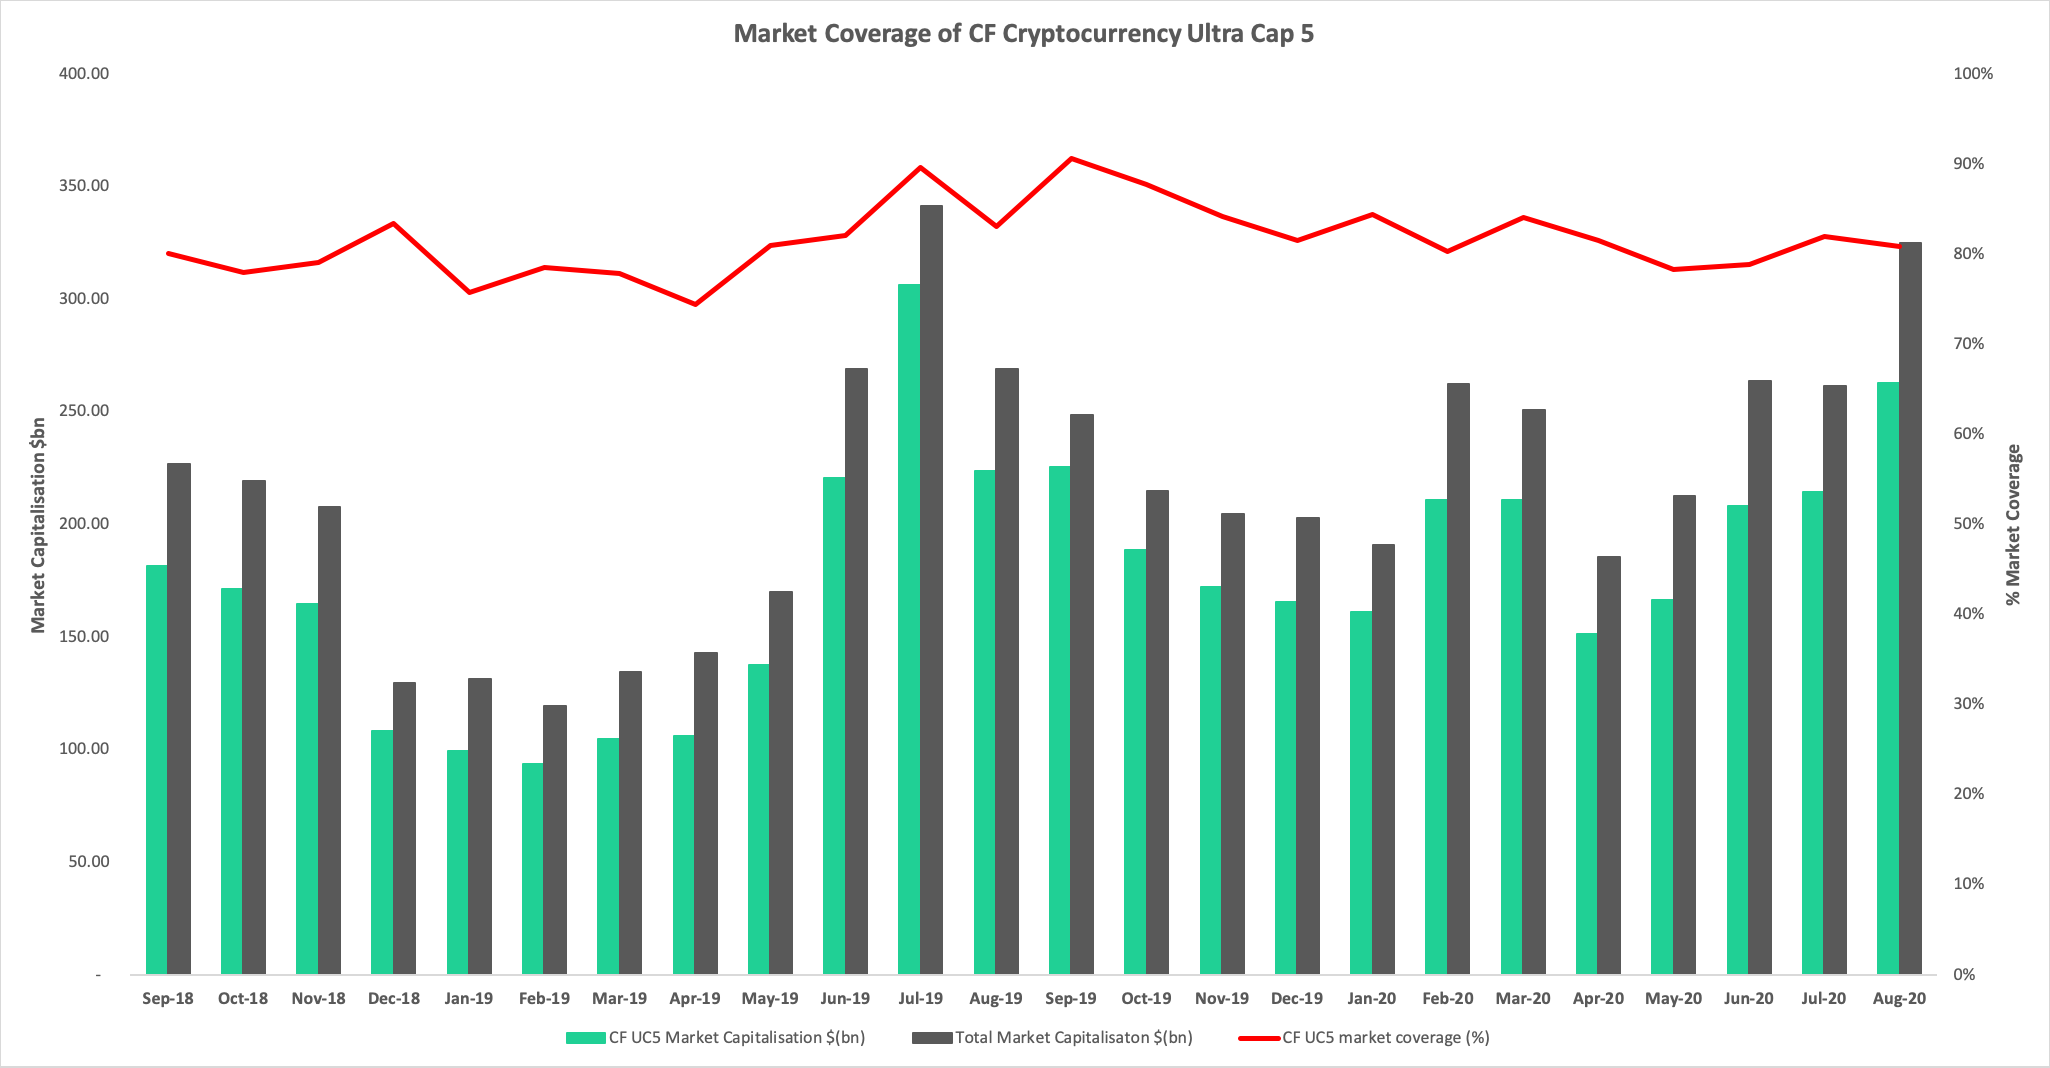
Sources: CF Benchmarks, coin360.com
Note that over a recent window of around two years, the CF Cryptocurrency Ultra Cap 5 Index represented between 75% and 90% of the crypto market’s total capitalisation (see Figure 1.) This confirms that it is an accurate analogue of the overall market.
Will Cai, a partner at asset management firm Wilshire Phoenix, which licenses CF Benchmarks’ Bitcoin Real Time Rate, commented: “With the crypto space garnering increased attention from large institutions, CF Benchmarks indices are elevating standards of price integrity and regulatory governance in the asset class, providing tools and products that are transparent and robust. CF Benchmarks’ Bitcoin Real Time Rate (CF BRR) was a trailblazer in crypto benchmarks and we use it with confidence in our own products because of its transparency and robustness. Like CF BRR, the upcoming Ultra Cap 5 is designed with institutional use in mind. We are looking forward to CF Benchmarks’ new portfolio index offering."
As we’ve seen, the crypto market has yet to widely adopt robust standardisation. This calls for a rigorous methodology that tackles deficiencies in the integrity of price and other crypto market data. In our view, CF Benchmarks’ CF Cryptocurrency Ultra Cap 5 Index systematically addresses these market fault lines by defining and adhering to three pillars that are critical for market validity. The first is ‘Transparency’. That relates to all aspects of how the index is produced, maintained and calculated. ‘Market Readiness’ indicates that the gauge is fully tooled-up for replicating market performance through a passive fund/ETF or for measuring the relative performance of an active fund. ‘High Integrity’ confirms that the index’s regulatory seal is watertight.
Below we elaborate on the key implications of the CF Ultra Cap 5 having achieved these three critical pillars.
- Transparency: The effect is the establishment of a public rules-based methodology that makes CF Ultra Cap 5 the only fully public rules-based multi-cryptocurrency index in existence
- Market Ready: The index is optimised for replication as a tradeable security, incorporating risk-facing concepts like free float, liquidity screening and buffering (i.e., churn minimisation)
- High Integrity: CF Benchmarks’ status as an authorised and regulated Benchmark Administrator means that the individual pricing sources for each constituent of its exchange are benchmarks in themselves. In turn, this corroborates the integrity of the pricing sources of each Ultra Cap 5 constituent and the index itself
Find out more about the CF Cryptocurrency Ultra Cap 5 Index here
The information contained within is for educational and informational purposes ONLY. It is not intended nor should it be considered an invitation or inducement to buy or sell any of the underlying instruments cited including but not limited to cryptoassets, financial instruments or any instruments that reference any index provided by CF Benchmarks Ltd. This communication is not intended to persuade or incite you to buy or sell security or securities noted within. Any commentary provided is the opinion of the author and should not be considered a personalised recommendation. Please contact your financial adviser or professional before making an investment decision.
Note: Some of the underlying instruments cited within this material may be restricted to certain customer categories in certain jurisdictions.
Sticky Inflation, a Hawkish Fed, and a Broad Pullback
Risk appetite faded in May as a hawkish Fed and reaccelerating 3.8% inflation ended April's rebound. Every CF Benchmarks index posted losses, spot Bitcoin ETFs shed roughly $2.4bn in their largest 2026 outflow, and implied volatility slid to fresh lows.

Gabriel Selby
Changes to the Token Market Price Benchmarks Series - Market Prices – 02 June 2026
Changes to the Token Market Price Benchmarks Series - Market Prices – 02 June 2026.
CF Benchmarks
Addition of Constituent Exchanges for the CME CF Cryptocurrency Pricing Products
The Administrator announces the addition of CME CF Constituent Exchanges for the CME CF Cryptocurrency Pricing Products from June 08th, 2026.
CF Benchmarks
By clicking Accept, you consent to CF Benchmarks's use of cookies.
Visit Cookie Settings to learn how CF Benchmarks uses cookies and to adjust your preferences.