
Jul 24, 2026
Factor Friday - July 24, 2026
The Market Stalls as Factor Leadership Rotates Again
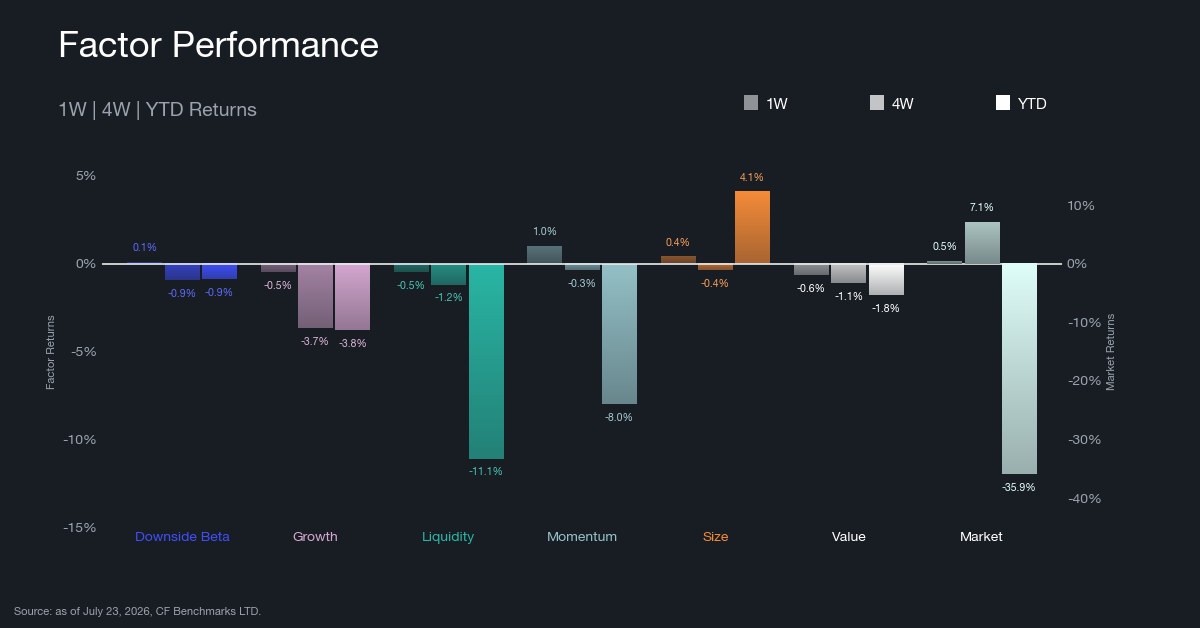
For the week ending July 23, the Market gained +0.51%, a fourth consecutive weekly gain but the smallest of the run, confirming that the beta rally that began in late June is stalling. Style leadership rotated once more: Momentum led at +1.02%, its first turn at the top after slipping negative last week, while Value did the opposite, falling to the bottom of the style field at -0.65% after leading it a week ago. Size (+0.42%) and Downside Beta (+0.11%) held modest gains, while Liquidity (-0.46%) and Growth (-0.49%) remained soft. Over four weeks the Market factor is up +7.13% and dwarfs every style factor, and Growth (-3.67%) is the weakest. Year-to-date, Size (+4.11%) is still the only positive style factor, Liquidity (-11.08%) is the weakest style, and the Market stands at -35.95%, recovering for a fourth straight week. Beta continues to do the heavy lifting while no style factor has held leadership for more than a week; the rotation from Value to Momentum, with Growth stuck at the bottom, points to a market driven by broad direction rather than any durable factor theme.
Rolling Factor Rankings and Rotation
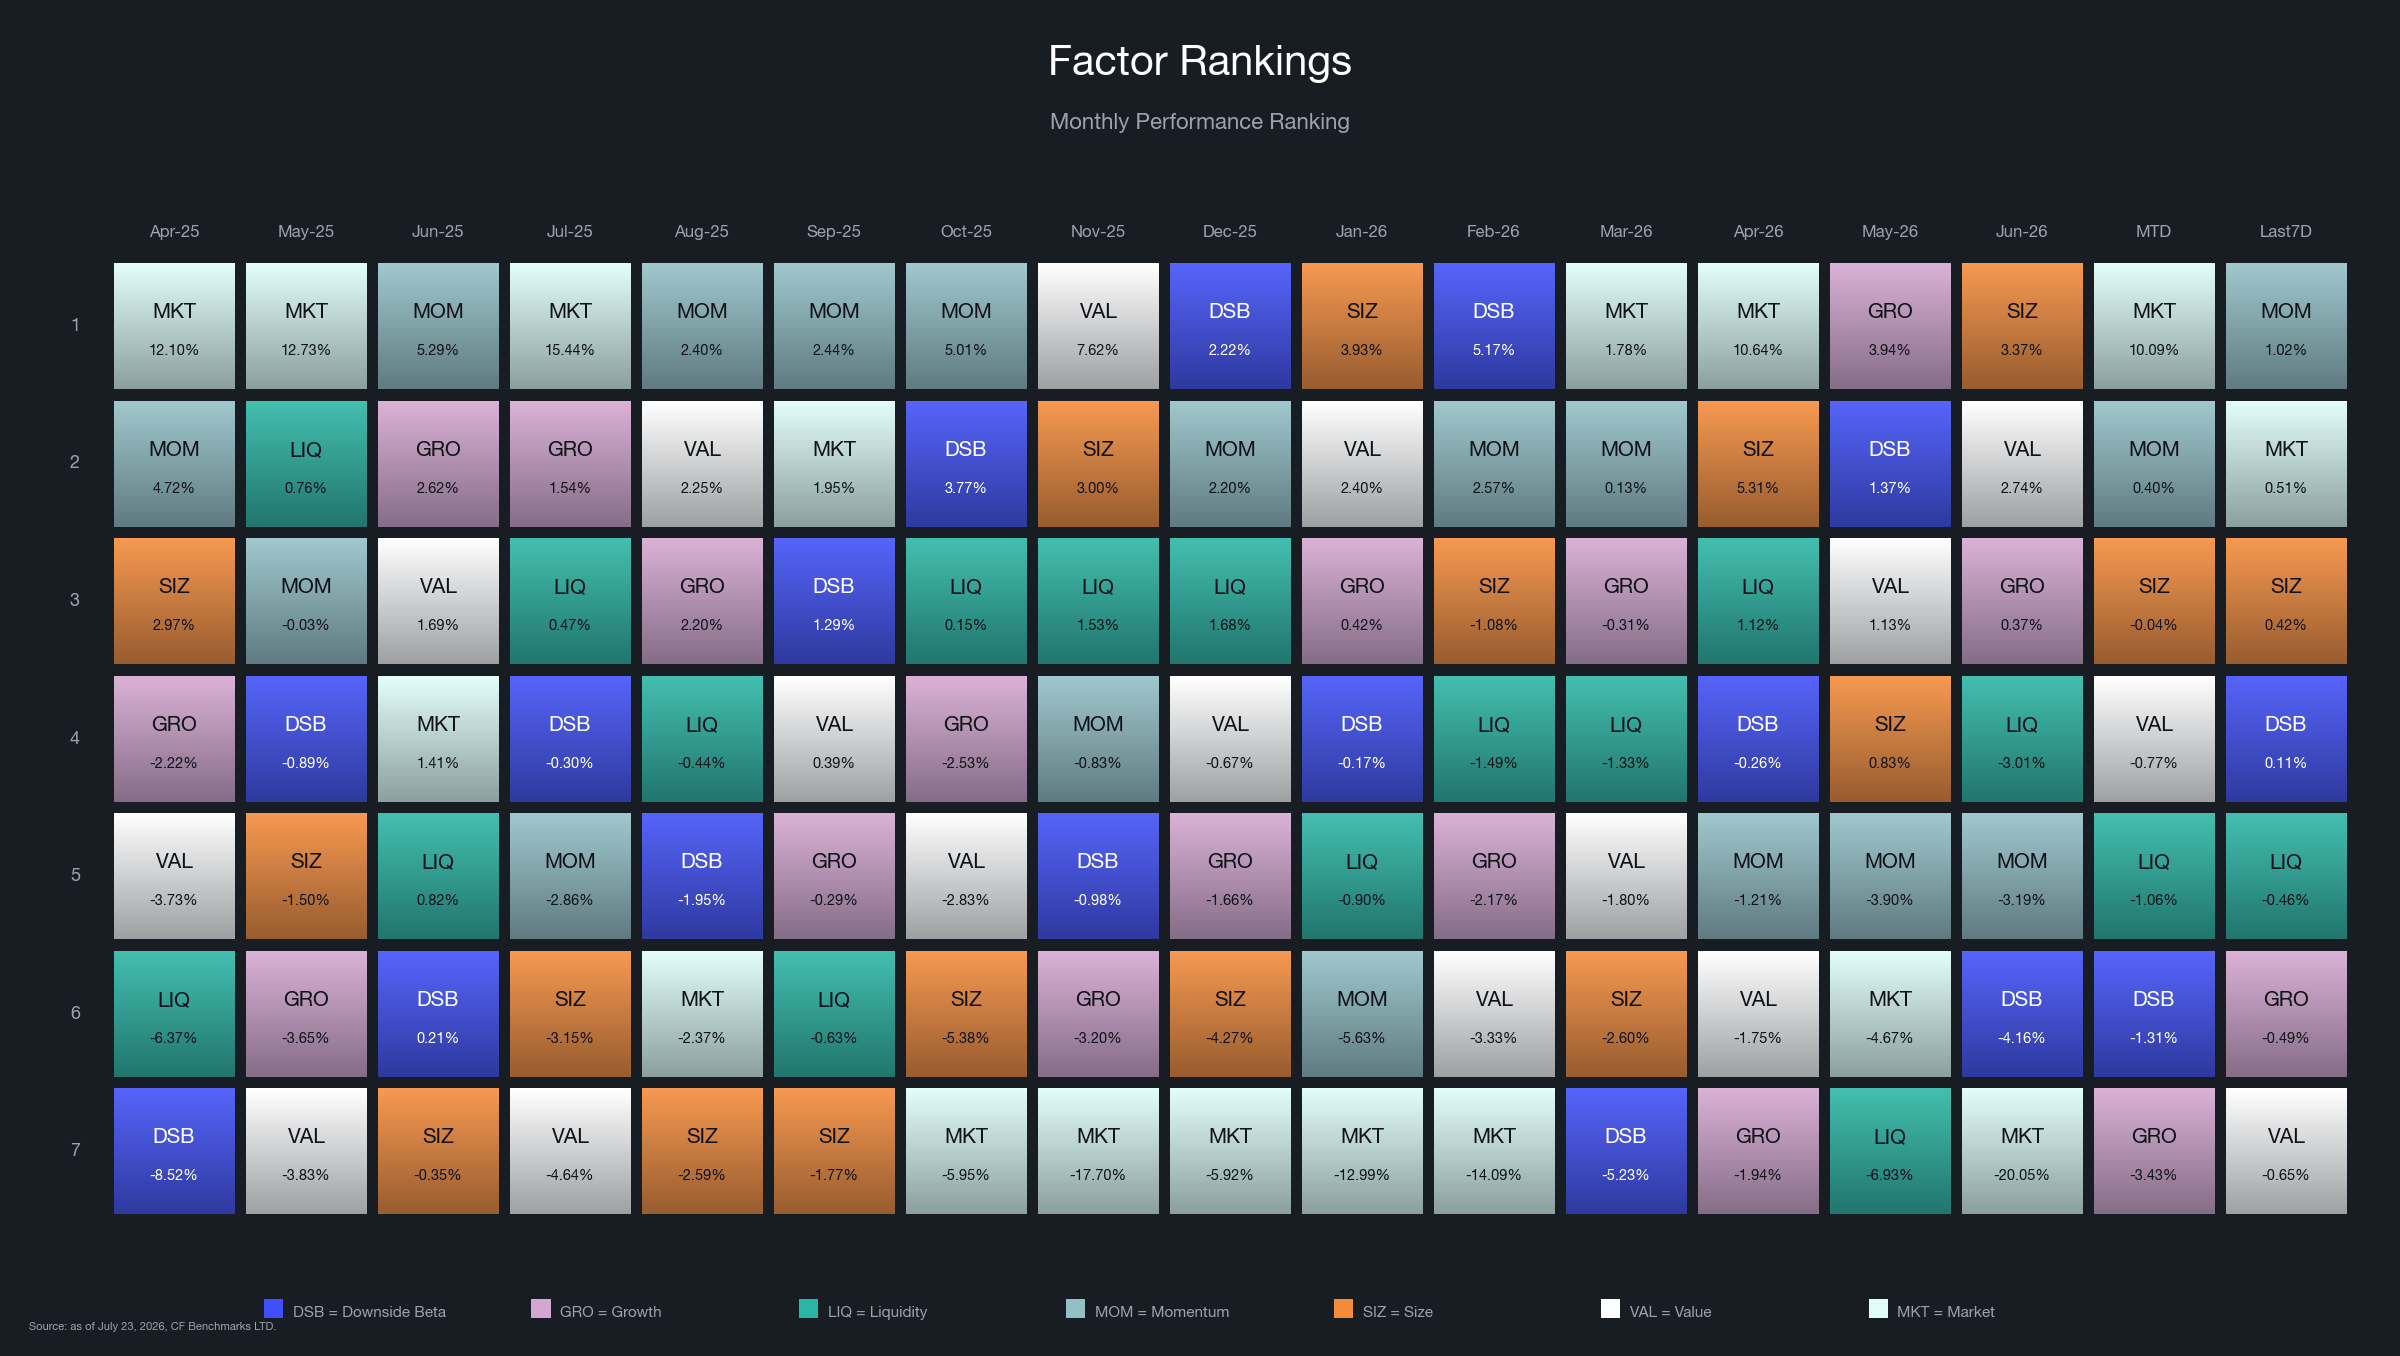
The quilt chart shows the Market holding the top of the July month-to-date table at +10.09%, more than three times the next factor; this remains a beta month even as the weekly increments have shrunk toward zero. Beneath it the style ranks keep churning. Momentum climbed from negative territory a week ago to the top of the weekly table, Size posted its firmest contribution in weeks, and Value produced the sharpest reversal, dropping from the style lead to the bottom; last week's quality bid has not compounded. Downside Beta posted a small gain for a second straight week, suggesting the post-drawdown defensive unwind has run its course, while Liquidity and Growth stayed in the lower half. Month-to-date, outside the broader market Market only Momentum (+0.40%) is positive, and Growth anchors the table at -3.43%. Weekly winners are not carrying into the next week; the only consistent signals are a dominant but decelerating beta and a Growth factor that has led July's declines throughout.
Market and Key Factor Betas
Market Beta
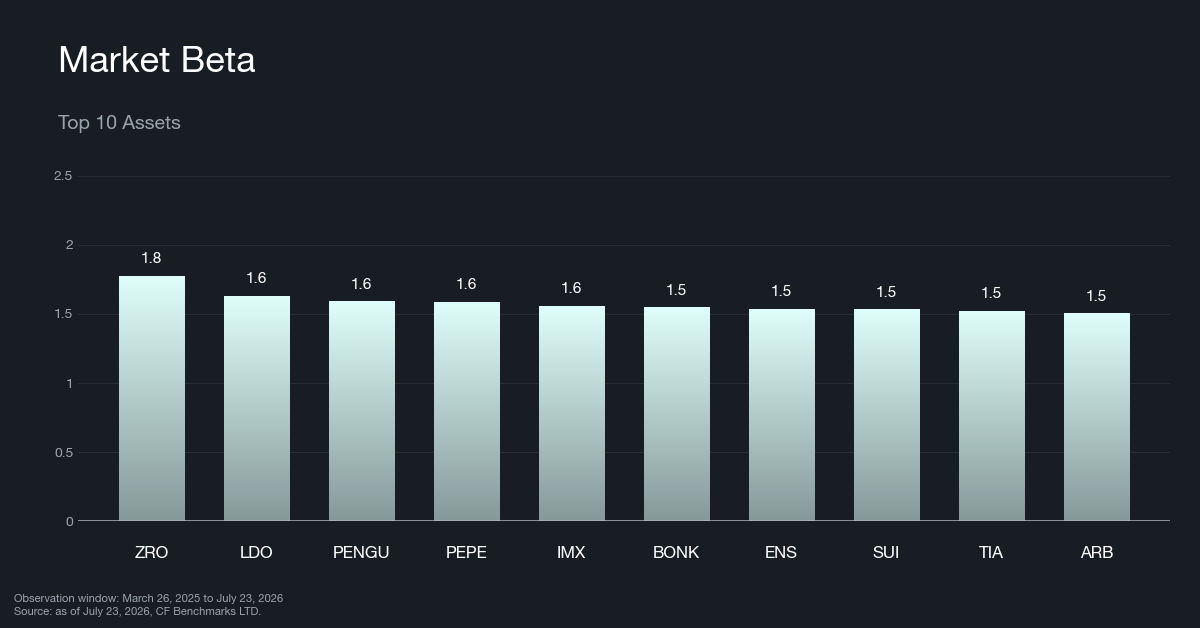
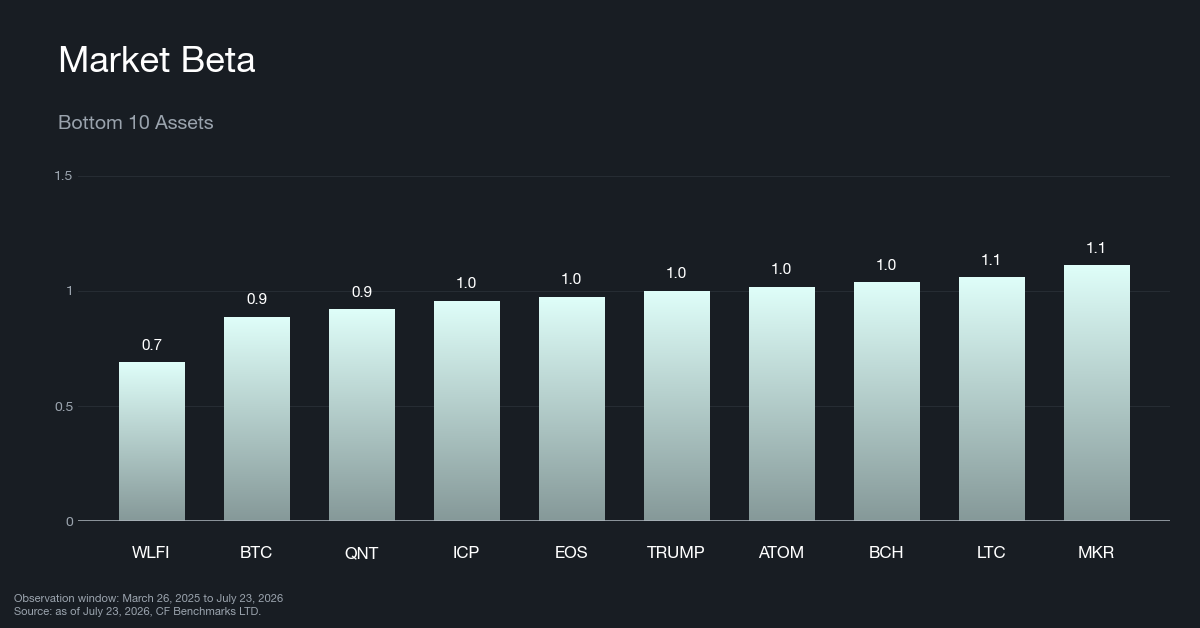
The composition of market-beta exposure was essentially unchanged this week, with the same names at both ends of the list. The high-beta cohort remains concentrated in meme coins, layer-2 and interoperability tokens, and liquid-staking and DeFi names, led by a cross-chain messaging token whose beta compressed toward 1.77 from near 1.88 a week earlier. At the defensive end, Bitcoin sits near 0.88 and a newly launched governance token anchors the bottom below 0.7, with older smart-contract and payment chains and a blue-chip DeFi governance token filling out the low-beta group. With the Market up only +0.51%, the high-beta names added little this week, consistent with a beta rally that is flattening, and these same names still carry the deepest year-to-date drawdowns in the universe.
Size
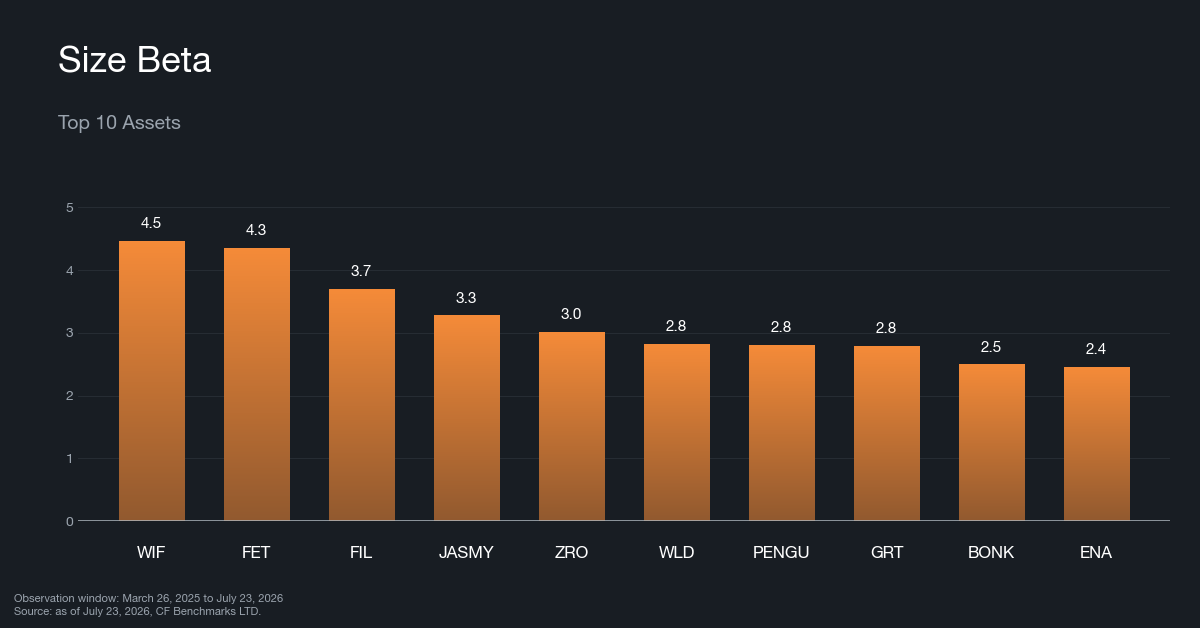
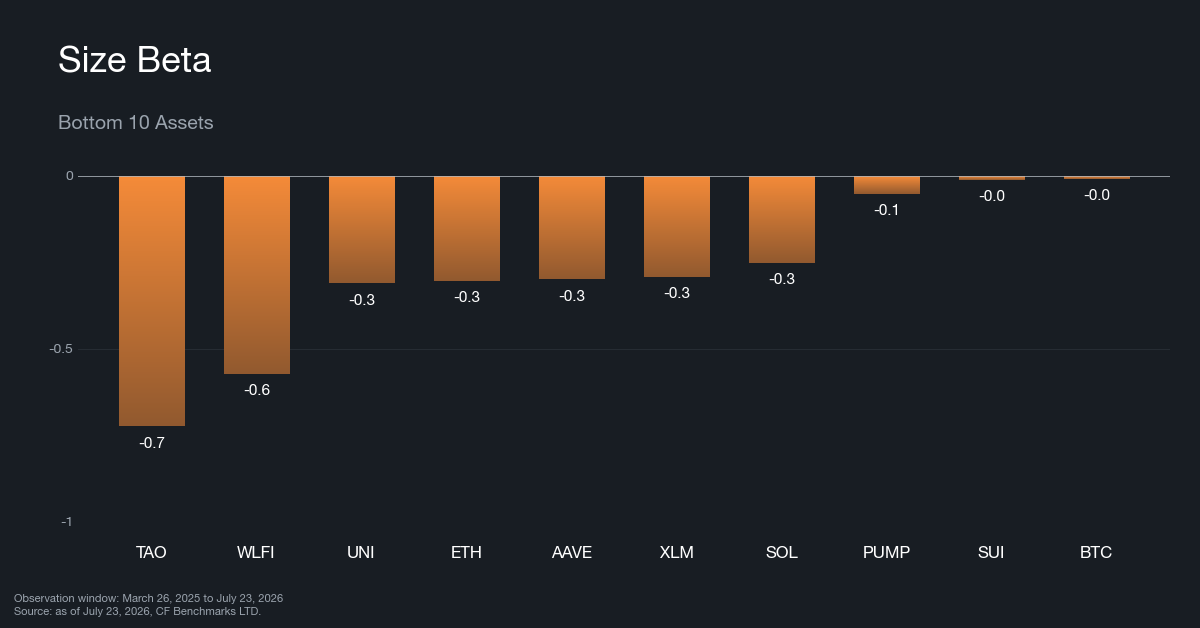
High size-beta assets, those that behave most like small caps, remain dominated by meme coins, AI-infrastructure tokens, and storage and compute networks. Composition shifted modestly: a synthetic-dollar DeFi token entered the top 10 as a gaming and metaverse name dropped out, and the cross-chain messaging token that had topped the list saw its size beta fall by more than a full point, ceding the top spot to a leading meme coin. The low size-beta end, populated by large-cap layer-1s and blue-chip DeFi protocols with Bitcoin near zero, saw a launchpad token enter as an older payment-chain fork exited. Size returned +0.42% for the week and remains the only style factor in positive territory year-to-date at +4.11%. It is the most durable factor signal in the market even as its weekly contributions stay small: the small-cap premium has quietly persisted through a period in which every other style factor has turned negative for the year.
Growth
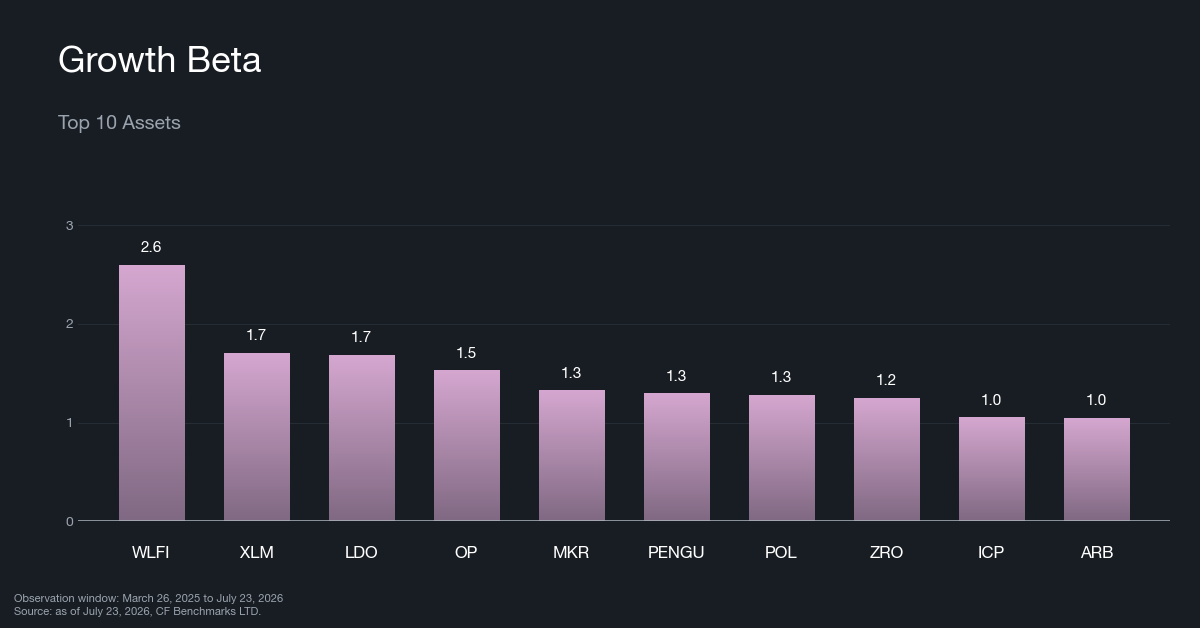
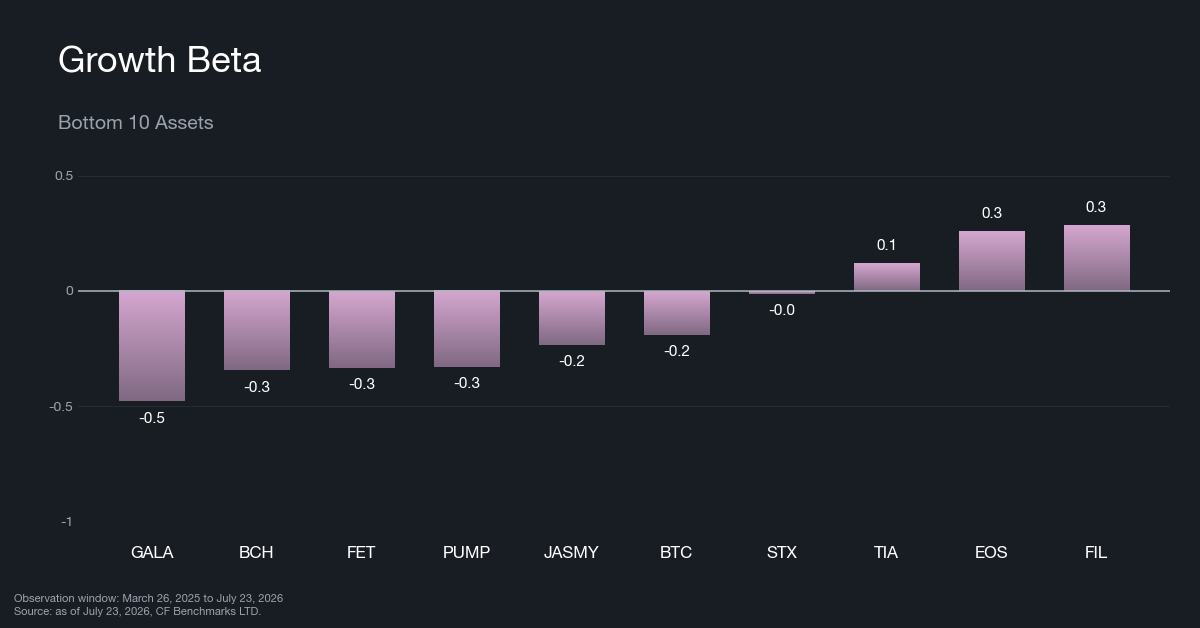
The high growth-beta cohort, the assets most sensitive to network-adoption trends, is led by a newly launched governance token and clusters in layer-2 scaling tokens, blue-chip DeFi protocols, and a major payment network. The list was stable week over week, with only minor reordering and no entries or exits, though the cross-chain messaging token's growth beta eased. At the low end, sensitivity is anchored by gaming, AI, and launchpad tokens alongside older smart-contract chains and Bitcoin, with a storage network entering the bottom 10 as a blue-chip DeFi token exited. Performance is still the constraint: Growth fell -0.49% and has been the weakest factor over both the four-week and month-to-date windows. The market continues to discount network-adoption narratives, and until that shifts, high growth-beta names, concentrated in layer-2 scaling and DeFi, have shown little sign of taking leadership.
What Factors are Driving Markets
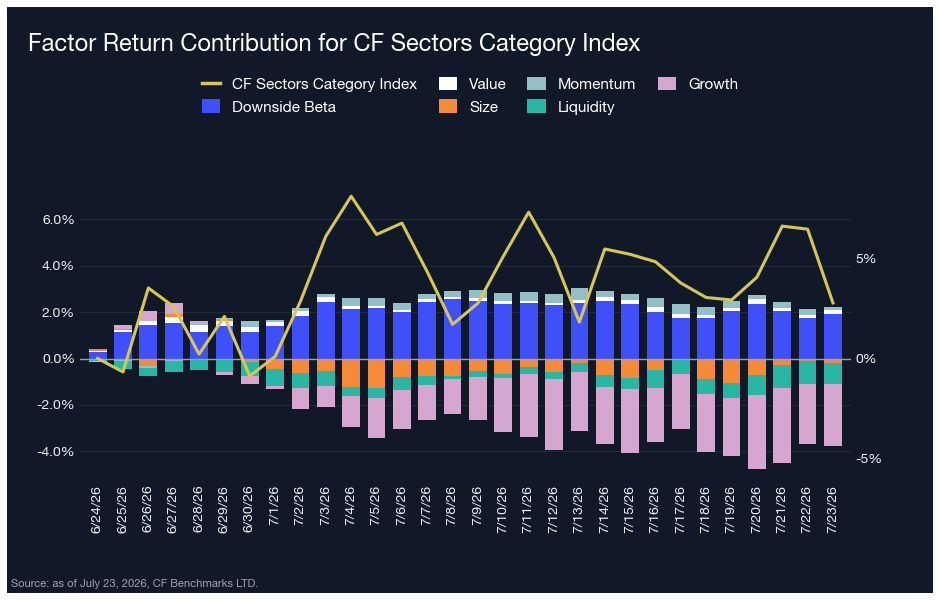
Factor contributions across the CF DACS Sectors universe total roughly -1.6% over the trailing 30 days, while the Sectors index returned +2.8% over the same window, leaving the index about 4 percentage points ahead of the factor sleeve. This is a clean reversal from recent weeks, when factor tilts preserved value against a falling index. The sharp mid-June drawdown has now rolled out of the trailing 30-day window and the subsequent recovery has rolled in, lifting the passive index while cross-sectional style dispersion contributed little. Downside Beta was the dominant positive contributor at +1.9%, with Momentum and Value marginally additive, while Growth was again the largest drag at -2.7% and Liquidity subtracted -0.9%. With beta leading the market, passive Sectors exposure has outrun the factor sleeve.
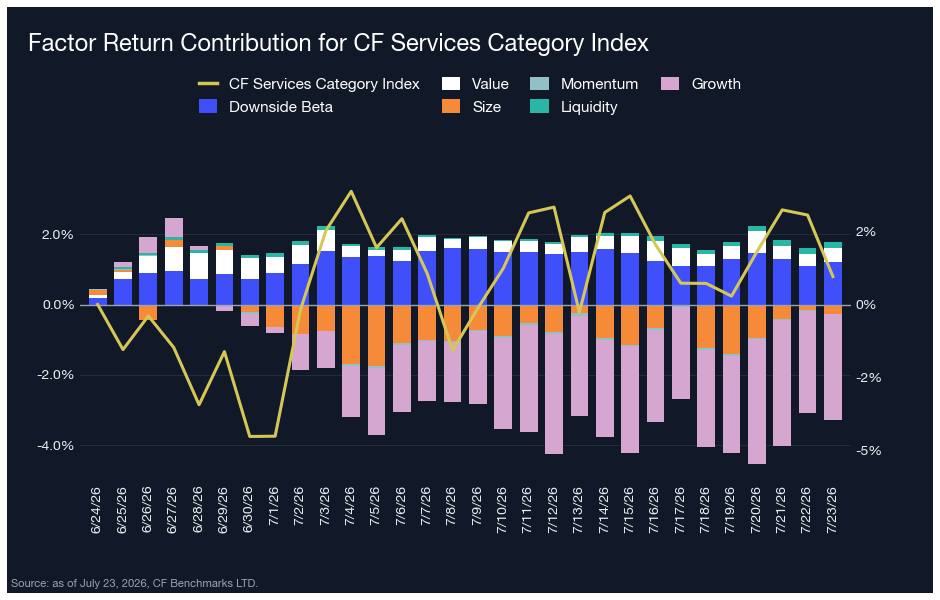
In the CF DACS Services universe, factor contributions net to approximately -1.5% over 30 days against a Services index return of +1.0%, a gap of about 2 percentage points with the index ahead. As in Sectors, the window roll is the driver: the June relief bounce now sits inside the trailing 30 days while the drawdown has dropped out. Downside Beta led contributions at +1.2% and Value added +0.4%, while Growth was once more the heaviest drag at -3.0%, the largest single-factor detractor across the three universes. Services shows the narrowest factor-versus-index gap this week, but the direction is the same: broad market movement, not style selection, is setting returns.
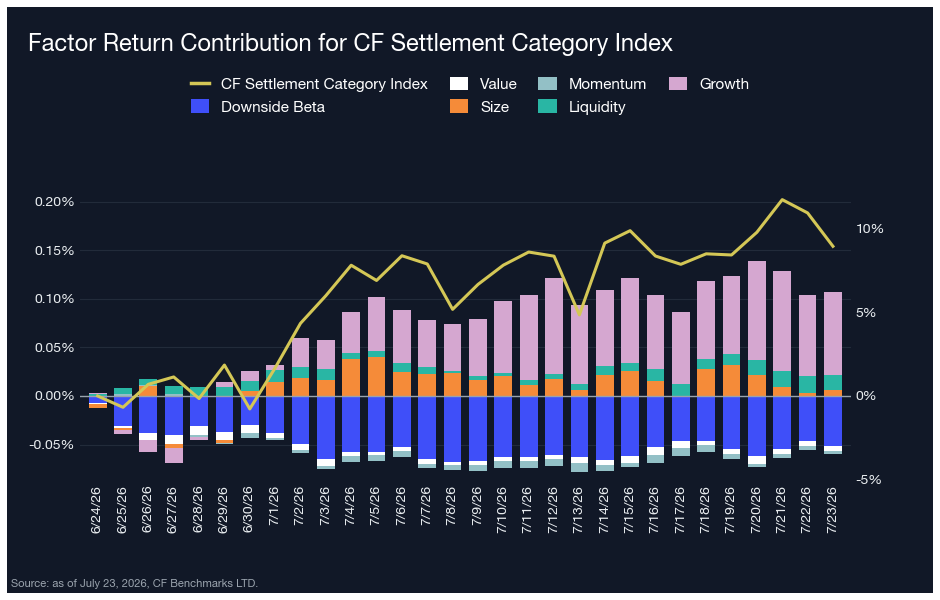
The Settlement universe, dominated by Bitcoin and core settlement-layer assets, again traded on broad market direction alone. Factor contributions net to essentially zero over the trailing 30 days while the Settlement index rose +8.9%, leaving the widest index-versus-factor spread of the three universes at roughly 9 percentage points. With Bitcoin leading the recent advance, beta did all of the work; cross-sectional style dispersion added nothing.
Appendix: CF Factor Methodology
Market Factor
The market factor captures the broad, systematic risk that permeates the digital asset ecosystem. It reflects aggregate influences such as macroeconomic conditions, investor sentiment, and overall market volatility. As such, this factor is defined by the daily returns of the CF Broad Cap (Free Float Market Cap Weight) Index, offering a comprehensive and capitalization-weighted representation of the asset class.
Size Factor
The size factor captures the return differential associated with asset scale, reflecting the hypothesis that smaller-cap digital assets tend to outperform their larger-cap counterparts. This effect is understood to compensate for elevated operational and financial risks while exploiting potential market inefficiencies. In this framework, the size factor is defined by each asset’s fully diluted market capitalization. The value is sign-inverted so that higher z-scores are assigned to smaller assets and vice-versa.
Value Factor
The value factor reflects a protocol’s ability to generate economic output relative to its capital base and market valuation, combining measures of both efficiency and user engagement. It is constructed as the average z-score of two key ratios: transaction fees relative to total value locked (Fees/TVL) and daily active users relative to market capitalization (DAU/MCap). This composite metric captures how productively a protocol utilizes its resources while also serving as a proxy for user-driven demand. A higher combined score indicates efficient resource utilization and strong user engagement.
Momentum Factor
The momentum factor captures short-term price persistence by identifying assets that have recently exhibited strong performance. It is computed as the average z-score of two metrics: the 2 weeks cumulative performance and the 2 weeks risk-adjusted cumulative performance. This approach aligns with established findings in traditional financial literature and demonstrates empirical relevance in digital assets, where price trends tend to exhibit momentum over short horizons.
Growth Factor
The growth factor captures the expansion of a protocol’s network activity and user adoption. In the context of digital assets, it reflects metrics such as fee generation and user engagement, which serve as indicators of increased platform utilization and operational scale. The factor is defined as the average z-score of 30-day fee growth and 30-day weekly active user growth, thereby identifying assets exhibiting consistent and measurable increases in underlying network usage.
Downside Beta
The downside beta factor captures an asset’s sensitivity to adverse market conditions by isolating its behavior during periods of negative market returns. Empirical evidence shows that assets with lower downside beta tend to outperform their higher-beta counterparts over the long-term, due to their reduced participation in market drawdowns and more stable return profiles during periods of elevated volatility. As such, it is estimated through a regression of the asset’s daily returns over the most recent four-week period against market returns observed exclusively during negative sessions. The resulting value is sign-inverted to ensure that assets with lower downside exposure are assigned higher z-scores.
Liquidity Factor
The liquidity factor captures the ease with which a digital asset can be traded without significantly impacting its price. Empirical evidence shows that illiquid assets tend to command a higher risk premium than their more liquid counterparts, serving as compensation for trading friction and price volatility. To quantify this, the factor is measured using token turnover, defined as trading volume as a percentage of circulating supply. The value is sign-inverted such that higher z-scores are assigned to less liquid assets.
For further detail, view the CF Factors Methodology Document, the CF Factor Data Suite, and Our paper “A Factor Model for Digital Assets” in Springer Nature’s Mathematical Research for Blockchain Economy
The information contained within is for educational and informational purposes ONLY. It is not intended nor should it be considered an invitation or inducement to buy or sell any of the underlying instruments cited including but not limited to cryptoassets, financial instruments or any instruments that reference any index provided by CF Benchmarks Ltd. This communication is not intended to persuade or incite you to buy or sell security or securities noted within. Any commentary provided is the opinion of the author and should not be considered a personalised recommendation. Please contact your financial adviser or professional before making an investment decision.
Note: Some of the underlying instruments cited within this material may be restricted to certain customer categories in certain jurisdictions.
Factor Friday - October 2, 2026
Size led the factor table at 8.86% as the Market finished flat, with Downside Beta and Liquidity next and Momentum last. Much of the move traces to Quant (QNT), up 200% on the week, so the rotation is narrower than the rankings suggest.

Mark Pilipczuk
Crypto Rallies After The CLARITY Act Stalls
Digital assets rallied in September despite the Fed's first rate hike since 2023 and a failed Senate vote on the CLARITY Act. All eight CF Benchmarks indices rose, led by DeFi at 31.8%, as smaller caps outpaced the majors and fund inflows slowed to $3.8 billion, down 35.3% from August.
Mark Pilipczuk
Market Outlook - Q4, 2026
Digital assets rallied through a Fed hike and a failed CLARITY Act vote. Our Q4 outlook argues that usage earns a return only where it reaches tokenholders, and tests that view across protocol fees, tokenized equities, perpetuals and stablecoins.
Mark Pilipczuk
By clicking Accept, you consent to CF Benchmarks's use of cookies.
Visit Cookie Settings to learn how CF Benchmarks uses cookies and to adjust your preferences.