
Sep 30, 2026
Market Outlook - Q4, 2026
Executive summary
Digital assets advanced sharply in the third quarter despite renewed monetary tightening and a setback for US market-structure legislation. That resilience shapes our Q4 outlook. Higher policy rates remain a headwind, but strengthening money growth, expectations of continued fiscal support and expanding onchain activity provide counterweights. Growth is uneven, with household spending outpacing income and investment supporting demand. Inflation is moderating incompletely, which leaves further Fed tightening possible. Our positioning view is measured Bitcoin exposure today, while we watch whether funding conditions and policy implementation reinforce market strength.
Beyond Bitcoin, our strongest evidence concerns the link between protocol activity and token value. High-fee protocols outperformed lower-fee peers, including in a forward-ranked comparison, which supports selective exposure where usage reaches holders through credible economic mechanisms. Tokenized equities are developing active secondary markets, perpetuals venues are expanding into traditional assets, and cheaper transactions are encouraging stablecoin usage. Adoption alone is not enough. Sustainable fees, investor rights and value capture determine the investment opportunity. The US midterms will test policy durability, and energy disruption remains an external risk. Across these themes, we retain liquid Treasury RWAs as capital for additions and favor demonstrated demand over political promises.
Market Recap: A Relief Rally, a Hawkish Turn and a Broad Advance
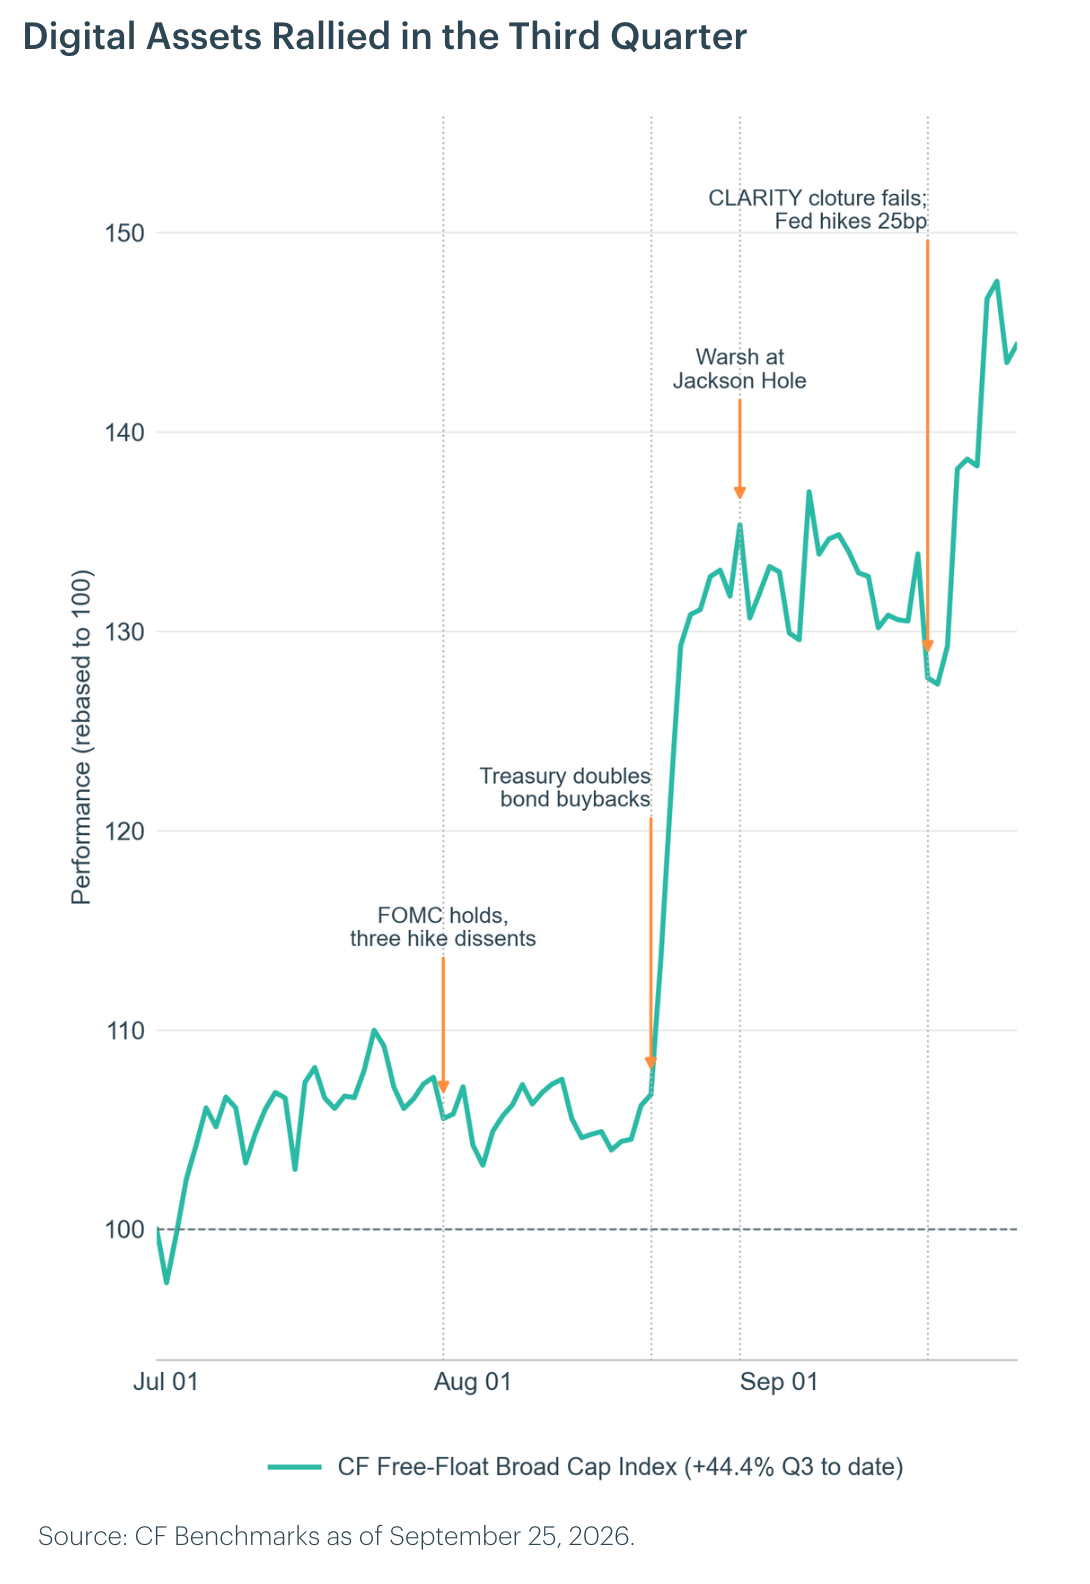
July brought relief on inflation but not on policy. June CPI slowed to 3.5% year over year against a 3.8% consensus, led by lower energy prices, yet the Federal Reserve held rates at 3.50% to 3.75% on July 29 with three officials dissenting in favor of a hike. US strikes on Iran and a naval blockade left the Strait of Hormuz closed at month end. Digital asset funds returned to net inflows after a record eight-week outflow streak. The CF Free-Float Broad Cap Index rose 7.2% as the Nasdaq Composite fell 3.2%, and the CF DeFi Composite Index led the flagship indices at 14.8%.
August set a firmer policy tone against a sharp crypto advance. A soft July jobs report and core PCE inflation holding at 3.3% preceded Chair Kevin Warsh's August 28 Jackson Hole remarks, which named inflation the greater concern and lifted September hike odds above 60%. Spot Bitcoin ETFs took in more than $3 billion, their strongest month of 2026, and Treasury proposed its first stablecoin rules under the GENIUS Act. All six flagship indices posted double-digit gains. The CF Digital Culture Index led at 51.3%, and the Broad Cap Index rose 24.4%, its best month of the quarter.
September delivered the firmest policy turn of the cycle. After August payrolls beat expectations and core CPI ran a tenth above consensus, the Fed raised its target range a quarter point to 3.75% to 4.00% on September 16, its first hike since July 2023. The vote was unanimous, and 16 of 18 officials project another hike this year. A day earlier, a Senate cloture vote on the CLARITY Act failed 49 to 50, leaving the bill with no scheduled path back to the floor. Brent traded above $100 on renewed fire in the Strait of Hormuz. Digital assets advanced regardless. Spot Bitcoin ETFs drew $999 million on September 21, their largest day of 2026. Through September 25, the DeFi Composite Index rose 29.8% and turned positive for the year, while the Broad Cap Index gained 8.4%, bringing its third-quarter advance to 44.4%.
Measuring Growth: AI Investment Supports Demand, but Breadth Matters
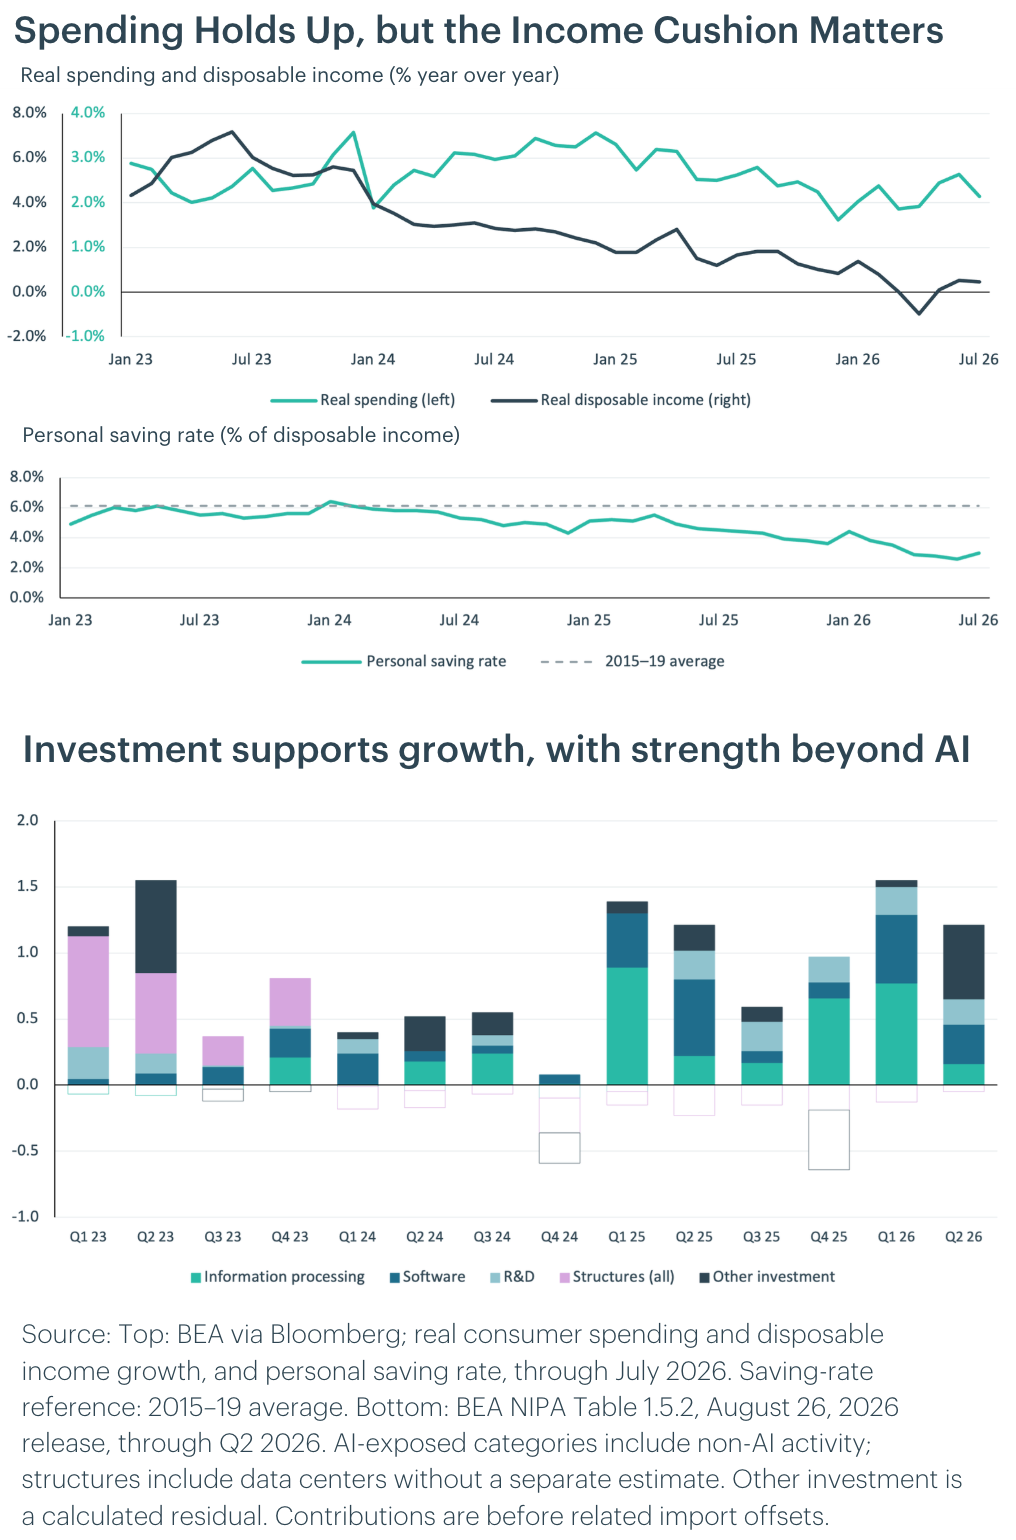
AI-related investment provides a source of demand alongside power infrastructure and public procurement. Over the next twelve months these areas can support expansion even as household spending faces constraints. Their benefits are concentrated across industries, however, and do not translate immediately into broad hiring or stronger household incomes. The risk is not an outright decline in AI spending. A slower pace of investment growth would reduce its contribution to GDP even if spending stayed high, which makes demand beyond the largest technology platforms increasingly important. We would watch whether investment broadens across businesses and whether adoption delivers revenue and productivity gains large enough to sustain commitments. Software, equipment and structures also include substantial non-AI activity, so their GDP contributions measure AI-exposed investment, not AI's economic impact precisely.
The consumer holds up but has less cushion. Household spending remains a foundation of the expansion, but it has outpaced real income growth, which leaves less room to absorb higher energy and borrowing costs. Households with assets and fixed-rate borrowing are better insulated than those relying on revolving credit or seeking new financing. A subdued hiring market can coexist with continued consumption while layoffs remain contained. A shift toward job losses would be more consequential. We expect continued but uneven spending, and the key test is whether income growth catches up with consumption before households need to rebuild their saving cushion. Our central view is continued, uneven expansion, with greater vulnerability if consumption and investment weaken together.
Portfolio perspective: An uneven expansion favors businesses with visible demand, sustainable financing and a credible path from investment to earnings. AI, power and infrastructure offer opportunities, but heavy spending alone does not establish attractive returns. Tokenized equities can provide access where available, while valuation, liquidity and investor rights remain central. Within digital assets, network activity matters only if it supports durable economics and value for tokenholders. We favor selective AI, power and infrastructure beneficiaries, including tokenized equities where available, and within digital assets we prioritize demonstrated adoption and a credible link between usage and token value.
Measuring inflation: disinflation continues, but the composition matters
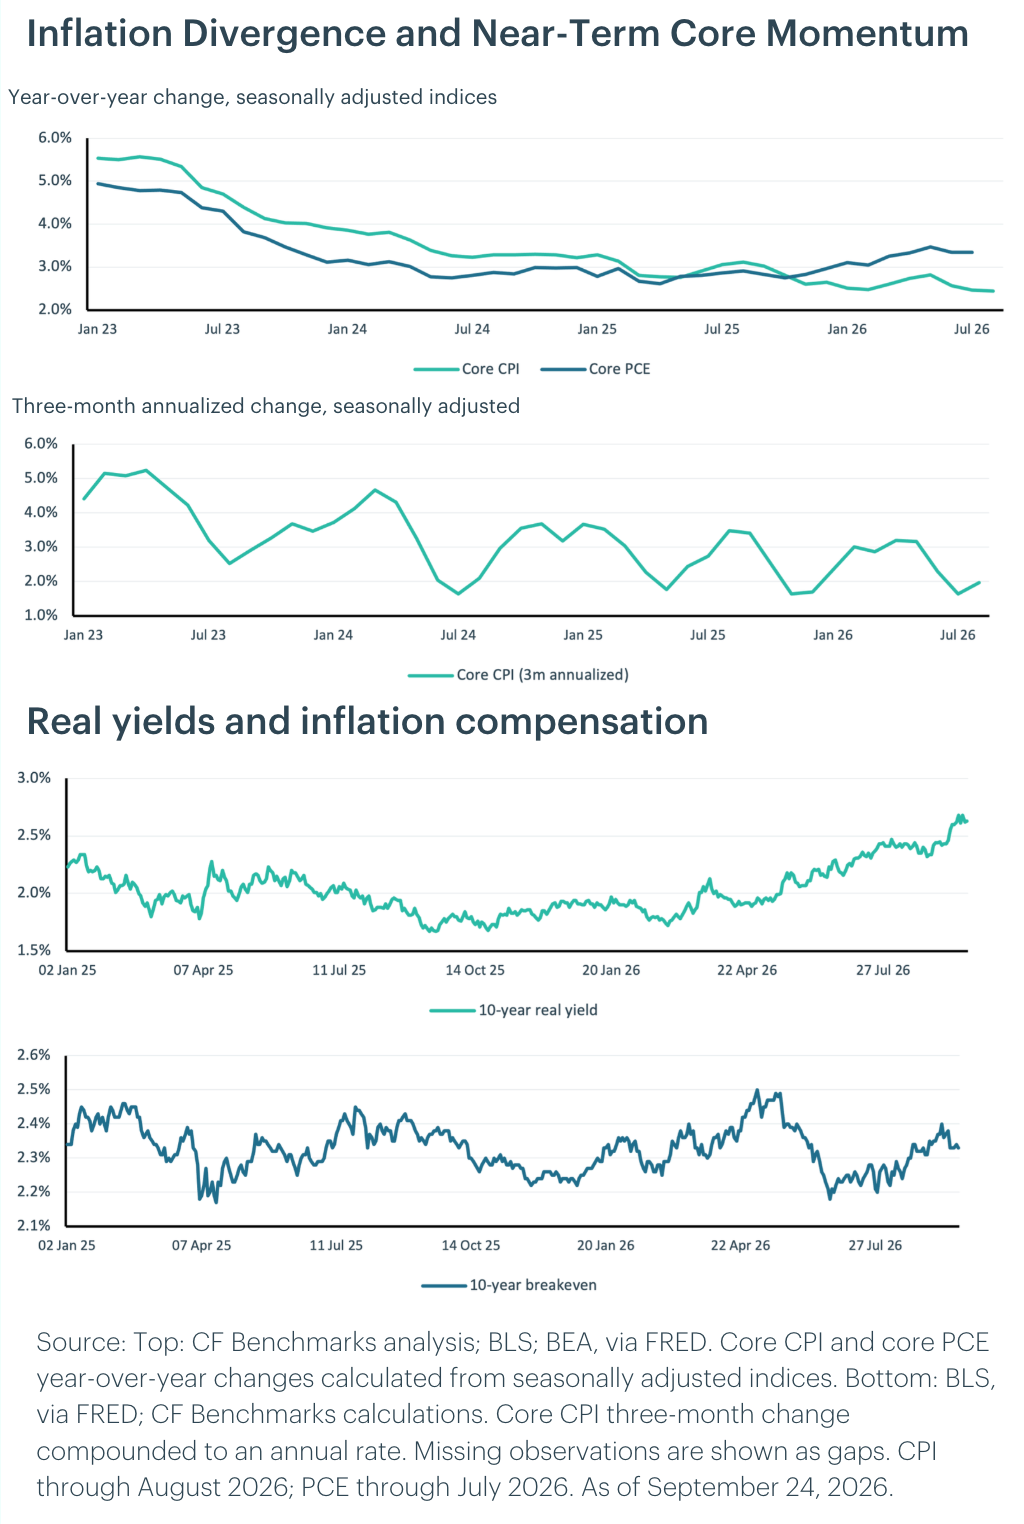
Inflation has moderated, but not broadly enough to deliver policy relief. August core CPI slowed to 2.4% year over year, and headline inflation eased to 3.4% from May's 4.2%. The monthly detail was less reassuring. Core prices rose 0.29%, and core services excluding shelter increased roughly 0.5%, partly on a 2.7% jump in airfares. Falling technology prices and fading tariff base effects helped the annual comparison but do not establish broad disinflation. Three-month annualized core CPI near 2% is encouraging, although volatile components can obscure persistent services pressure. Wage growth near 3.1% argues against a wage-price spiral, while resilient demand still allows some businesses to pass through costs. We expect gradual, uneven disinflation, with services persistence limiting the scope for monetary easing.
Measurement relief cannot remove the energy risk. July core PCE remained at 3.3%, materially above core CPI. That divergence matters because PCE is the Fed's preferred gauge and uses different weights and broader coverage. Upcoming BEA methodology changes could lower measured inflation, particularly through software and financial services. Bloomberg estimates roughly 0.2 pp of relief to annual core PCE, but a statistical revision is not an equivalent improvement in household purchasing power or a sudden weakening of demand. Energy remains the larger upside risk. Brent above $100 invalidated our earlier $70 to $74 assumption and raises the prospect of renewed pressure on transport, production and consumer prices. The key question is whether that pressure stays concentrated in energy or spreads into services and expectations. A cooler annual CPI reading alone would not resolve that risk.
Portfolio perspective: Slower inflation has not delivered easier financial conditions. Real yields remain elevated while longer-term inflation compensation is comparatively contained, which suggests markets still price restrictive policy rather than a sustained inflation breakout. That supports liquidity and selective exposure over a broad duration bet. Tokenized Treasury exposure offers income and flexibility, and gold provides diversification against energy and policy uncertainty. TIPS offer inflation protection but remain sensitive to rising real yields. Bitcoin's outlook depends on liquidity and financial conditions, so softer inflation alone is insufficient. We favor short-duration tokenized Treasuries for income, tokenized gold for diversification and measured Bitcoin exposure for long-term scarcity, mindful of its sensitivity to real yields.
Measuring the Fed: Renewed Tightening Delays the Path to Easing
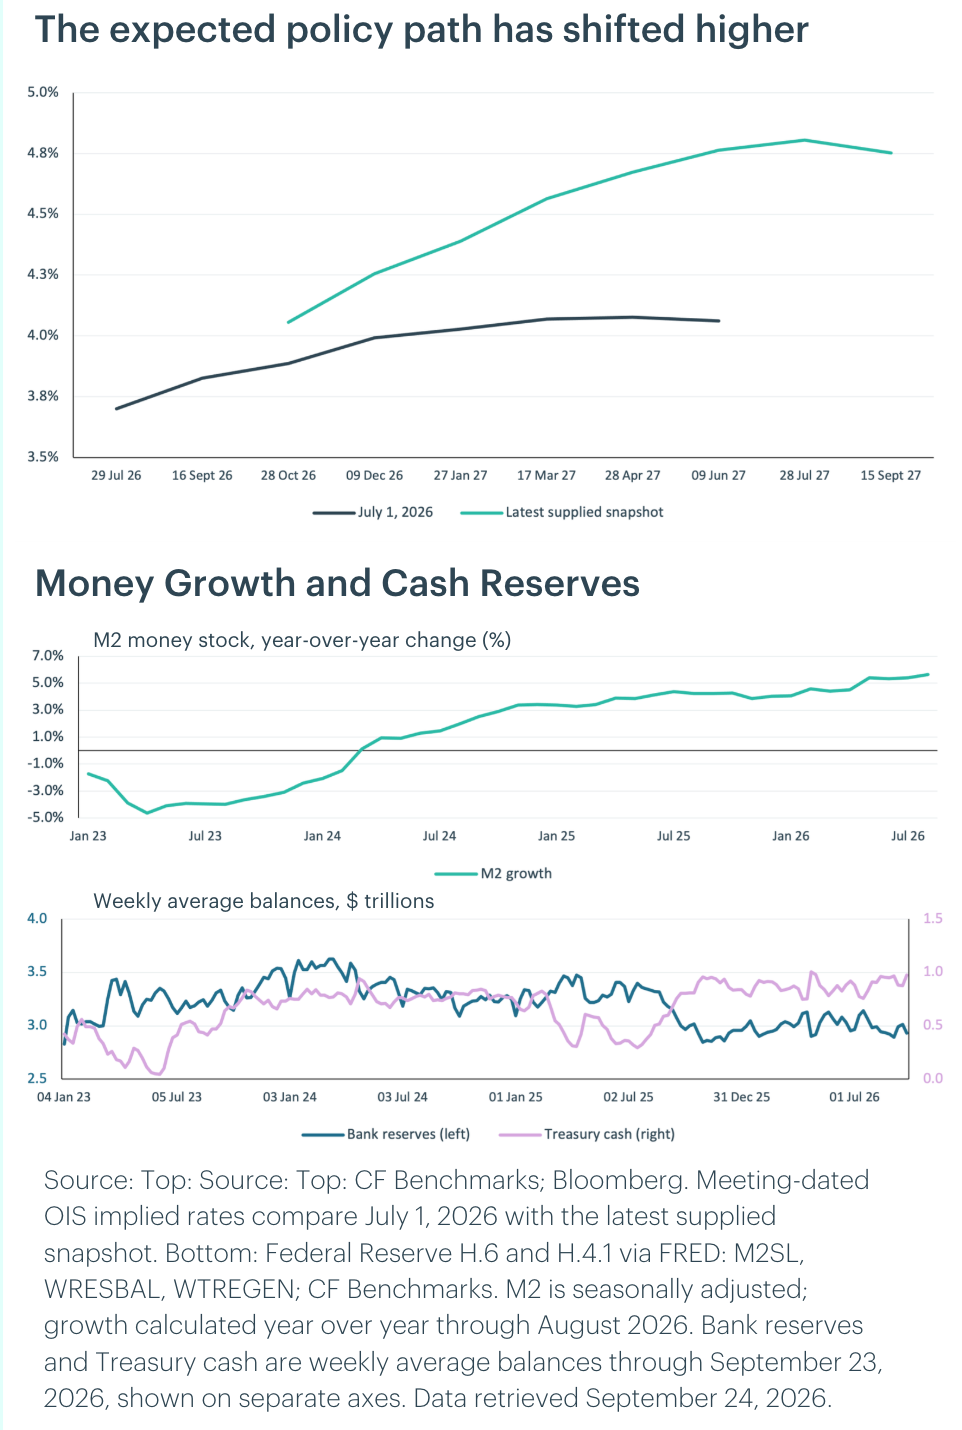
Our prior outlook expected a hold followed by easing. September's hike overturned that call as sticky services, elevated core PCE and renewed energy pressure outweighed softer annual CPI. The risk we identified became central as oil rebounded and policymakers grew less willing to look through the shock. Core CPI near 2.4% is encouraging, but core PCE around 3.3% gives the Fed less confidence that price stability is within reach. We expect policy to remain restrictive, with further tightening possible before a durable pause. That does not require a repeat of 2022. Slower wage growth and an uneven labor market suggest less domestic overheating, and higher rates cannot directly resolve energy shortages. Sustained cooling would support a pause, while broader price pressure would strengthen the case for additional hikes. Easing requires clearer evidence, not a calendar commitment. Private credit remains the transmission channel to watch, since small businesses hold a disproportionate share of employment and face the tightest credit access.
The Fed is restraining demand while public spending supports parts of the economy, which helps explain why activity has stayed resilient despite higher rates. Broad money growth has also strengthened. M2 rose 5.66% year over year in August, up from 5.34% in June. That supports the case for improving monetary conditions, although it does not show that funding is becoming easier across the economy. Treasury cash management adds another moving part, because rebuilding its cash balance generally drains bank reserves while drawing it down replenishes them. Ending quantitative tightening removes one source of withdrawal, but it is not QE. Stronger money growth and resilient asset prices suggest markets may be looking beyond current restraint toward continued fiscal support and pressure to contain financing costs. That is a potential catalyst, but additional borrowing can also lift yields.
Portfolio perspective: Resilient risk-asset performance challenges a stance that waits for rate cuts or lower real yields before adding exposure. Fiscal expansion alone does not guarantee lower yields or easier liquidity, and fiscal retrenchment, rising term premiums and funding stress remain risks. We favor measured Bitcoin exposure now, retaining tokenized Treasuries as capital for additions. We would increase conviction as sustained market strength is joined by policy measures that support liquidity or contain financing costs, and broaden selectively into digital assets with demonstrated adoption.
Measuring the Geopolitical Landscape: The Midterms Test the Durability of Policy
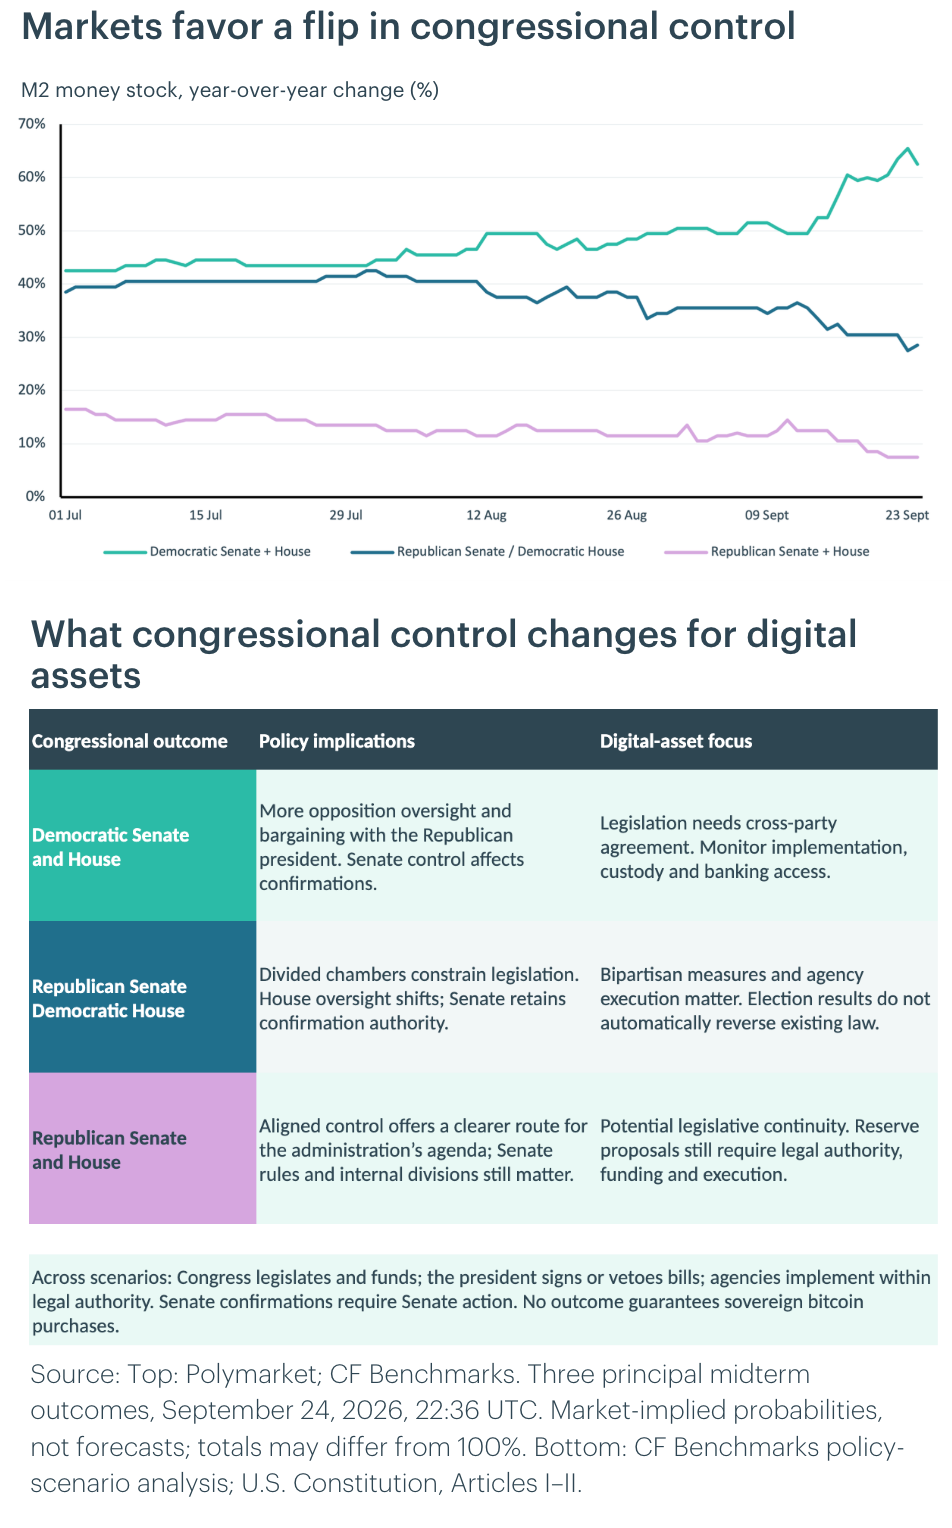
November's US midterms bring congressional control to the forefront of the digital asset outlook. Geopolitical fragmentation and sovereign interest in Bitcoin remain longer-term themes, but the immediate question is how the election changes fiscal policy and digital asset rules. As of September 24, Polymarket priced Democratic control of both chambers at roughly 63%, with a Republican Senate and Democratic House the next-largest scenario. These are market-implied probabilities, not our forecasts. A change in control would reshape oversight and legislative priorities when the new Congress takes office in January, without automatically reversing existing laws or executive policies. Divided government could complicate new spending initiatives and intensify budget negotiations, but it would not by itself imply fiscal retrenchment. Senate control also matters for confirmations. Investors must distinguish slower policymaking from a change in direction, because prices may react before the practical consequences become clear.
Implementation matters more than promises for digital assets. Market structure, stablecoin implementation, custody and banking access remain the key policy issues, and these do not map neatly onto a single partisan outcome. Bipartisan support, legal authority and agency execution can matter as much as congressional control. The same discipline applies to sovereign Bitcoin demand. Custody of seized coins differs from funded purchases, and reserve announcements do not guarantee buying. The midterms could alter funding prospects, but neither outcome automatically creates sovereign demand. International risks could override the domestic story. Gulf energy disruption could revive inflation and delay easing, while US and China restrictions could weigh on AI investment. Either could pressure digital assets near term, even as fragmentation supports the longer-term case for diversified stores of value.
Portfolio perspective: We would position around policy durability rather than a binary election trade. Bitcoin provides scarce, non-sovereign exposure but remains sensitive to liquidity and risk appetite. Tokenized Treasuries offer income and flexibility, and selective tokenized gold can diversify geopolitical risk. Across digital assets, we favor adoption supported by clear investor rights and workable regulation. We would maintain measured Bitcoin exposure and liquid Treasury RWAs, prioritize tokenization businesses with proven demand, and avoid sizing positions around election promises or unapproved sovereign purchases.
Measuring Protocol Fees: The Highest-Fee Tokens Outperformed by 61 pp
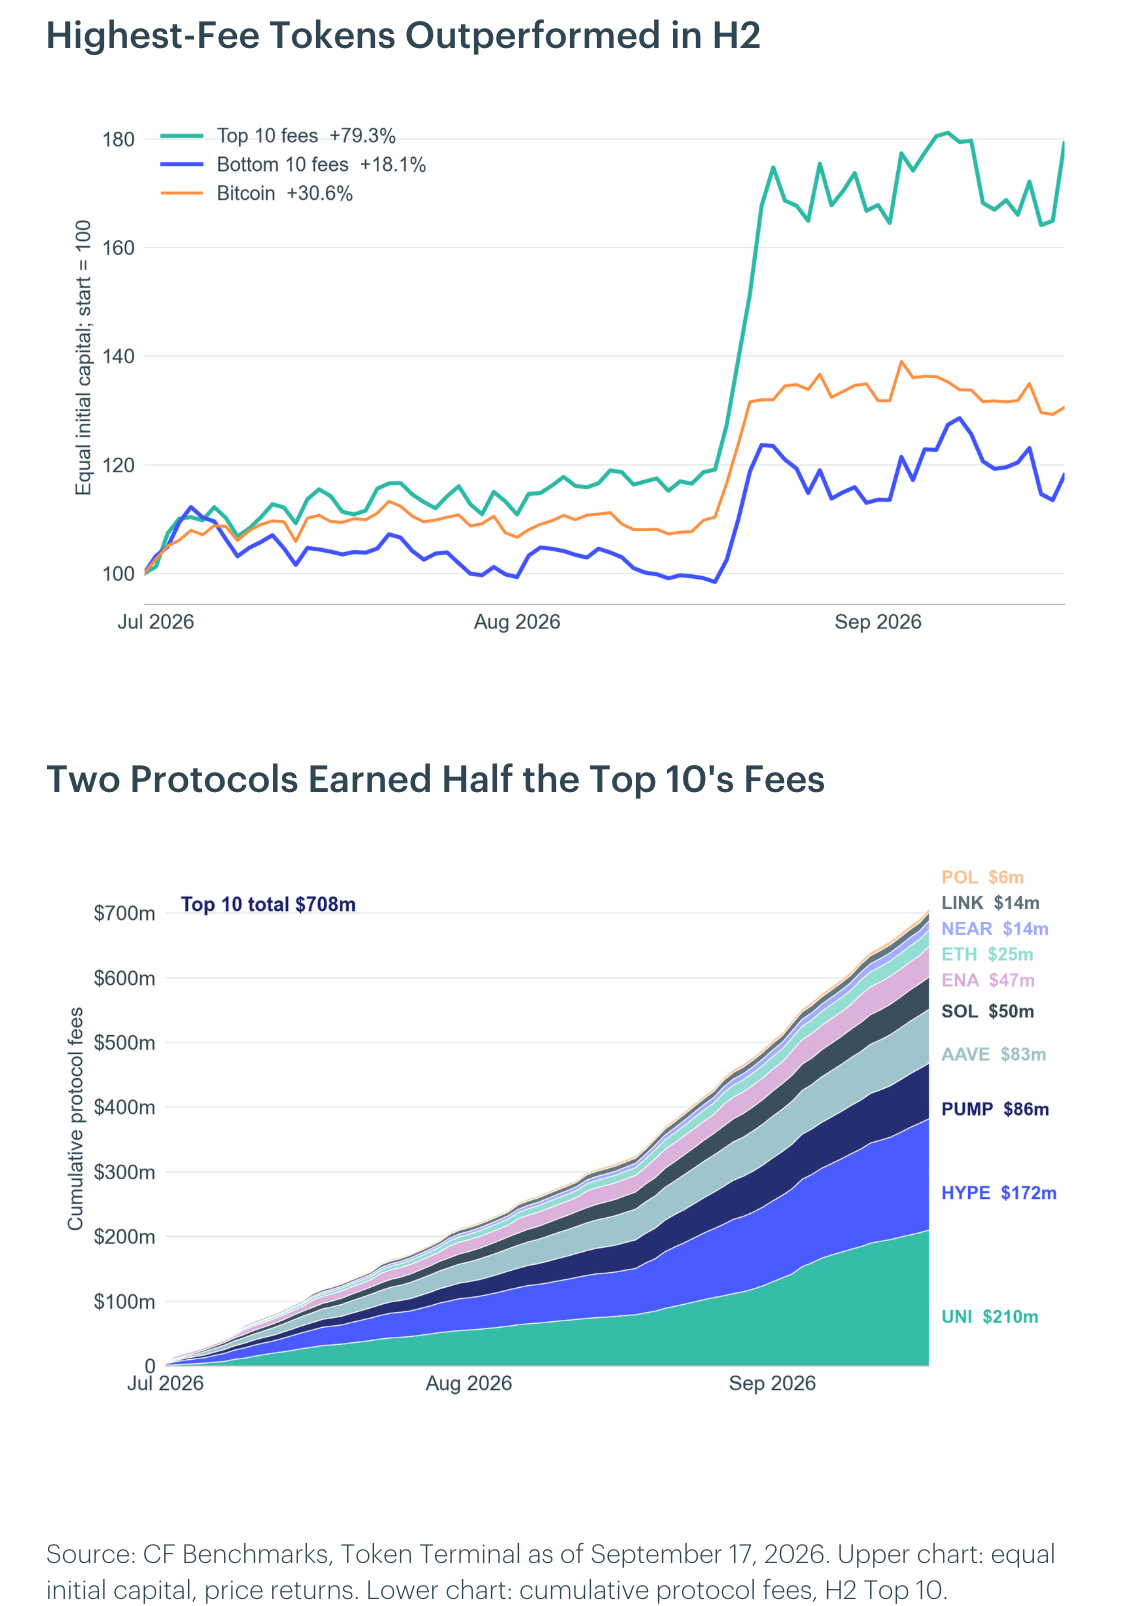
Our view is that protocol fee generation has become the clearest dividing line in altcoin performance, and that it should remain so over the next twelve months. Within the June 30 CF Benchmarks Growth factor universe, the ten protocols with the highest observed fees generated $708 million from July 1 to September 17, and an equal-weighted basket of their tokens returned 79.3%. The ten lowest generated $1 million and returned 18.1%. Bitcoin returned 30.6% over the same window. The median high-fee member led the median low-fee member by 37.6 pp, so the result is not carried by UNI and PUMP alone. Two protocols earned about half of the top ten's fees.
The ranking also held forward. Using only the July fees available by August 3, the high-fee ten returned 54.2% through September 17, against 14.1% for the low-fee ten and 19.8% for Bitcoin, with high-fee membership unchanged from the full-period ranking. That makes this the only theme in the outlook with a cross-sectional price test behind it. The mechanism is value capture. Hyperliquid, Uniswap and Aave have each activated buybacks or fee switches since late 2025, which gives the market a direct line from protocol usage to the token. Where that line exists, sustained activity appears to support valuations. Where it does not, activity alone has not been rewarded. The evidence has limits. The window is one short market phase, gross fees are not tokenholder revenue, and fee levels can proxy for protocol size, sector and trading activity. The principal risk is cyclicality, since fee income tracks trading volume and a volume downturn would compress the cohort's earnings first. The signal to watch is whether the spread persists after controlling for size and sector, and through the fourth quarter.
Portfolio perspective: The clearest beneficiaries sit in the Sectors category of CF DACS, where application tokens long traded as governance tokens with no claim on revenue. UNI, PUMP, AAVE and ENA, the four Sectors members of the high-fee ten, generated 60% of its fees and returned an average of 127%, against 47% for its six Settlement and Services members. We expect tokens in the Finance Sub-Category that pair fees with buybacks or fee switches to keep leading.
Measuring Tokenized Equities: From Issuance to a Functioning Secondary Market
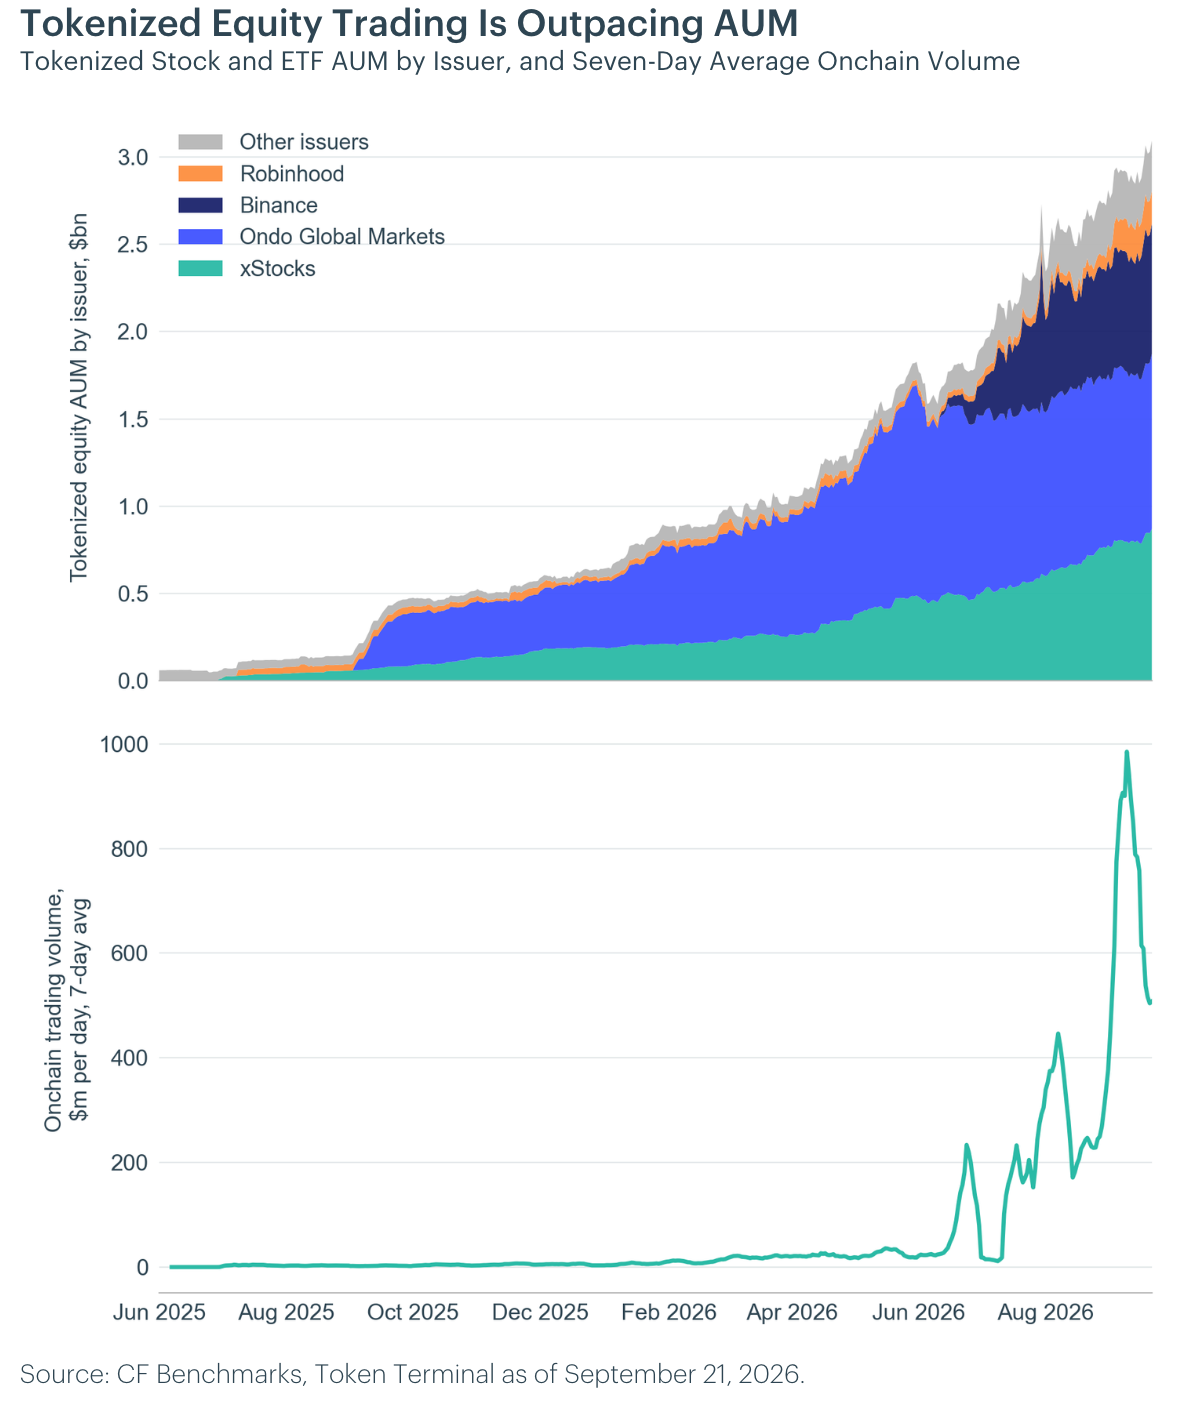
Our view is that tokenized equities are moving from an issuance story to a trading story, and that the fourth quarter widens the regulatory perimeter around them. Tokenized stock and ETF assets under management rose 64% in the second half, from $1.89 billion on June 30 to $3.09 billion on September 21, a figure rwa.xyz independently puts at $3.14 billion. Trading grew far faster. Average daily onchain volume in the third quarter to date is $359 million, 8.6 times the second-quarter average of $42 million. Median daily volume rose from $32 million in June to $137 million in July, $286 million in August and $635 million so far in September, so the increase is broad rather than a handful of spike days. Monthly turnover, volume relative to average AUM, rose from 0.5 in April to 5.3 in September. xStocks holder positions nearly tripled over the half, from 252,000 to 697,000, and issuance has broadened. Binance grew from $171 million to $745 million and Robinhood from $39 million to $187 million, while Ondo held near $1 billion.
The catalysts are dated. DTCC's Tokenization Service launches in October after live production trades on July 15. The SEC's September 17 innovation exemption allows tokenized-securities venues to list up to 75 large-cap symbols, with listings possible from mid-October once the 30-day issuer notice lapses. Nasdaq's tokenized-trading rule, approved in March, adds a listed-exchange venue. The principal risk is concentration. The five most-traded products accounted for 43% of September volume, led by Binance's QQQ token at $2.8 billion. The signal to watch is rising median volume across more products, not a few very large tokens.
Portfolio perspective: Adoption is running ahead of price, and DEX tokens are the most direct exposure. Onchain stock-token trading, now 8.6 times its second-quarter pace, settles on decentralized exchanges, and the SEC exemption spares AMM liquidity providers from dealer status. UNI, whose fee switch links that volume to the token, returned 173% in the second half.
Measuring Market Structure: Non-Crypto Markets Hold a Fifth of Onchain Perpetuals Volume
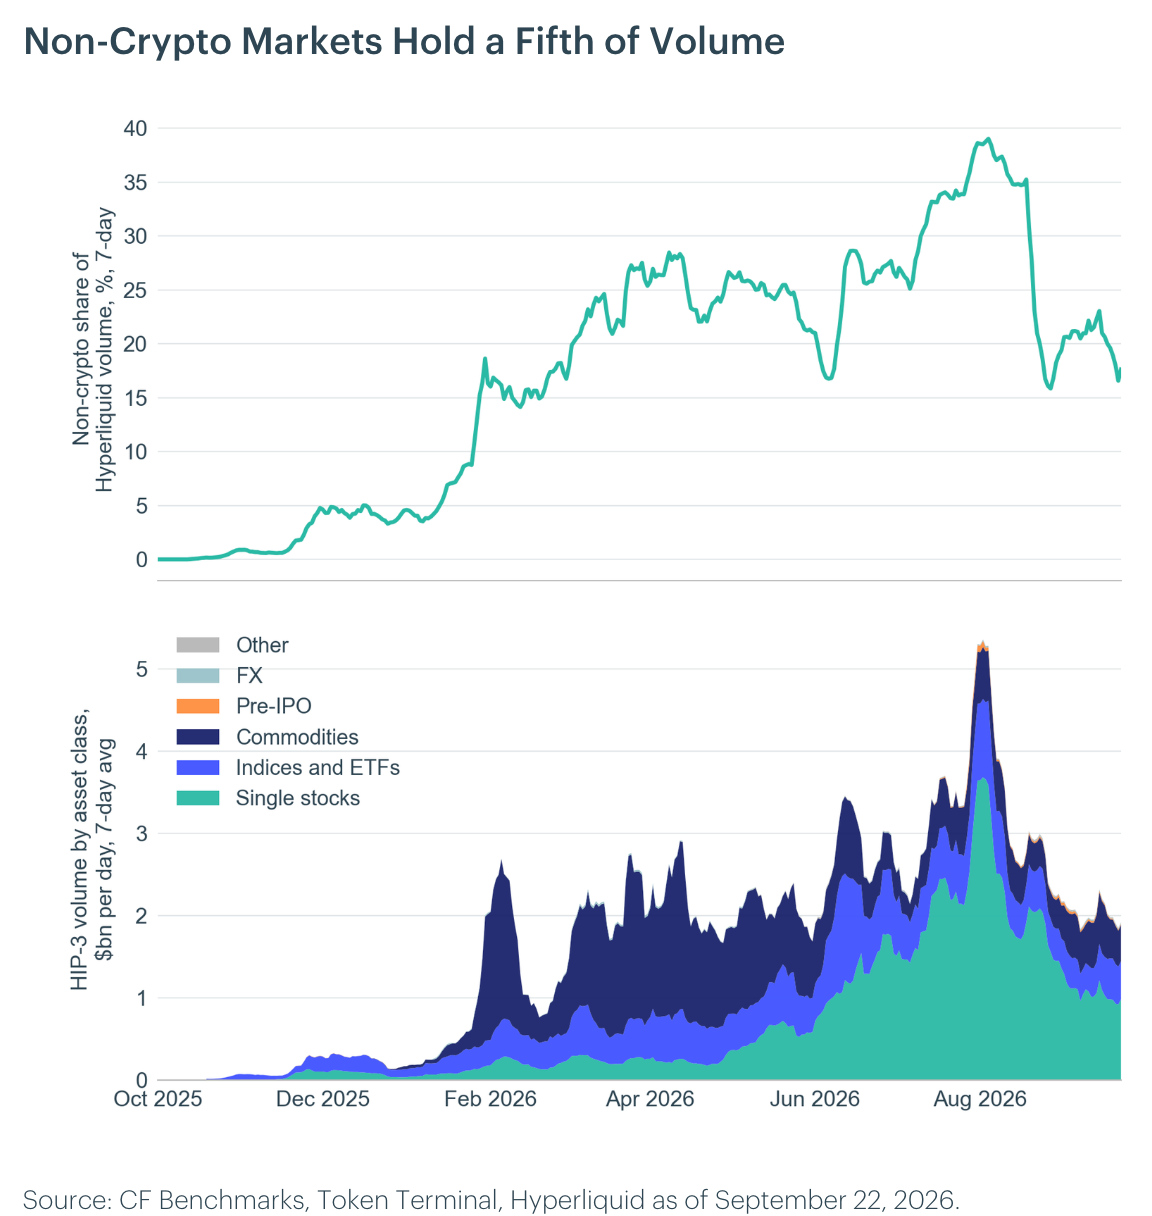
We see crypto-native venues becoming 24/7 multi-asset venues, and the durable measure of that shift is the level of non-crypto trading rather than a steadily rising share. On Hyperliquid, non-crypto markets launched under HIP-3, its permissionless market framework, went from zero in October 2025 to 24% of perpetual futures volume by March, with a peak of 34% in July. Average daily HIP-3 volume reached $2.92 billion in the third quarter to date, 25% above the second quarter, against 8% growth for Hyperliquid's crypto markets. Beyond Hyperliquid, Binance reported $433 billion of traditional-asset perpetuals volume in August, 15 times January.
The mix is shifting toward single stocks, whose share of HIP-3 volume rose from 30% in the second quarter to 64% in the third, while commodities fell from 42% to 17% as the oil trade faded. The most-traded third-quarter markets were SK Hynix, the XYZ100 (Nasdaq 100) index, SanDisk, the S&P 500 and WTI crude. Memory-chip and Korea-listed names lead, which points to round-the-clock access to non-US stocks as a driver alongside weekend trading. The share has not risen in a straight line. It fell to 26% in August and 20% in September as crypto trading recovered, so we frame the test as non-crypto markets holding 20% or more of volume through crypto rallies.
The next catalyst is US access. On September 18, Payward, the parent company of Kraken and CF Benchmarks, filed with the CFTC and SEC to list single-stock perpetual futures for eligible US Kraken clients through Bitnomial, its CFTC-regulated exchange and clearinghouse. The first contracts cover 10 US stocks, including NVDA, TSLA, MU and AAPL, with no expiry date and a target of 24/5 trading. Two days earlier, Payward set out plans to become the first registered US exchange and clearinghouse to deploy a permissioned HIP-3 market on Hyperliquid. Bitnomial would create, administer and clear the market, NinjaTrader Clearing would carry client accounts, and only allowlisted accounts could trade, with orders matched on Hyperliquid's public order book. Ten venues run builder-deployed markets on Hyperliquid today, and none is a registered US exchange. Subject to CFTC approval, US clients would gain regulated access to Hyperliquid's markets for the first time. The signal to watch is the HIP-3 share through the next crypto volatility spike, along with the CFTC's review of the filings.
Portfolio perspective: We see CF DACS Services tokens as the clearest beneficiaries, because they carry the oracles and infrastructure that multi-asset trading runs on. Services constituents returned 39% in the second half, ahead of Bitcoin's 31%, and each new market adds demand for price feeds.
Measuring Stablecoin Adoption: Cheaper Block Space Buys More Activity Per User
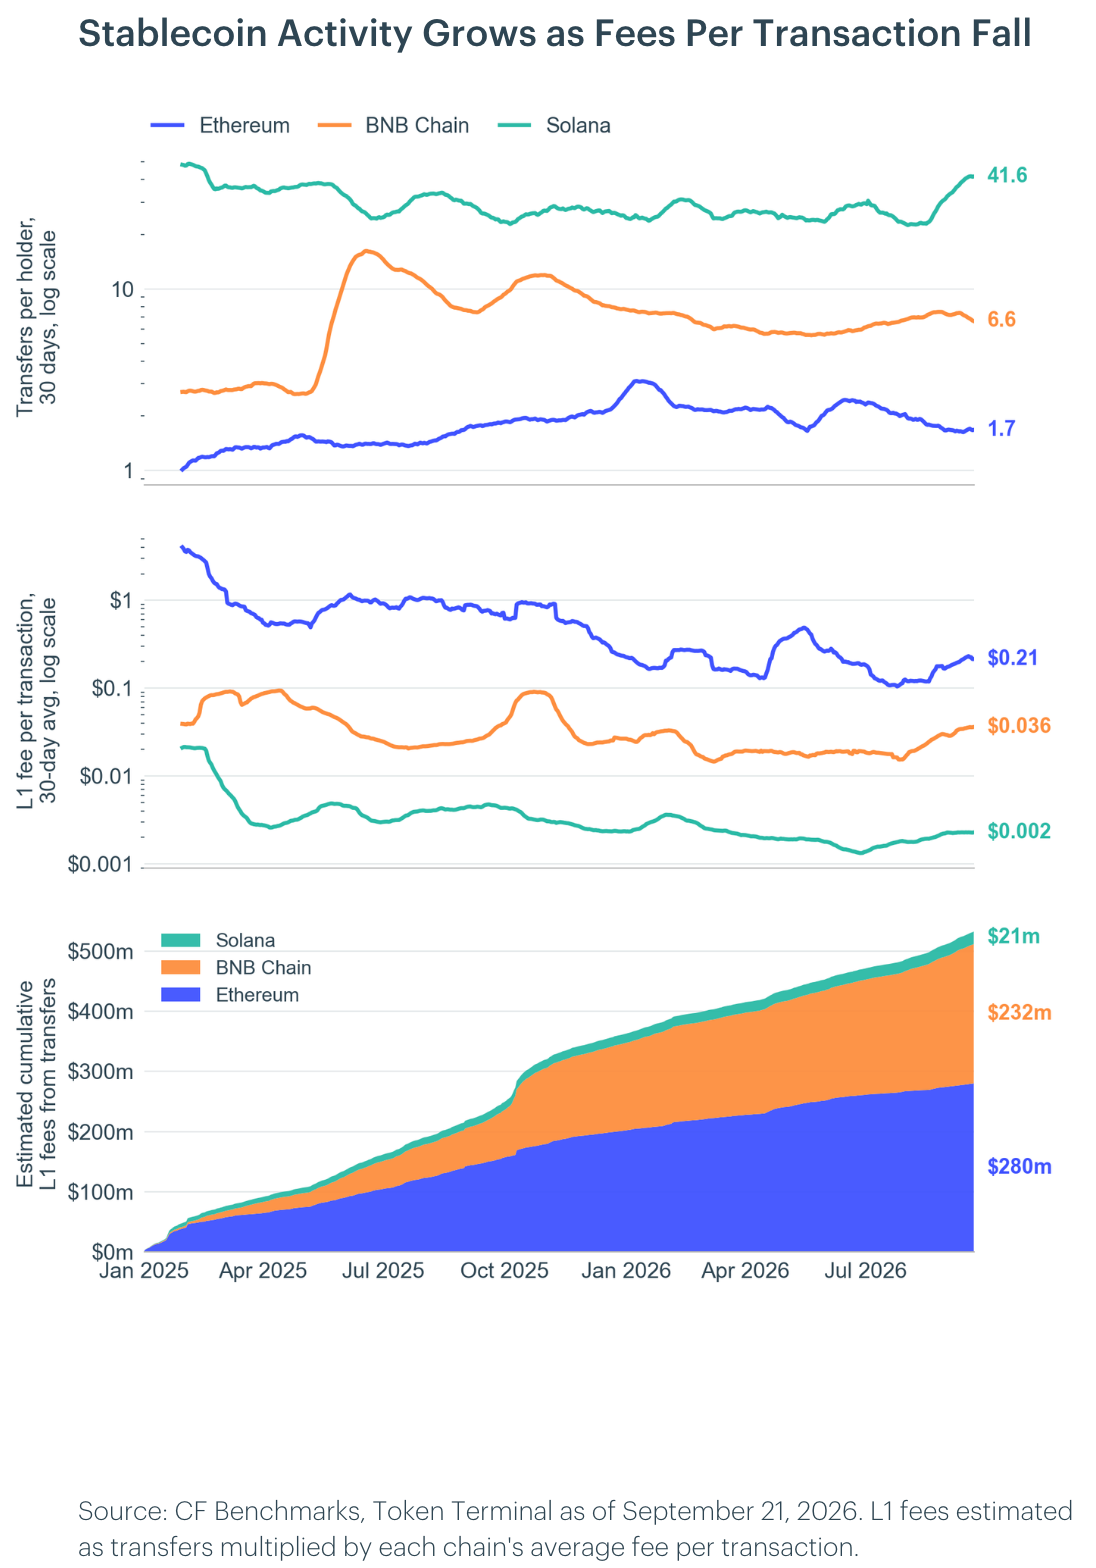
Our view is that falling layer 1 transaction costs will lift activity per stablecoin user again, raising demand for block space and fee burn on Ethereum as more users pay a smaller fee more often. Ethereum's average fee per transaction fell from $1.98 in the first quarter of 2025 to $0.16 in the third quarter to date. Monthly USDT and USDC transfers per holder rose from 1.2 to 1.9 by January 2026, but have since eased to 1.7. On Solana, where fees halved over the past year, transfers per holder rose 71%.
The call depends on activity outrunning price, and the price side is now easing. Ethereum's fee per transaction fell 77% in the two quarters to the first quarter of 2026, but only 19% in the two quarters since. Over the past twelve months transfers rose about 80% while fees per transaction fell 70%, so estimated fees paid by those transfers fell 46%, to $129 million. We expect that balance to turn. With each further cut now smaller, cheaper block space should unlock smaller and more frequent payment flows that were uneconomic at $2 a transfer, and more of that volume should show up as fee revenue rather than be offset by lower prices. All of the growth in transfers so far has come from holders, which doubled, while transfers per holder slipped about 10%.
Our scenario sets out what has to be true. If transfers per holder double on Ethereum, holders grow at half their pace of the past year (50%, against 100%) and fees fall a further 25%, transfers rise to three times their current level and Ethereum's stablecoin fee revenue reaches an estimated $290 million over the next twelve months, 125% above the last twelve. Revenue stays above last year's level unless fees fall more than 67%.
The principal risk is that activity migrates rather than deepens. Transfers that move to layer 2 networks or low-fee chains add users without adding much layer 1 fee revenue. The signal to watch is Ethereum's transfers per holder, now 1.7 a month, against its fee per transaction.
Portfolio perspective: Stablecoin growth accrues to the chains through fees, not to issuers through volume. Tether and Circle earned $13.2 billion since January 2025, almost all from reserve income, against about $0.5 billion for Ethereum, BNB Chain and Solana combined for carrying the transfers. On Ethereum, where the base fee is burned, more transfer activity lowers ETH's net issuance.
Measuring The Crowd: Consensus Forecasts
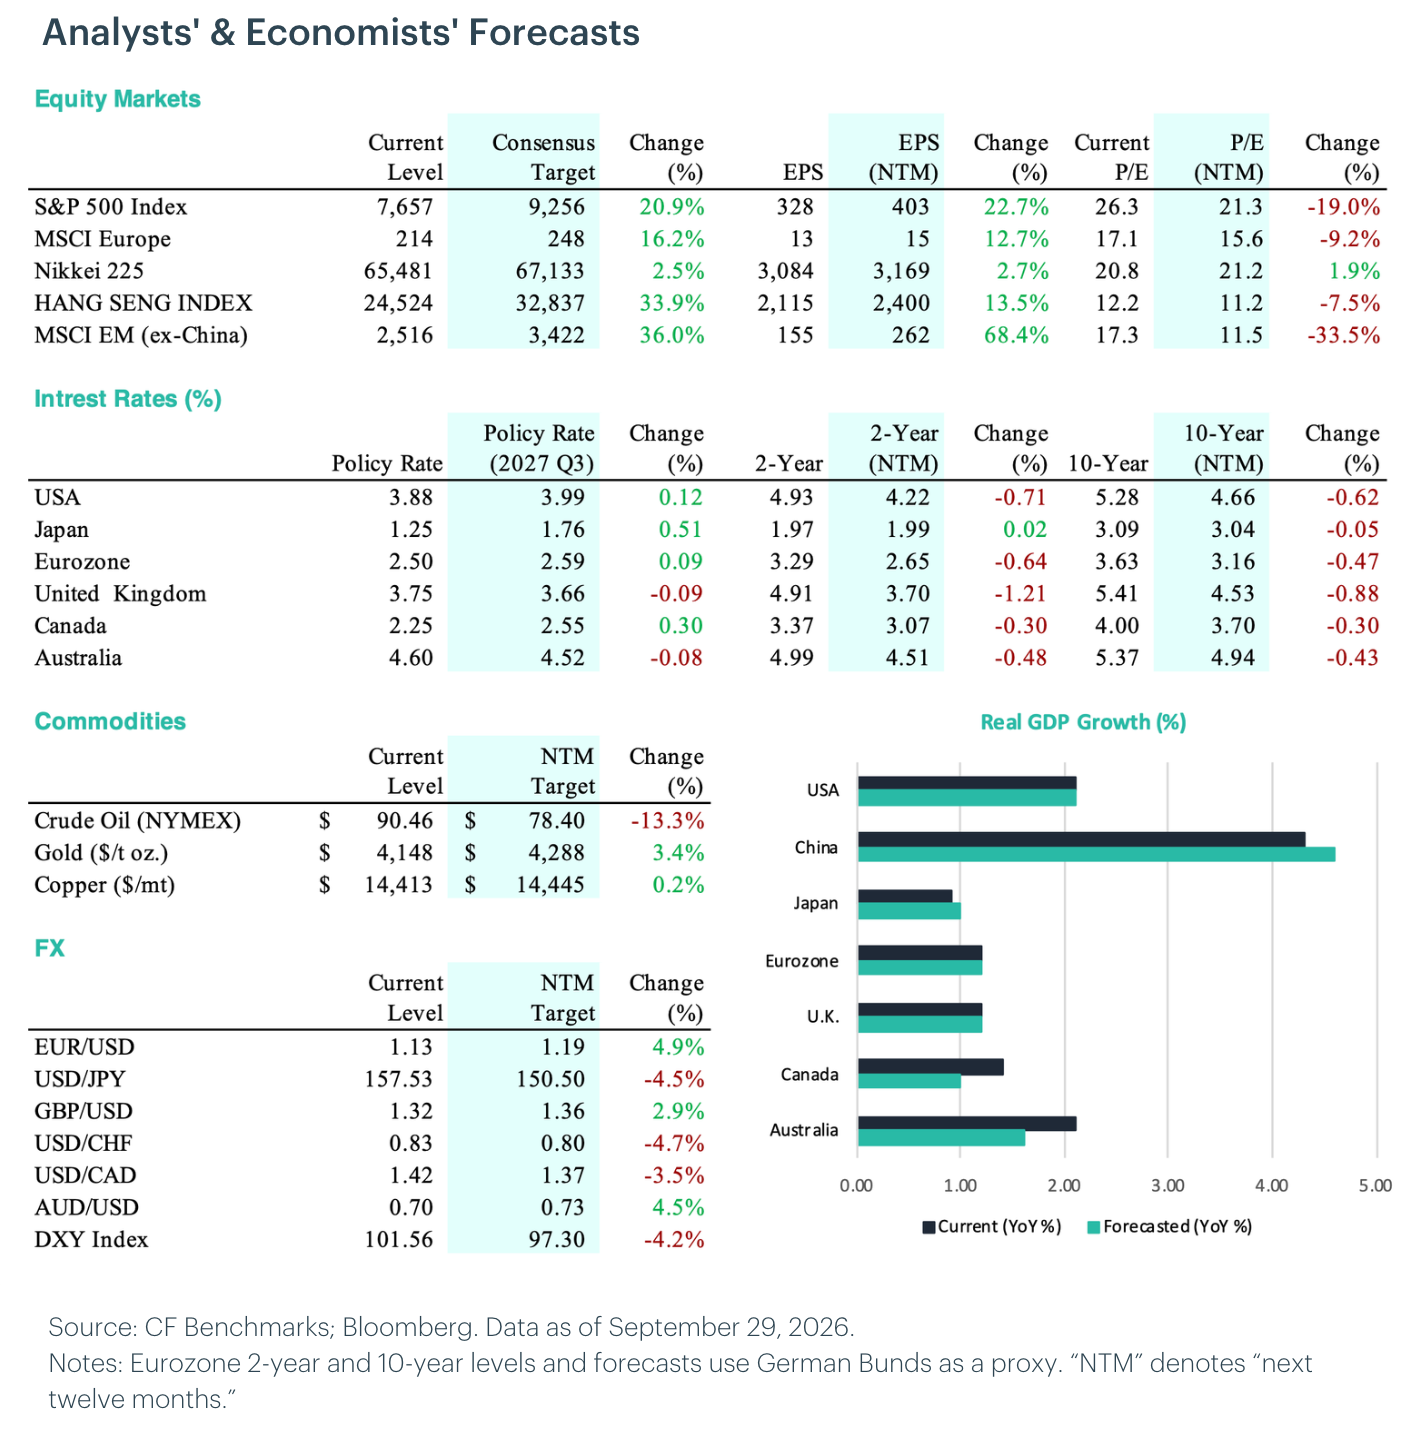
Equities: Analysts maintain a broadly positive outlook, with emerging markets ex-China (+36.0%) and the Hang Seng Index (+33.9%) leading forecasts. US equities are forecast to rise 20.9%, with S&P 500 earnings per share projected to grow 22.7%. Europe is expected to gain 16.2% and the Nikkei 225 a more modest 2.5%. Valuation multiples are expected to contract in every market except Japan, so price gains rely on earnings growth rather than multiple expansion.
Interest rates: Policy rate forecasts diverge. The US is expected at 3.99% by the third quarter of 2027 (currently 3.88%) and Japan at 1.76% (from 1.25%), while the UK is forecast to ease to 3.66% (from 3.75%) and Australia to 4.52% (from 4.60%). Yield forecasts point to a sizeable retracement. The US 2-year yield is expected to fall 71 basis points to 4.22% and the 10-year 62 basis points to 4.66%. The UK sees the largest declines (2-year down 121 basis points, 10-year down 88), which suggests consensus expects long rates to ease.
Commodities: Gold is forecast to rise 3.4% to $4,288, reflecting steady demand for real assets amid macro uncertainty. Crude oil is expected to fall 13.3% to $78.40, which implies the current energy premium fades. Copper is projected to rise 0.2%, pointing to stable industrial demand.
FX: The US dollar is expected to weaken, with the DXY Index down 4.2%. The euro (+4.9%), Australian dollar (+4.5%) and pound (+2.9%) are forecast to gain, while USD/JPY is expected to fall 4.5% and USD/CHF 4.7%, implying yen and franc appreciation. USD/CAD is forecast to decline 3.5%.
GDP growth: Forecasts show continued regional divergence. China is expected to lead, rising to about 4.6% from 4.3%, while the US holds near 2.1%. The Eurozone and UK are forecast to stay near 1.2%. Canada is forecast to slow from about 1.4% to 1.0% and Australia from about 2.1% to 1.6%.
Measuring Return Assumptions: 2026 Bitcoin Capital Market Assumptions
Capital market assumptions give institutional investors forward-looking projections of expected returns, volatility and correlations to guide strategic asset allocation. As Bitcoin matures into an institutional asset class, rigorous assumptions become essential for allocators evaluating its role in diversified portfolios.
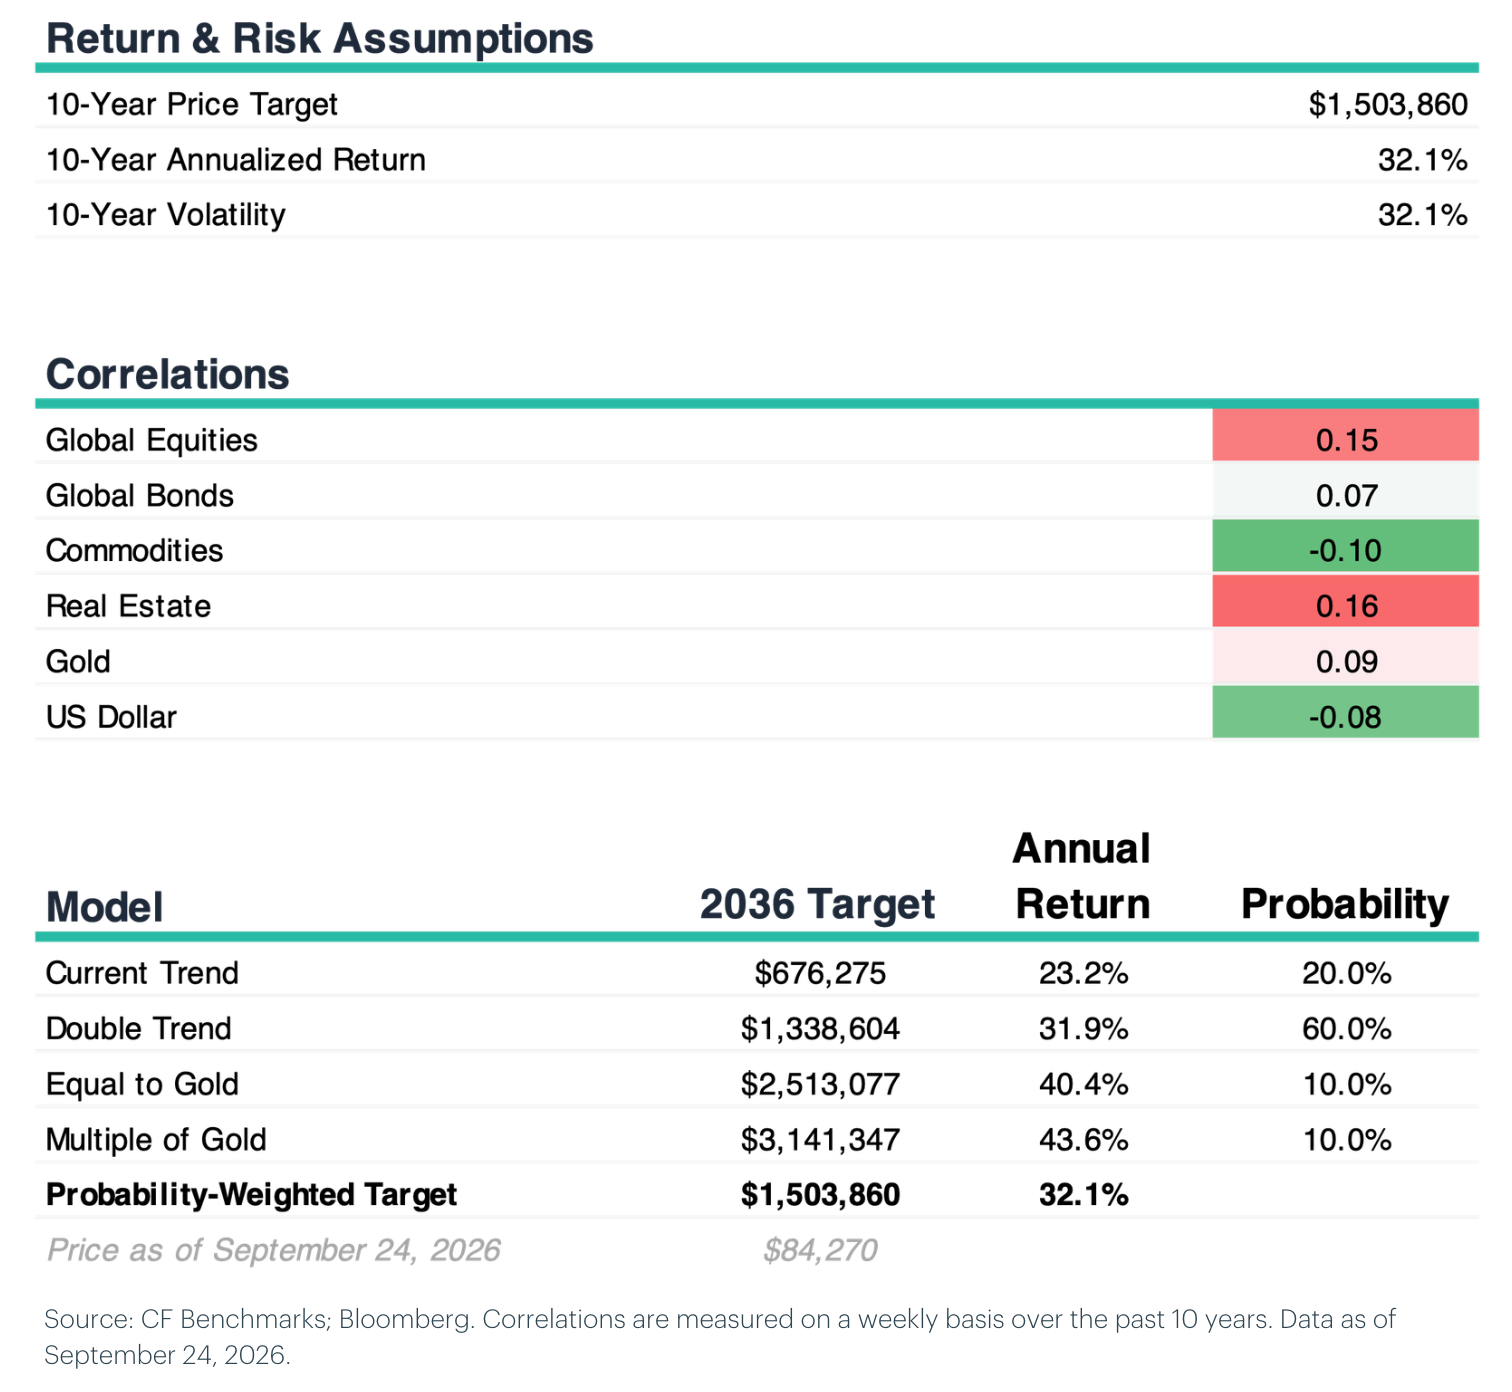
Returns: Our 2026 capital market assumptions project a 10-year annualized return of 32.1% and a probability-weighted 2036 price target of $1,503,860. The target weights scenarios in the store-of-value market at 60% for double-trend growth, 20% for current trend continuation, and 10% each for gold parity and gold outperformance.
Volatility: We project long-run volatility with a two-stage decay model that extends the historical compression trend while assuming diminishing marginal declines. The model applies half the historical pace over the next five years (approximately 3.5% a year) from the current 360-day level of 41.8%, reaching 35.0% by 2031. It then halves the decay rate (approximately 1.75% a year) to roughly 32.1% by 2036.
Correlations: We project Bitcoin's correlations to stay low across asset classes, at 0.15 to global equities, 0.07 to global bonds, -0.10 to commodities, 0.16 to real estate, 0.09 to gold and -0.08 to the US dollar.
To read our full market outlook report, please click here.
The information contained within is for educational and informational purposes ONLY. It is not intended nor should it be considered an invitation or inducement to buy or sell any of the underlying instruments cited including but not limited to cryptoassets, financial instruments or any instruments that reference any index provided by CF Benchmarks Ltd. This communication is not intended to persuade or incite you to buy or sell security or securities noted within. Any commentary provided is the opinion of the author and should not be considered a personalised recommendation. Please contact your financial adviser or professional before making an investment decision.
Note: Some of the underlying instruments cited within this material may be restricted to certain customer categories in certain jurisdictions.
Altcoins Lag as Bitcoin Tests The 50-Day Moving Average
Digital assets fell broadly over the past week as Bitcoin slipped to a moving average, with inflation prints and an equity sell-off in the background. Losses grew with distance from Bitcoin, hitting diversified and smaller-cap exposure hardest, while implied volatility rose.

Mark Pilipczuk
Factor Friday - October 16, 2026
Size led the factor table for a third week at 0.59% as the Market rebounded 0.40% and 15 of 35 Broad Cap tokens closed higher. Momentum fell 1.58% in a rebound led by laggards, and Size's weekly print has narrowed from 8.86% to 0.59% in three weeks, even as its year-to-date lead holds at 22.81%.
Mark Pilipczuk
Launch of the CF HODLife HARD Index
The Administrator announces the launch of the CF HODLife HARD Index, a co-branded benchmark developed by CF Benchmarks and HODLife, an insurance technology company.
Mark Pilipczuk
By clicking Accept, you consent to CF Benchmarks's use of cookies.
Visit Cookie Settings to learn how CF Benchmarks uses cookies and to adjust your preferences.