
Oct 02, 2026
Crypto Rallies After The CLARITY Act Stalls
Key takeaways for the month
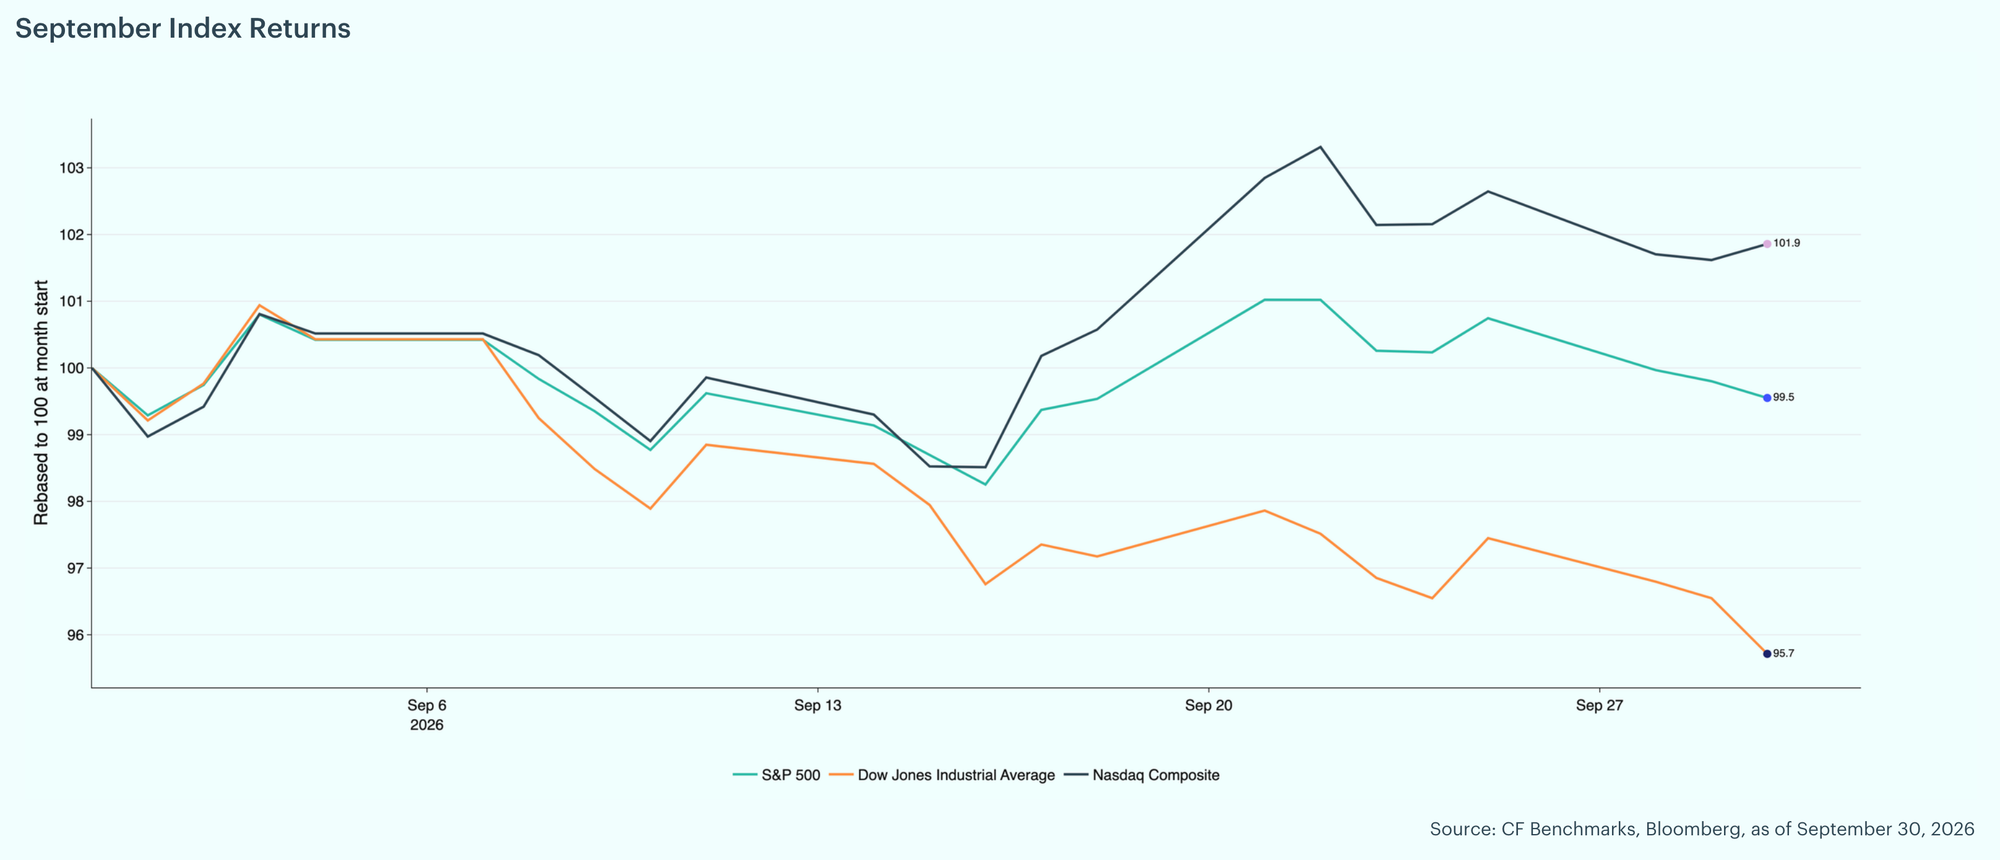
We read September's rally as a move that ran against the macro backdrop and was carried by asset-specific catalysts. The Federal Reserve raised its policy rate by 25 basis points to 3.75% to 4.00% on September 16, its first hike since July 2023, in a unanimous 12 to 0 vote, with Chair Warsh saying inflation had been too high for too long. The data gave mixed support, with August payrolls rising 162,000 against a 53,000 consensus while core CPI eased to 2.4% year over year, its lowest since March 2021. The 10-year Treasury yield climbed above 5.25% even after the Treasury tripled its long-dated buyback to $6 billion on September 10, and the CLARITY Act failed a Senate cloture vote 49 to 50 on September 15. Renewed U.S.-Iran strikes lifted Brent to $107 on September 28. Equities were mixed, with the S&P 500 down 0.5% and the Nasdaq Composite up 1.9%. Digital assets rallied regardless, and all eight CF Benchmarks indices rose. Participation was broad, with the share of Broad Cap constituents above their 200-day moving average reaching a series high of 91.4%, but leadership came from smaller names on specific catalysts, and the size factor's one-year z-score reached its highest reading since the series began. The bid from funds slowed, with inflows of $3.8 billion down 35.3% from August, and sentiment cooled as price extended.
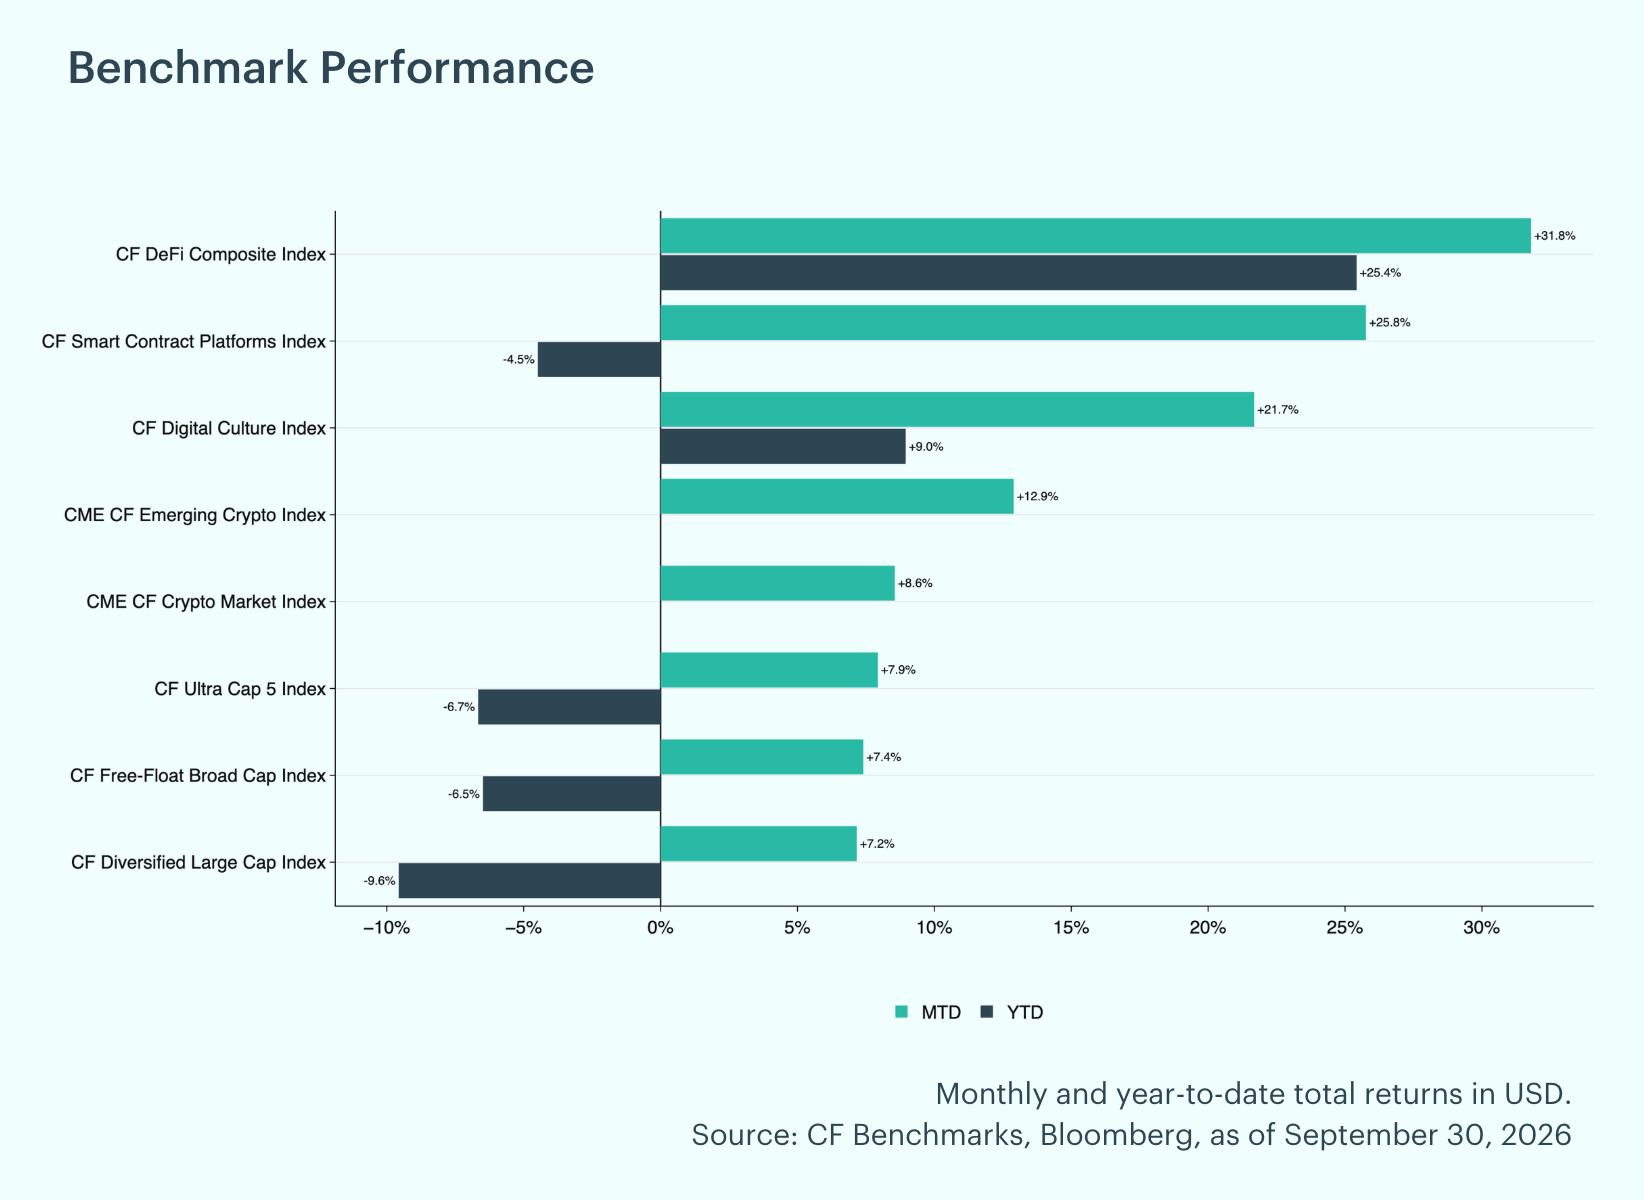
All Eight Indices Rise, With DeFi Far Ahead of the Large Caps: Last month's price action delivered gains across all eight CF Benchmarks indices, though dispersion was wide. The CF DeFi Composite Index led, up 31.8% month-to-date (MTD), followed by the CF Web 3.0 Smart Contract Platforms Index at 25.8% and the CF Digital Culture Index at 21.7%. The CME CF Emerging Crypto Index added 12.9% and the CME CF Crypto Market Index 8.6%, while the broader benchmarks trailed. The CF Cryptocurrency Ultra Cap 5 Index rose 7.9%, the CF Free-Float Broad Cap Index 7.4% and the CF Diversified Large Cap Index 7.2%, a 24.6 percentage point (pp) gap to the leader. On a year-to-date (YTD) basis, the CF DeFi Composite Index (up 25.4%) and the CF Digital Culture Index (up 9.0%) turned positive. The other four remained negative, ranging from a 4.5% loss for the CF Web 3.0 Smart Contract Platforms Index to a 9.6% loss for the CF Diversified Large Cap Index. The two CME CF indices lack a full year of history for a YTD figure.
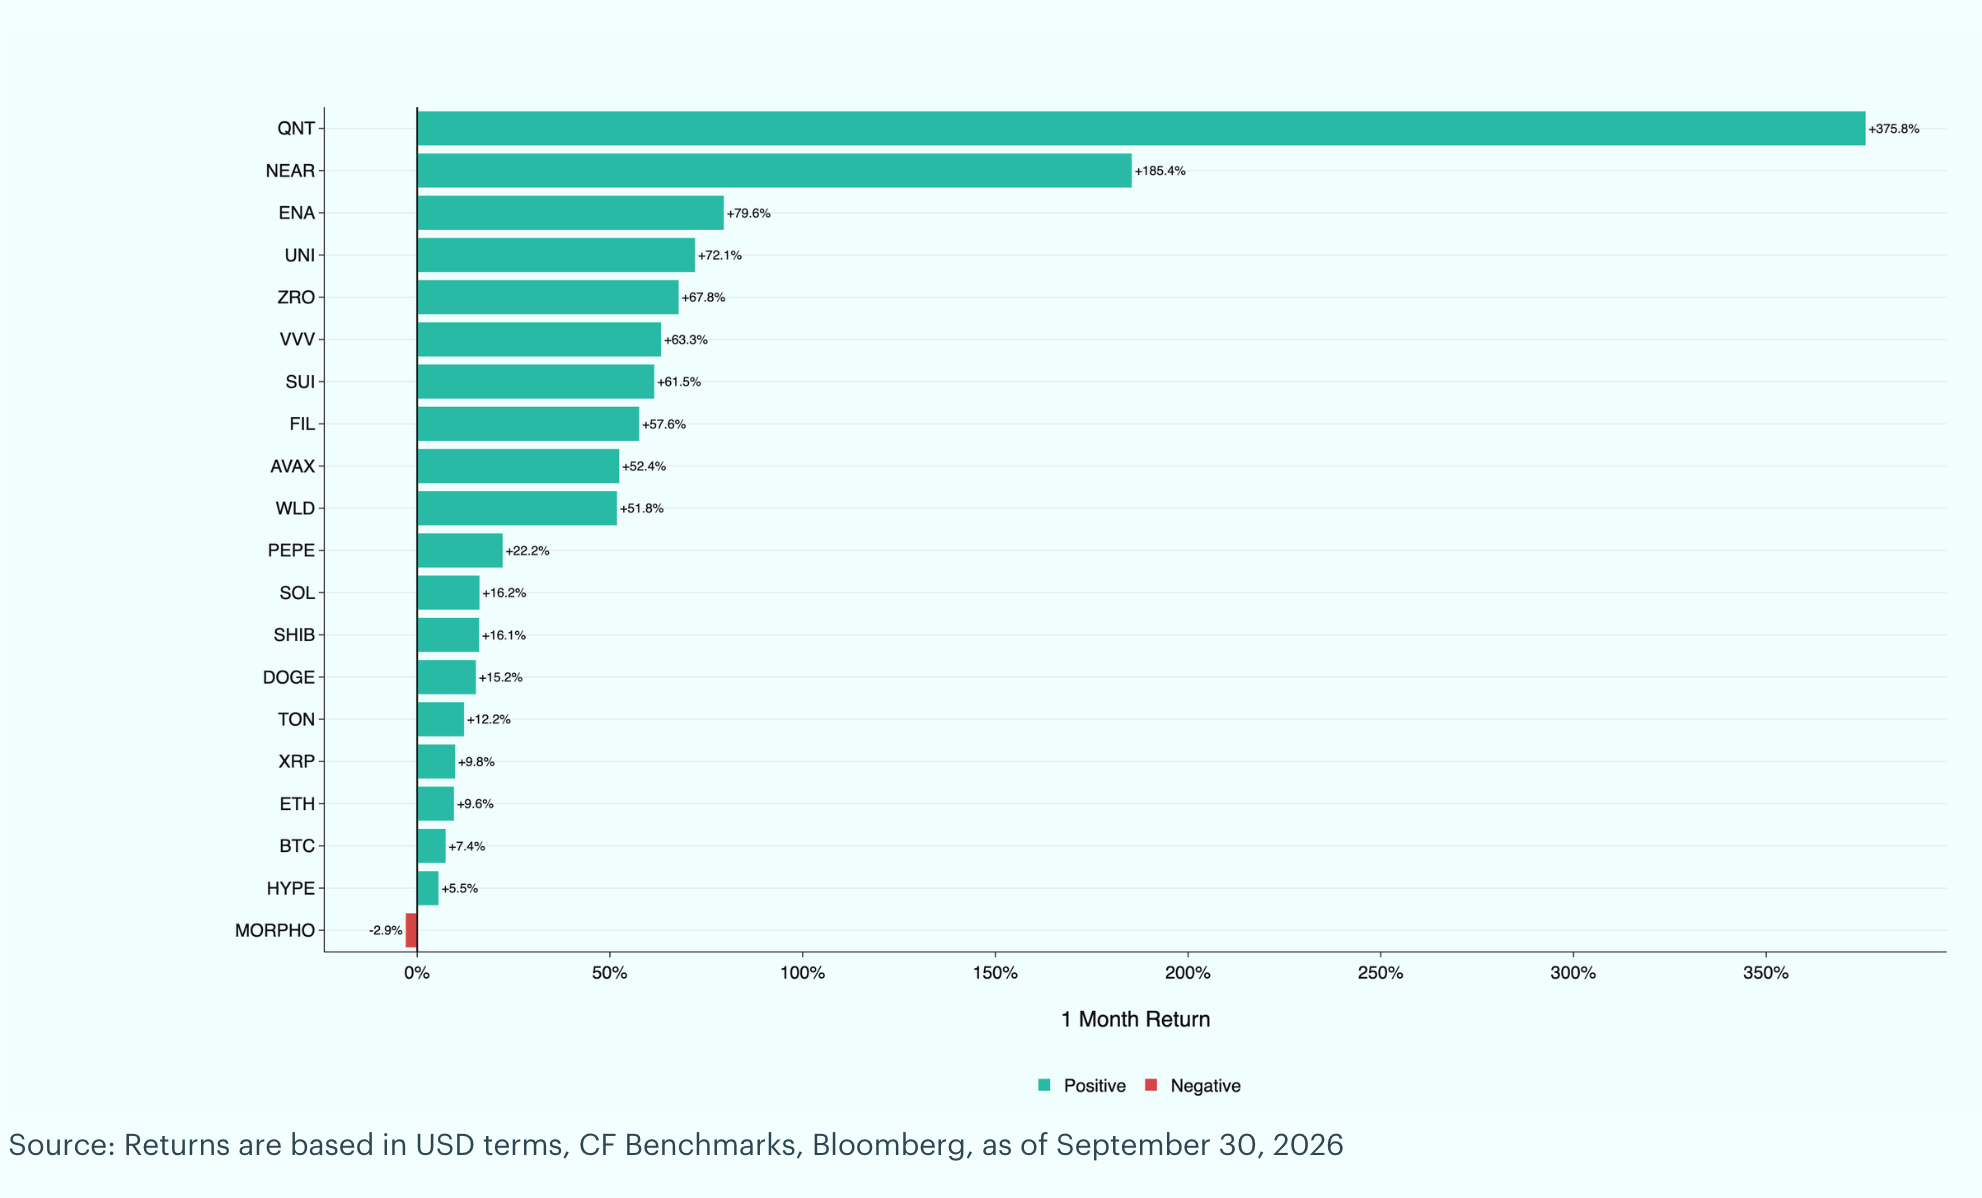
Quant, NEAR & Ethena Lead While Morpho Alone Declines: Quant (QNT) led the major crypto pairs in September, rising 375.8% month over month (MoM), the largest gain in the group, with the advance accelerating after The Clearing House selected Quant on September 24 as the interoperability layer for its tokenized-deposit initiative. NEAR Protocol (NEAR) rose 185.4% after the September 17 launch of confidential perpetuals and NYSE Arca's approval of the Bitwise staked NEAR ETF listing late in the month. Ethena (ENA) gained 79.6% following a September 25 partnership with Binance to back USDe with tokenized stocks. Ten of the 20 major pairs rose more than 50%. Morpho (MORPHO) was the only Broad Cap constituent to decline, down 2.9% MoM, after giving back a mid-month gain. Hyperliquid (HYPE) rose 5.5%, fading into month-end after a $95.97 all-time high on September 21. Bitcoin (BTC) gained 7.4%, trailing Ethereum (ETH) at 9.6% and Solana (SOL) at 16.2%.
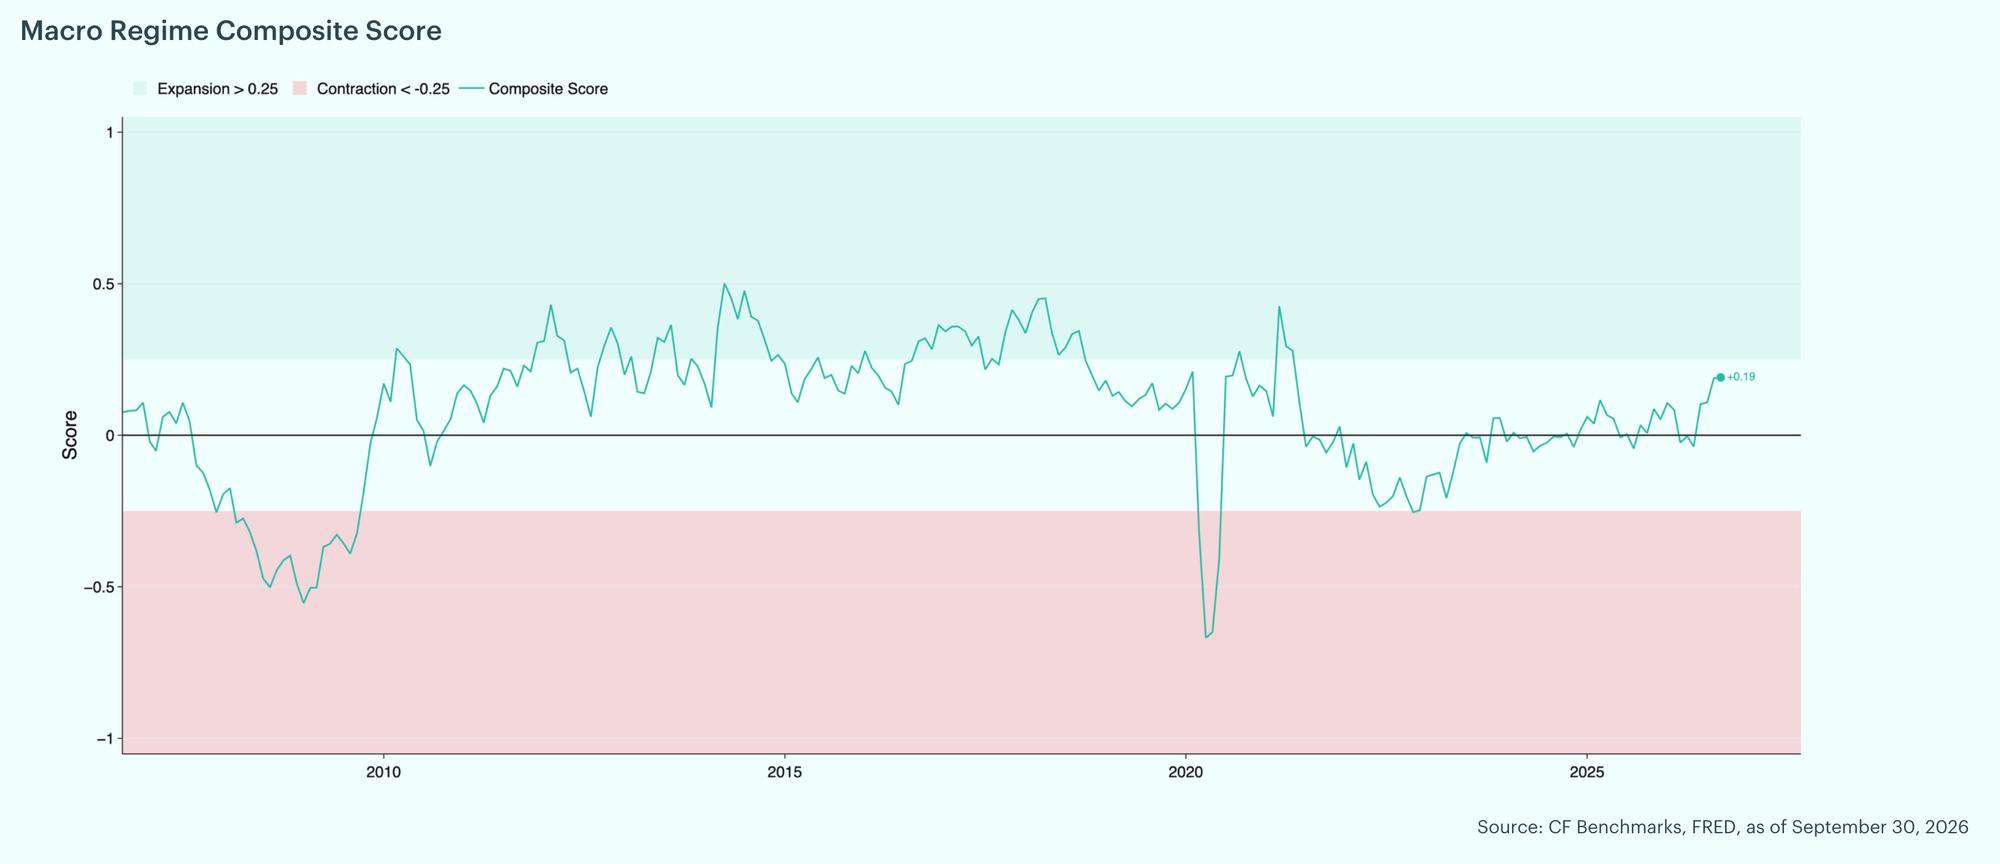
Macro Regime Holds in Neutral as Goods Demand Firms: The CF Benchmarks Macro Regime Composite Score held at +0.19, essentially unchanged from August, whose reading was revised up from +0.09 as late-month releases arrived. It remains in the neutral zone (expansion above +0.25, contraction below negative 0.25), tilting positive but short of a confirmed expansion signal. Of the 38 indicators, 12 improved, 18 were stable and 8 deteriorated. Goods demand did most of the improving. Durable goods shipments were $333.8 billion in August, up 8.6% year over year (YoY), and core capital goods shipments rose 11.4% YoY. Cass freight shipments rose 2.1% YoY, the first annual gain since January 2023, ending a record 42-month downturn that Cass and ACT Research attribute to inventory restocking as ocean volumes rise and tariff refunds arrive. Labor market slack held steady, with unemployment unchanged at 4.1% and the four-week average of initial jobless claims easing to 197,000 from 204,000. On the deteriorating side, wider high-yield credit spreads, weaker consumer sentiment and fewer job openings were joined by a flatter curve. The 10-year minus 2-year Treasury spread ended September at 0.41% after compressing to 0.20% on September 21, its narrowest since March 2025, as the 2-year yield rose faster than the 10-year following the hike. ISM Services Prices Paid rose to 72.6 from 70.3, which signals persistent input-cost pressure that could feed through to consumer prices.
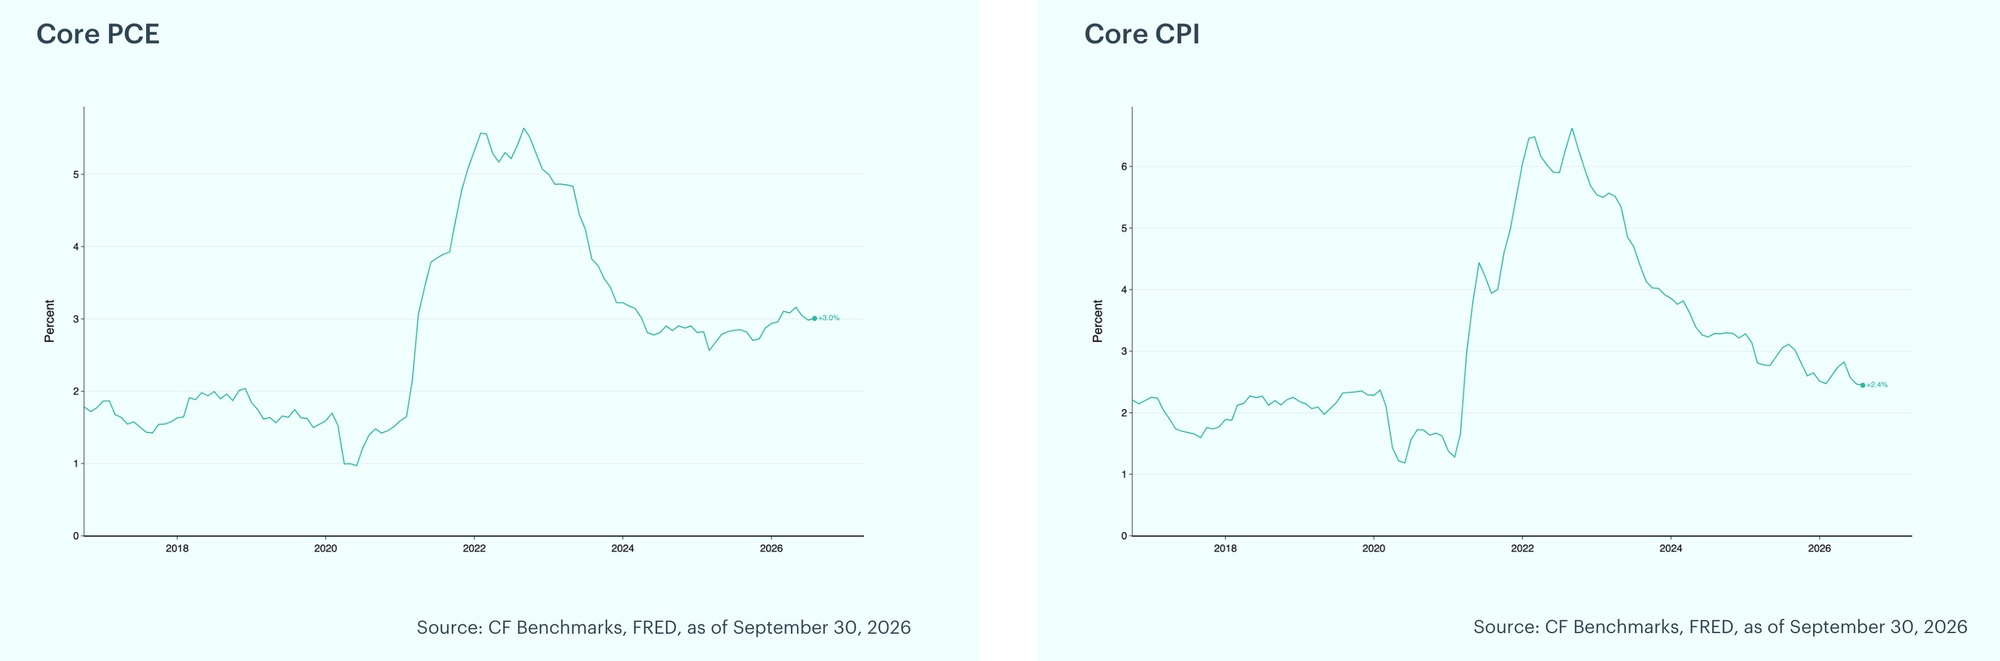
Core Inflation Remains the Variable to Watch: We are watching core inflation closely after the Federal Reserve's September hike and Chair Warsh's warning that inflation has been too high for too long. Core PCE inflation, the Fed's preferred gauge, was 3.0% YoY in August, little changed from a July reading revised down to 3.0% from 3.3%, and still a full percentage point above the 2% target. Core CPI eased to 2.4% YoY from 2.5%, its lowest reading since March 2021. A renewed move higher in either measure would reinforce the further tightening that the September dot plot already signals.
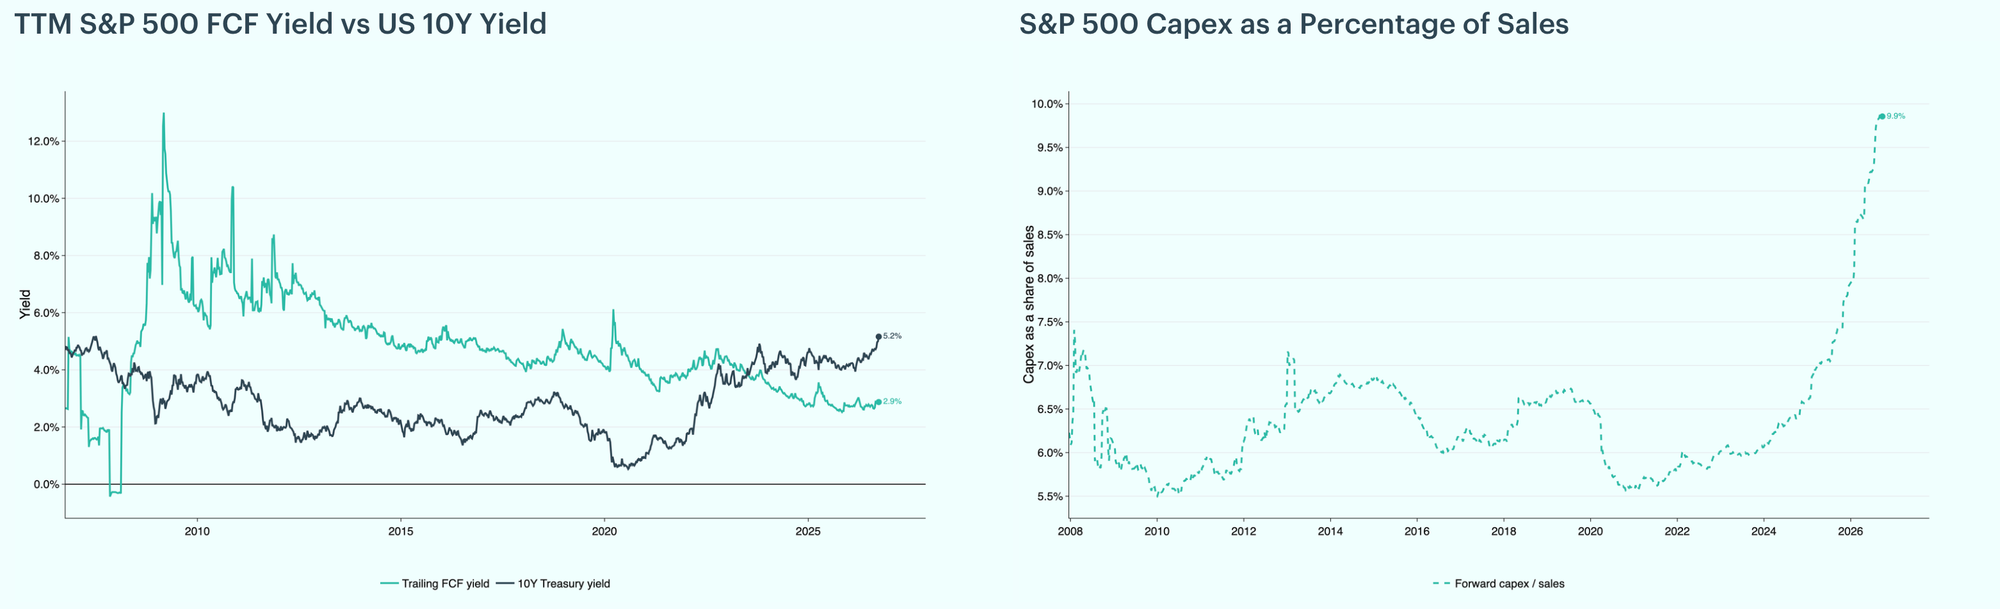
Equities Diverge as Yields Squeeze Cash Flow Spreads: US equity indices diverged in September. The Nasdaq Composite rose 1.9% to 26,861.06, while the S&P 500 slipped 0.5% to 7,651.54 and the Dow Jones Industrial Average fell 4.3% to 50,906.05. The S&P 500 and Nasdaq both bottomed on September 16, the day of the Fed's rate hike, before rebounding. The Dow did not recover and closed at its monthly low. Year to date, the Nasdaq is up 15.6%, the S&P 500 11.8% and the Dow 5.9%. Valuations eased slightly but remain rich, with the S&P 500 forward price-to-earnings ratio at 19.3x on September 25 against 16.7x for its 20-year average. The pressure came from rates. The 10-year Treasury yield jumped 44 basis points to 5.16%, its highest weekly close since July 2007, while the trailing S&P 500 free cash flow (FCF) yield edged down to 2.87%. The gap between the two widened to negative 2.29 pp from negative 1.83 pp, the deepest since February 2008.
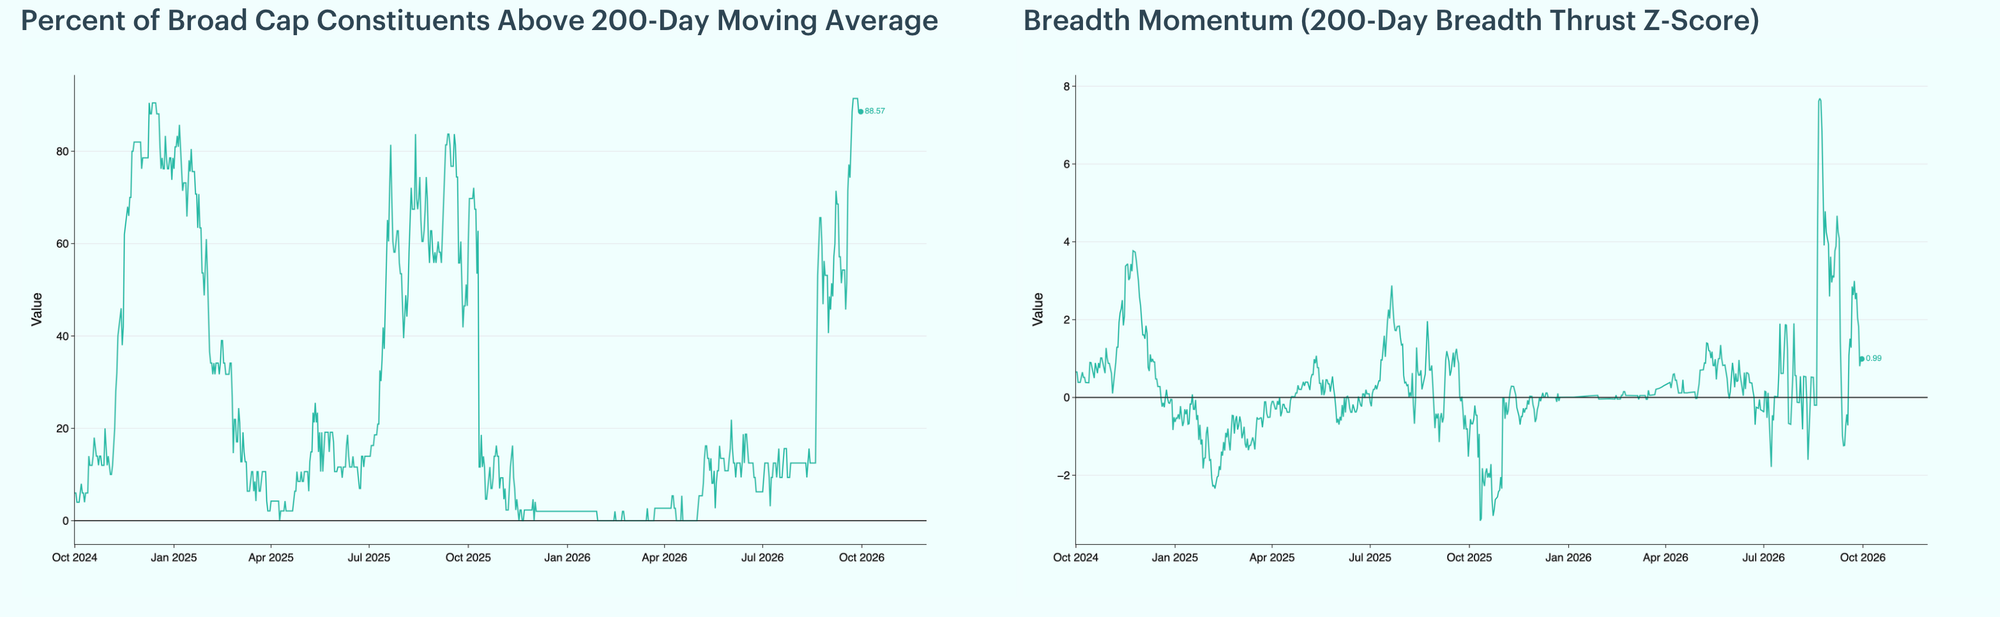
Breadth Reaches a Series High as Momentum Fades: Participation broadened sharply in September, but momentum faded. The share of Broad Cap constituents above their 200-day moving average more than doubled, from 40.6% at the end of August to 91.4% on September 23, the highest reading since the series began in April 2023, before closing at 88.6%. Breadth momentum, the one-year z-score of the 21-day change in that share, set a series high of 7.7 on August 22 and turned negative from September 11 to 17, a stretch that included the Fed's rate hike. It rebounded to 3.0 on September 23 and faded to 1.0 by month-end as the gains in participation slowed.
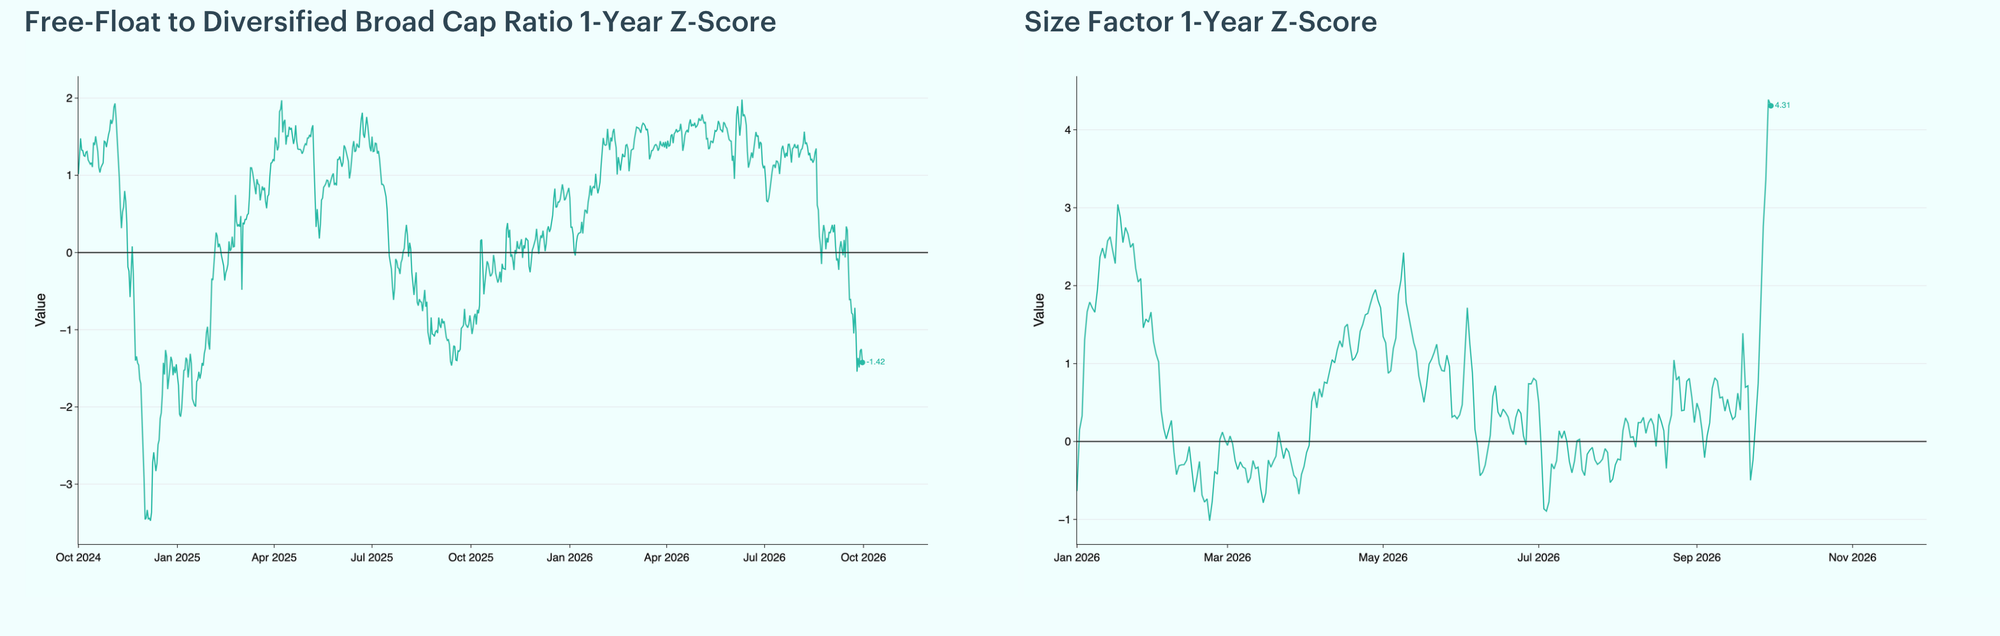
Smaller Caps Extend Their Lead: Smaller constituents widened their lead over the majors in the second half of September. The Free-Float to Diversified Broad Cap ratio z-score, which rises when the largest constituents lead, fell from 0.25 at the end of August to negative 1.54 on September 25, its lowest since January 2025, and closed at negative 1.42. The size factor's z-score climbed from 0.24 to 4.39 on September 29, the highest reading since the series began in January 2026, and finished the month at 4.31. Both moves line up with the outsized gains in smaller Broad Cap names such as QNT and NEAR.
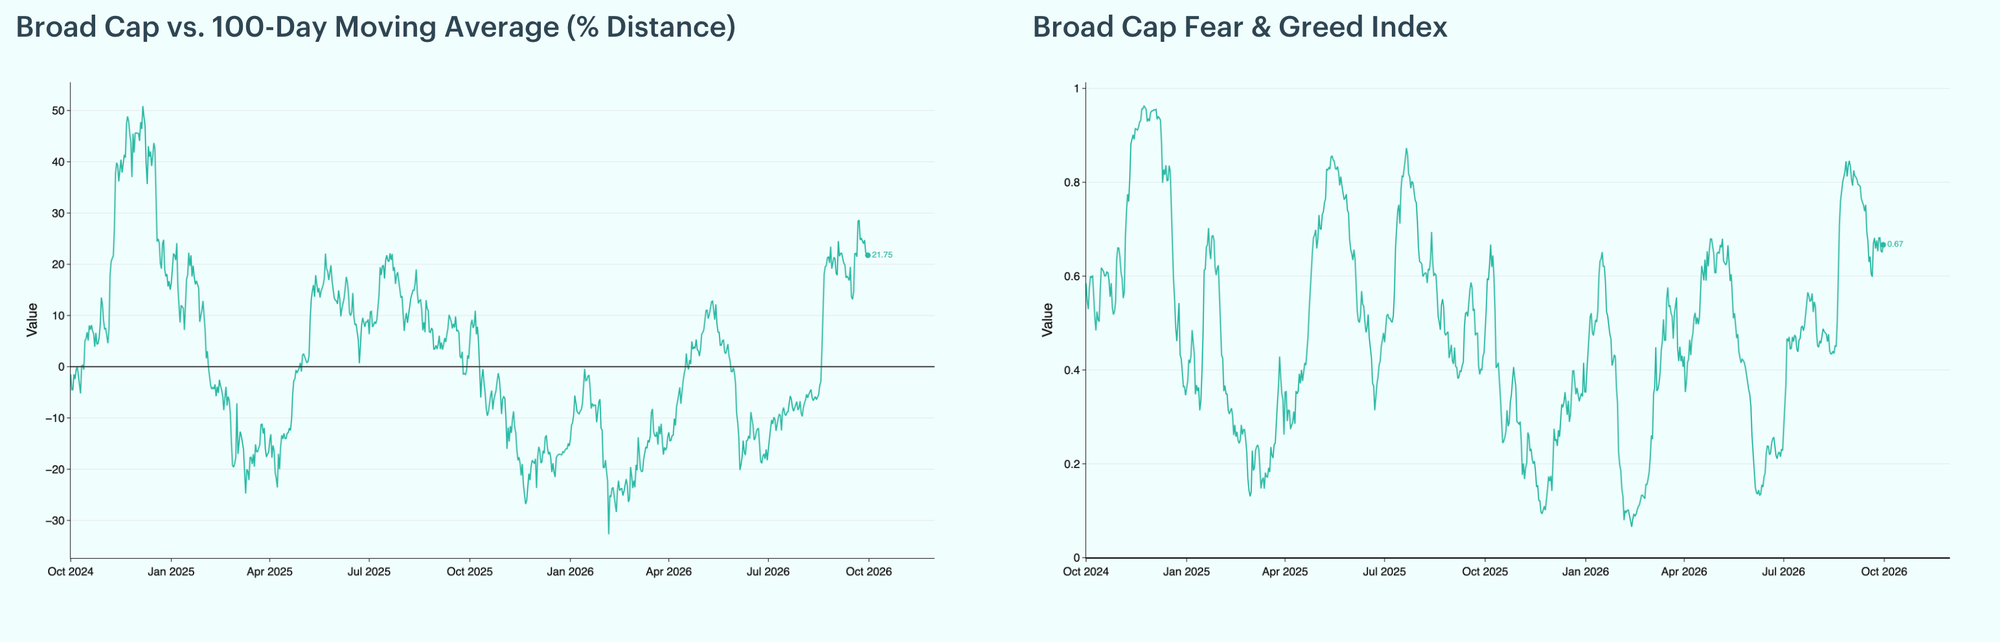
Price Stretches Above Trend While Sentiment Cools: The rally left Broad Cap well above trend. The index's distance above its 100-day moving average widened from 21.0% at the end of August to 28.6% on September 22, the widest gap since December 2024, after briefly narrowing to 13.2% on September 16, the day of the Fed's rate hike. It closed the month at 21.8%. Sentiment did not follow price higher. The Broad Cap Fear & Greed Index, scaled from 0 to 1 with 0.5 as neutral, slid from its 2026 high of 0.85 on August 30 to 0.60 on September 20 and ended at 0.67, still in greed territory. The late-month extension came with cooler, not hotter, sentiment.
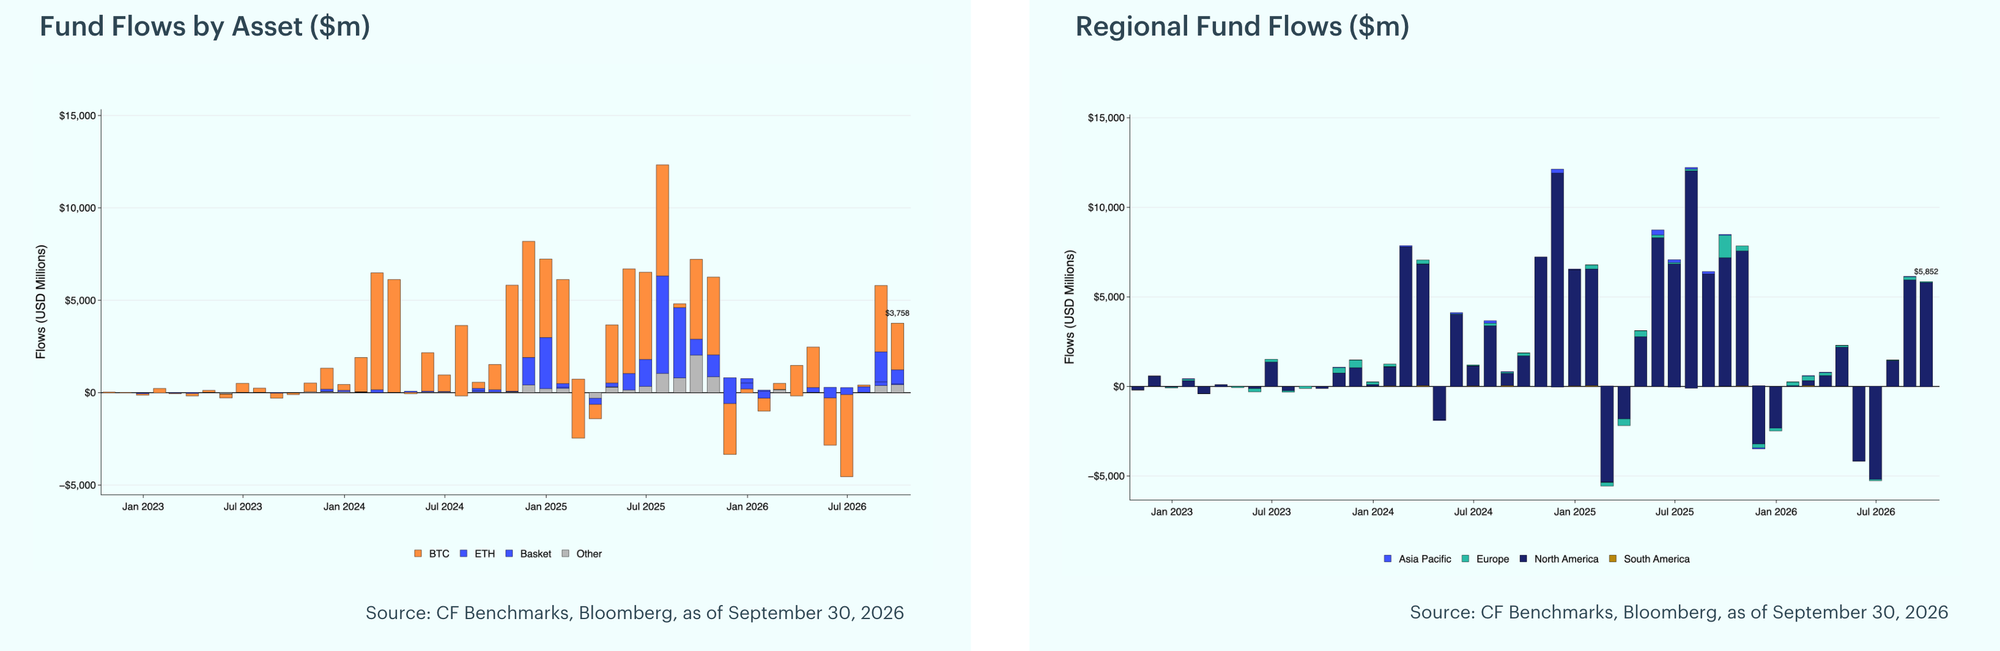
Fund Flows Slow but Stay Positive for a Third Month: Digital asset funds drew $3.8 billion of net inflows in September, a third straight month of inflows, though down 35.3% from a revised $5.8 billion in August. Bitcoin funds led with $2.5 billion, down 29.9% from $3.6 billion. Ether funds added $762 million, less than half of August's $1.6 billion, while Other Single Crypto funds rose to $429 million from $382 million and Basket funds slowed to $44 million. Regional flows, which cover a broader fund universe and do not sum to the headline figure, were again led by North America at $5.8 billion, close to August's $6.0 billion, with Europe adding $42 million and Asia Pacific and South America little changed.
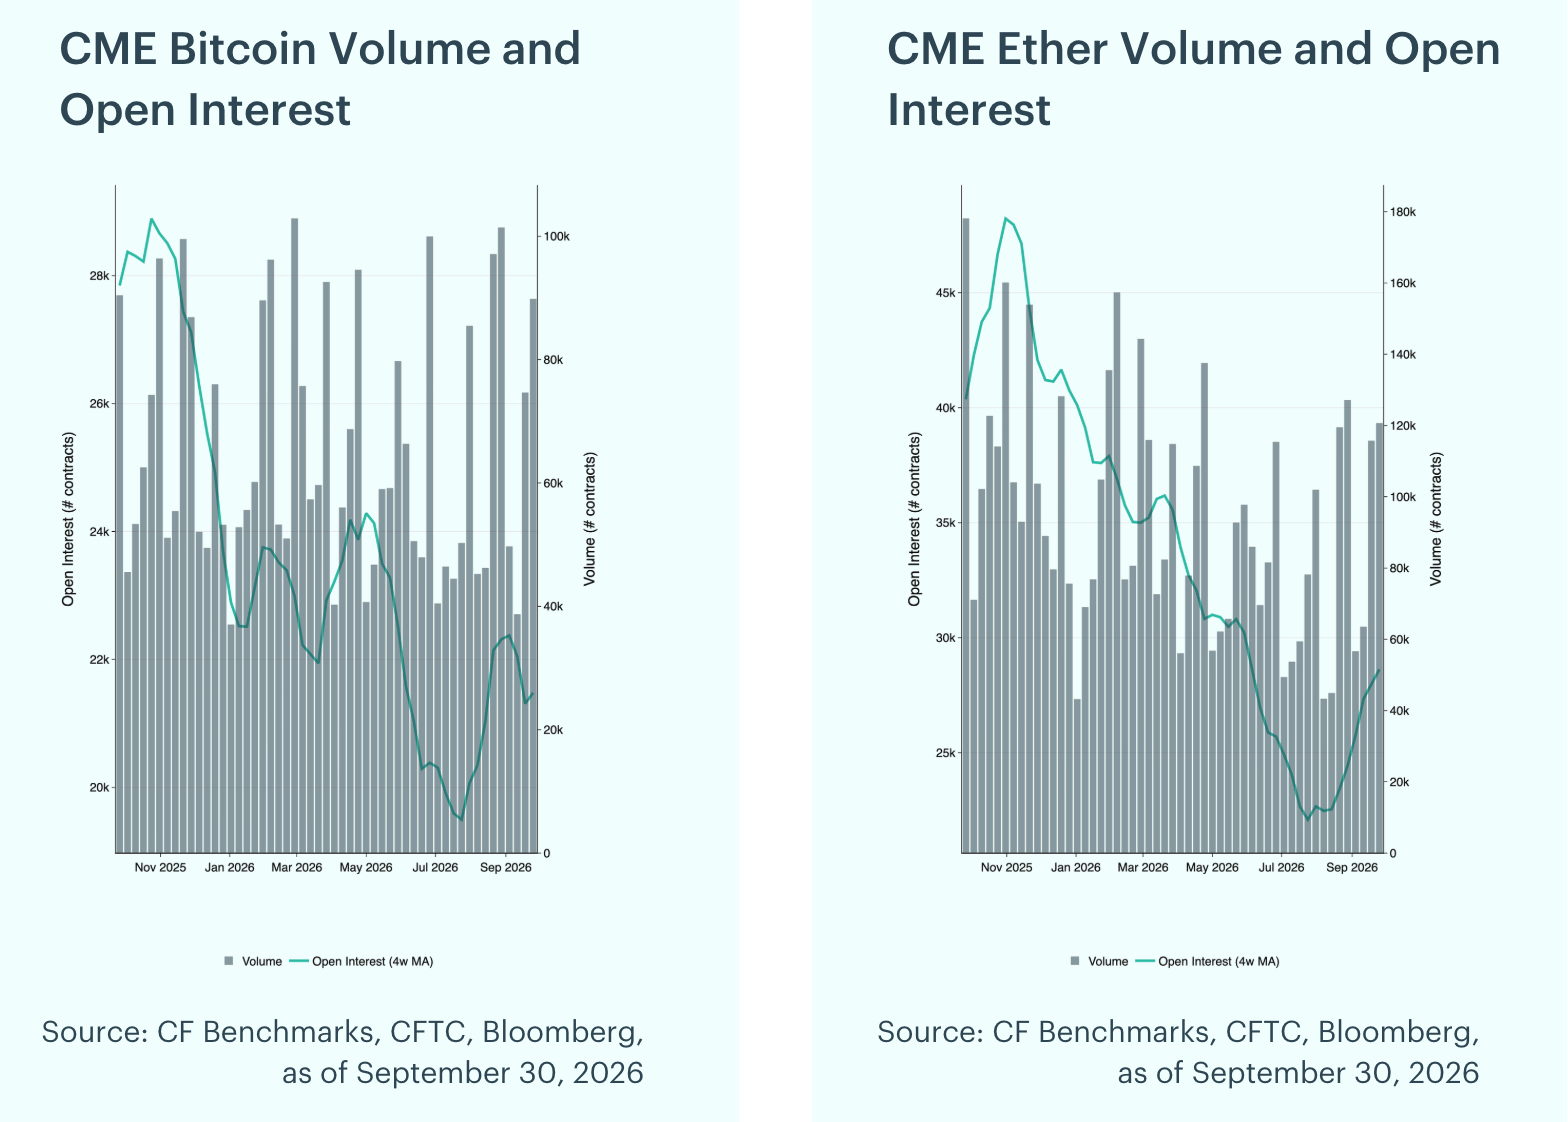
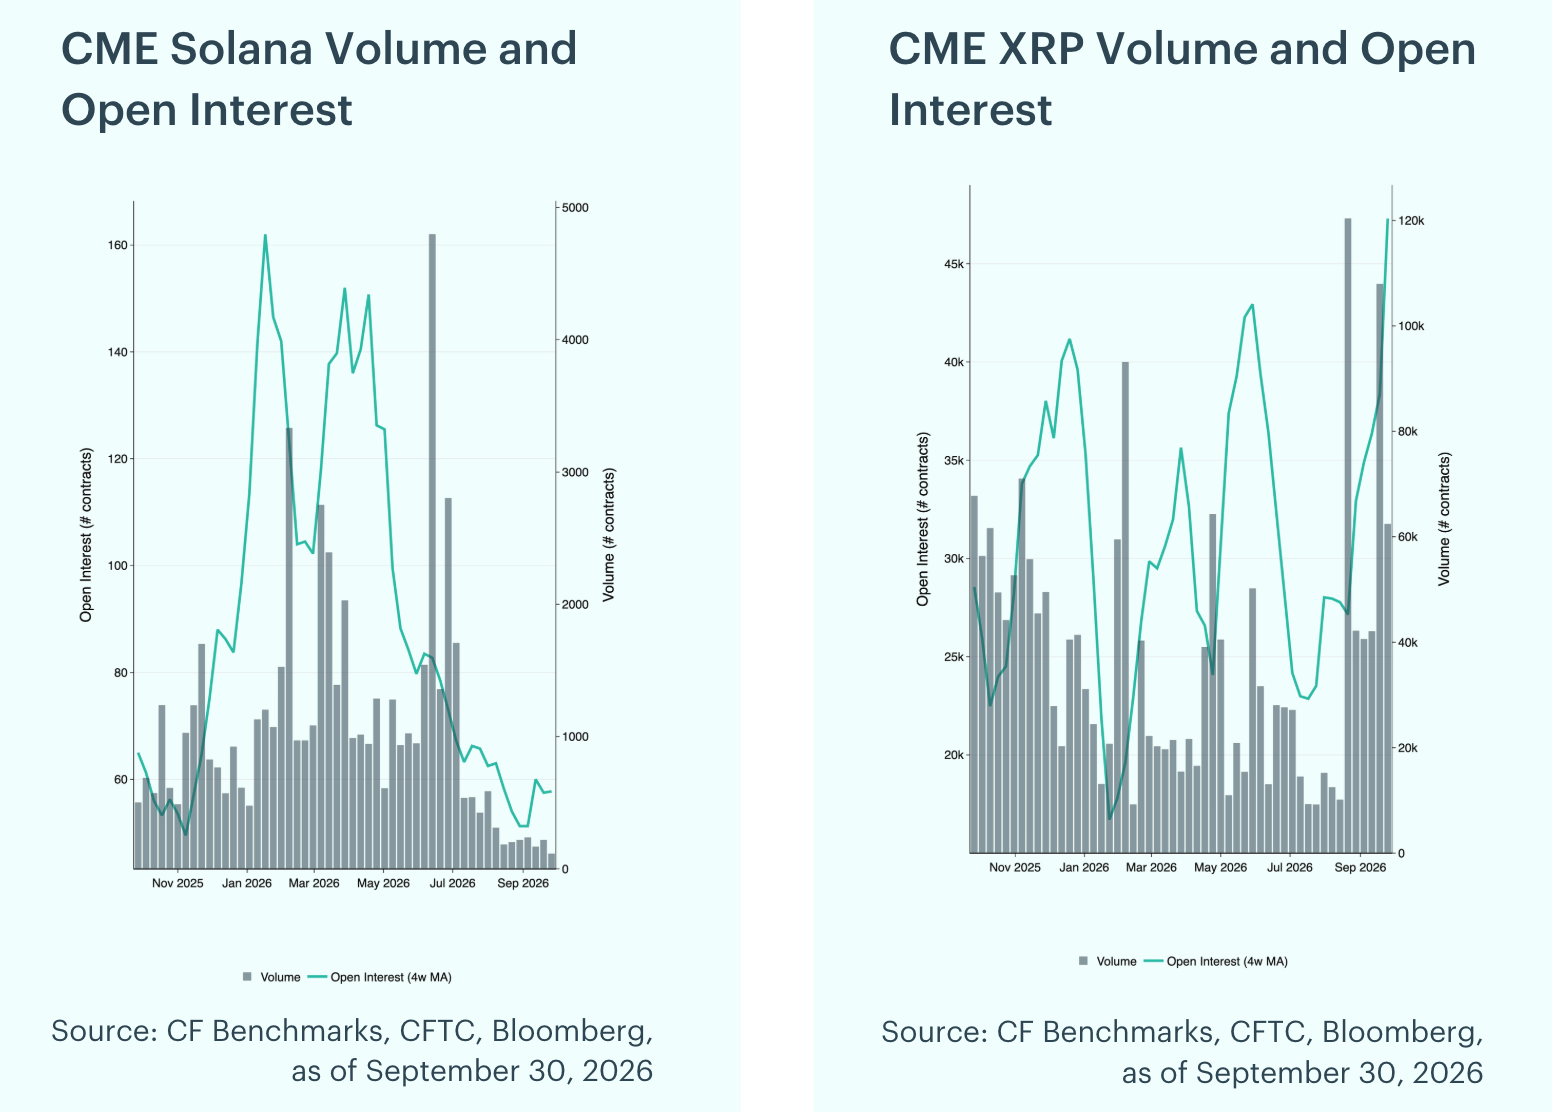
Futures Positioning Mixed, With XRP and Ether Open Interest Climbing: CME futures positioning was mixed in September. On a four-week moving average basis, XRP open interest rose 43.6% to roughly 47,302 contracts, extending a climb from 28,021 in July, and Ether (ETH) rose 17.2% to about 28,625 contracts. Bitcoin (BTC) eased 3.7% to roughly 21,481 contracts and Solana (SOL) edged up to about 58 contracts. Peak weekly volume was highest in Ether at 120,663 contracts, ahead of XRP's 107,966 and Bitcoin's 89,815.
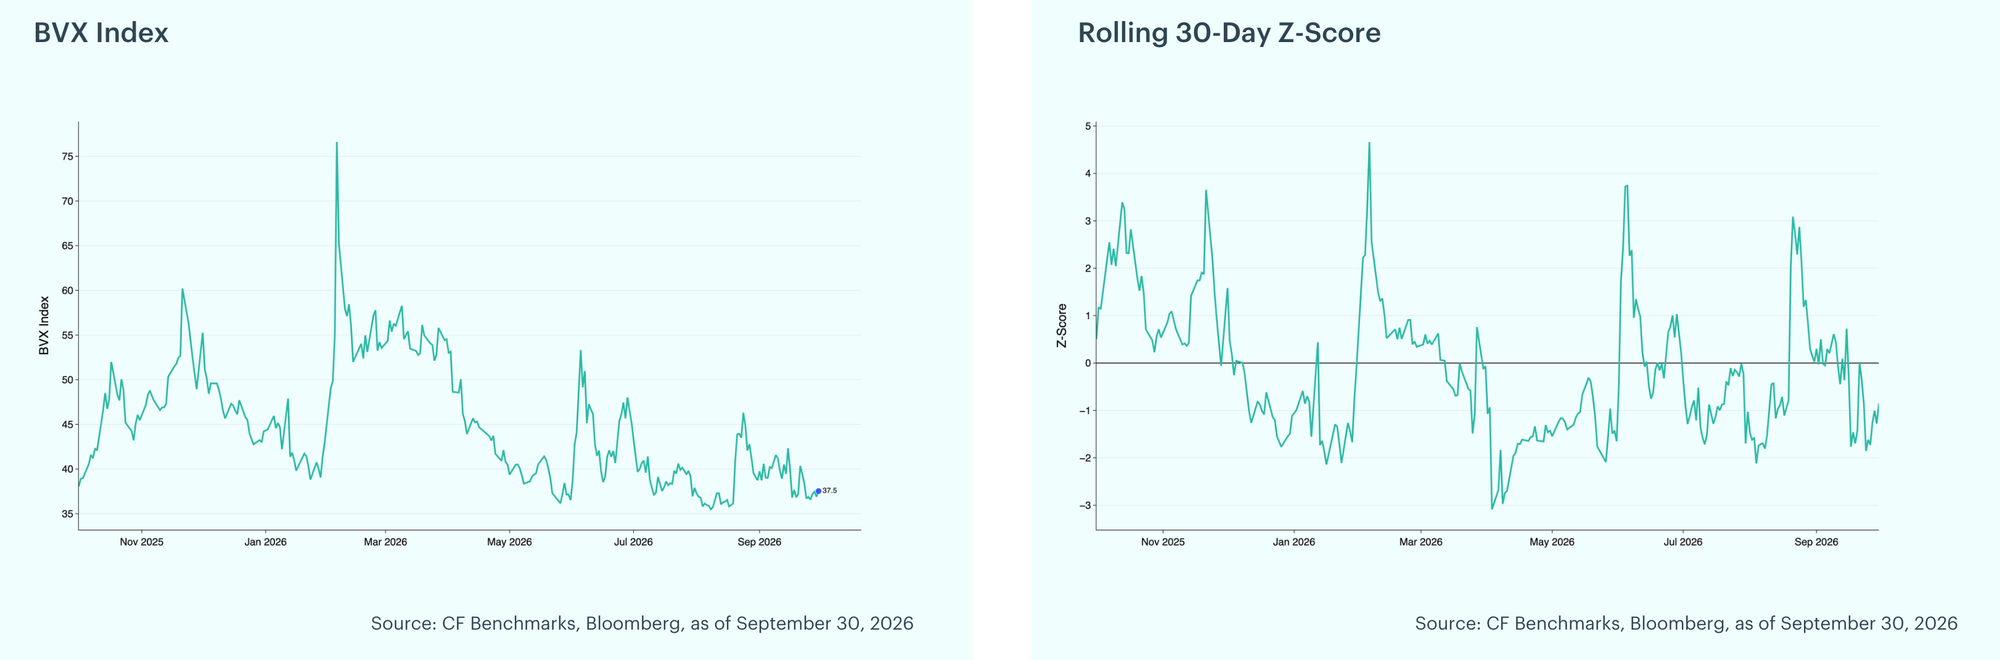
Bitcoin Volatility Eases to the Low End of Its Range: The CF Bitcoin Volatility Index (BVX), a daily benchmark providing a forward-looking, 30-day constant-maturity measure of implied volatility derived from CFTC-regulated Bitcoin option contracts traded on the CME, eased in September. The index traded in a 36.58 to 42.33 range and closed the month at 37.54, down 3.1% from 38.75 at the end of August and in the 13th percentile of its trailing-year range, despite the rate hike and the renewed U.S.-Iran strikes. The rolling 30-day z-score ended the month at negative 0.85, after ranging between negative 1.85 and 0.72 during September.
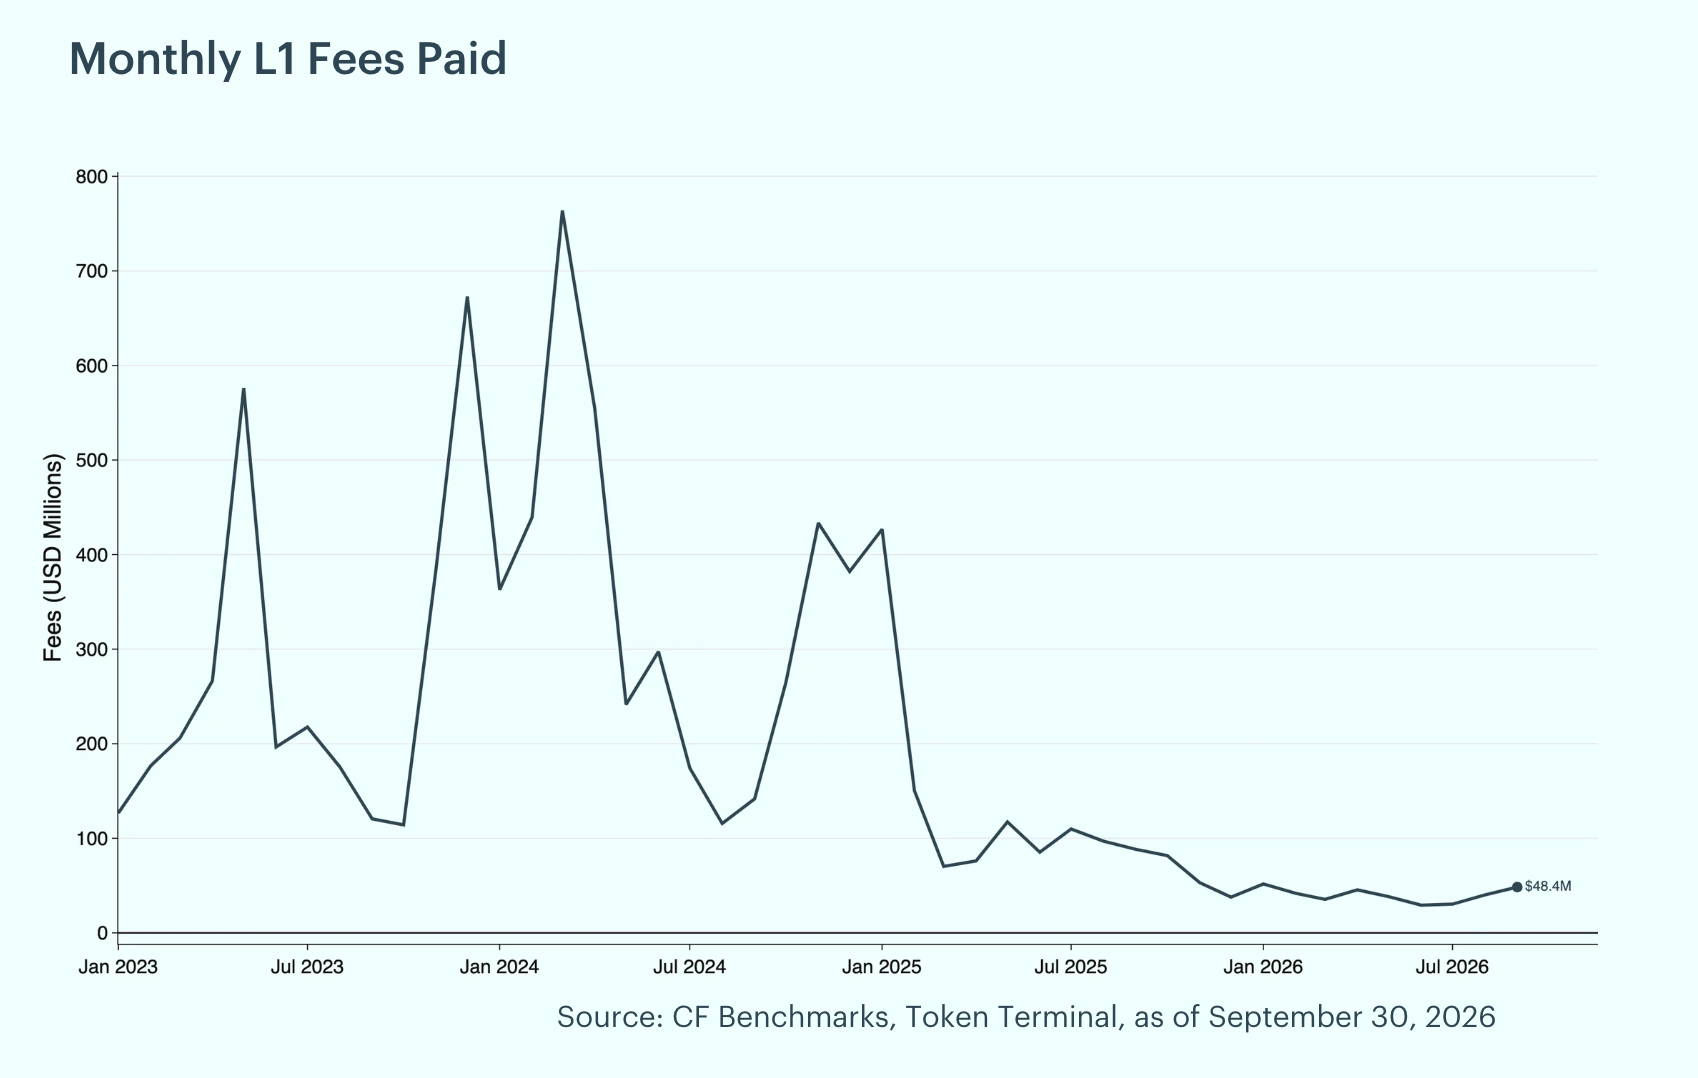
Layer 1 Fees Climb as Ethereum Regains Share: Total Layer 1 fees rose 20.7% MoM in September to $48.4 million from $40.1 million in August. Solana led with $25.0 million, 51.7% of the total, on a 12.6% increase. Ethereum followed at $16.1 million, 33.2% of the total and up 47.1%, while Bitcoin contributed $7.0 million, 14.6% of the total and up 3.6%. Ethereum's share rose from 27.2% in August, and Solana's eased from 55.4%.
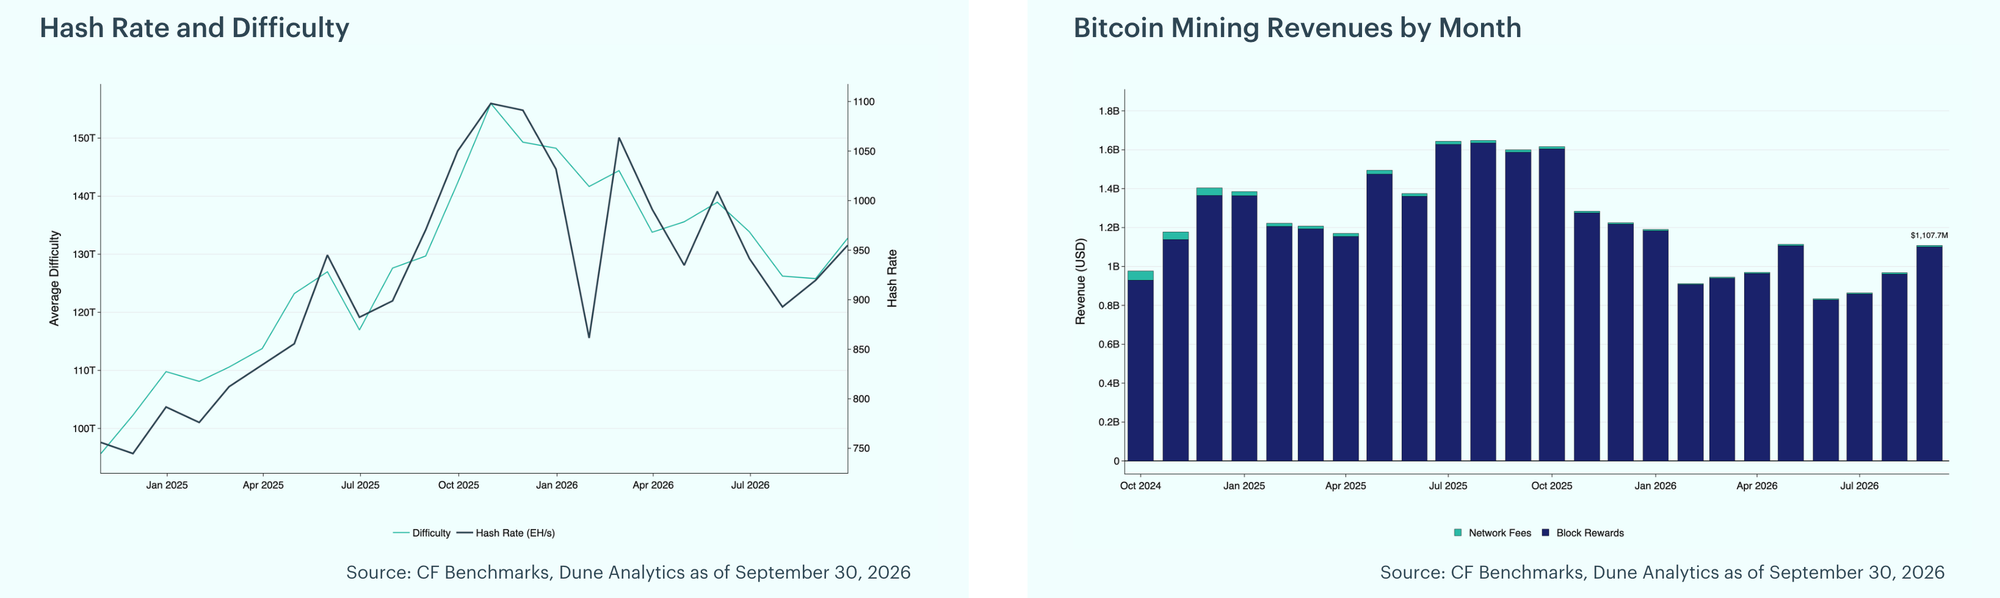
Hash Rate Finishes at Its Monthly High as Mining Revenue Rises: Bitcoin's hash rate rose 3.8% in September, climbing to 954.9 exahashes per second (EH/s) from 919.6 EH/s at August's end, and ranged between 881.7 and 954.9 EH/s during the month, finishing at its monthly high. Mining difficulty, which measures the computational effort required to mine a new block and adjusts to maintain consistent block times, rose 5.5% to 132.8T as hash power climbed. Miners saw a 14.4% increase in revenue, with total mining revenue of $1,107.7 million. Of the total rewards earned during the month, 0.6% came from transaction fees, with block rewards totaling $1,100.6 million and fees contributing $7.0 million. Revenue rose alongside the gain in hash rate and a 7.4% rise in Bitcoin's price through the month.
To read the complete report, click here to view a PDF version. Additionally, please do not forget to subscribe to our latest news and research for the most relevant institutional insights on digital assets and the top digital assets by market cap.
The information contained within is for educational and informational purposes ONLY. It is not intended nor should it be considered an invitation or inducement to buy or sell any of the underlying instruments cited including but not limited to cryptoassets, financial instruments or any instruments that reference any index provided by CF Benchmarks Ltd. This communication is not intended to persuade or incite you to buy or sell security or securities noted within. Any commentary provided is the opinion of the author and should not be considered a personalised recommendation. Please contact your financial adviser or professional before making an investment decision.
Note: Some of the underlying instruments cited within this material may be restricted to certain customer categories in certain jurisdictions.
Factor Friday - Oct 23, 2026
Size led CF Benchmarks' factor table for a fourth week at 0.75% as the Market fell 1.88% and only 4 of 35 Broad Cap tokens closed higher. Liquidity turned negative at -1.03% as more liquid assets held up better, and Size's year-to-date lead extended to 23.74%.

Mark Pilipczuk
Changes to the Token Market Price Benchmarks Series - Market Prices – 20 October 2026
The Administrator has confirmed changes to the Token Market Price Family for the period 13 October 2026 to 20 October 2026
CF Benchmarks
Altcoins Lag as Bitcoin Tests The 50-Day Moving Average
Digital assets fell broadly over the past week as Bitcoin slipped to a moving average, with inflation prints and an equity sell-off in the background. Losses grew with distance from Bitcoin, hitting diversified and smaller-cap exposure hardest, while implied volatility rose.
Mark Pilipczuk
By clicking Accept, you consent to CF Benchmarks's use of cookies.
Visit Cookie Settings to learn how CF Benchmarks uses cookies and to adjust your preferences.