
Oct 02, 2026
Factor Friday - October 2, 2026
Size Leads as Dispersion Widens
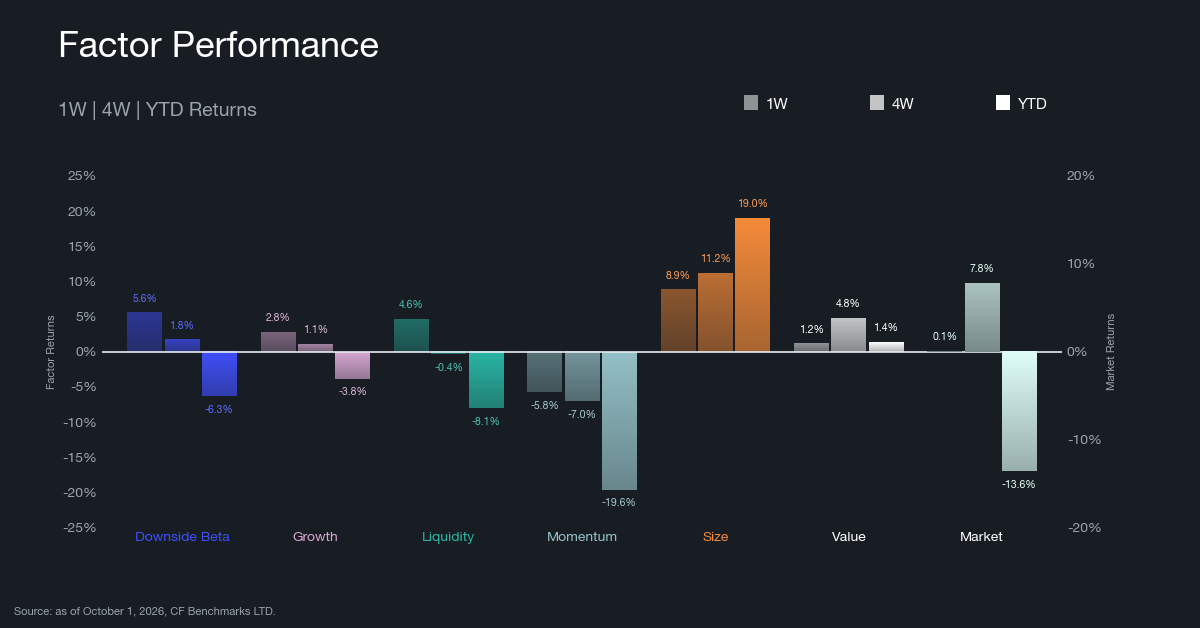
Size led the factor table this week with an 8.86% gain while the Market finished flat at 0.07%. Downside Beta (5.59%), Liquidity (4.61%), Growth (2.84%) and Value (1.15%) also closed higher, and Momentum (-5.80%) finished last. Over four weeks Size leads at 11.16%, ahead of the Market (7.82%) and Value (4.83%), with Momentum (-7.00%) at the bottom. Year to date, Size extended its lead to 19.01% from 9.33% a week earlier, Value held positive at 1.35%, and Momentum slid to -19.61%, the weakest of the seven, below the Market's -13.62%. Much of the week's dispersion traces to one asset. Quant (QNT) rose 200.30% between September 24 and October 1, and for most of that stretch it sat on the long side of the Size, Downside Beta and Liquidity portfolios and on the short side of Momentum, so all four prints carry its move. Breadth beneath it still leaned toward smaller names: the median CF Broad Cap constituent gained 1.85% and 22 of 35 finished higher, while Bitcoin (BTC) added only 0.22%. A Size print that holds up once QNT's gains cool would be stronger evidence that the bid down the market cap curve is broad.
Rolling Factor Rankings and Rotation
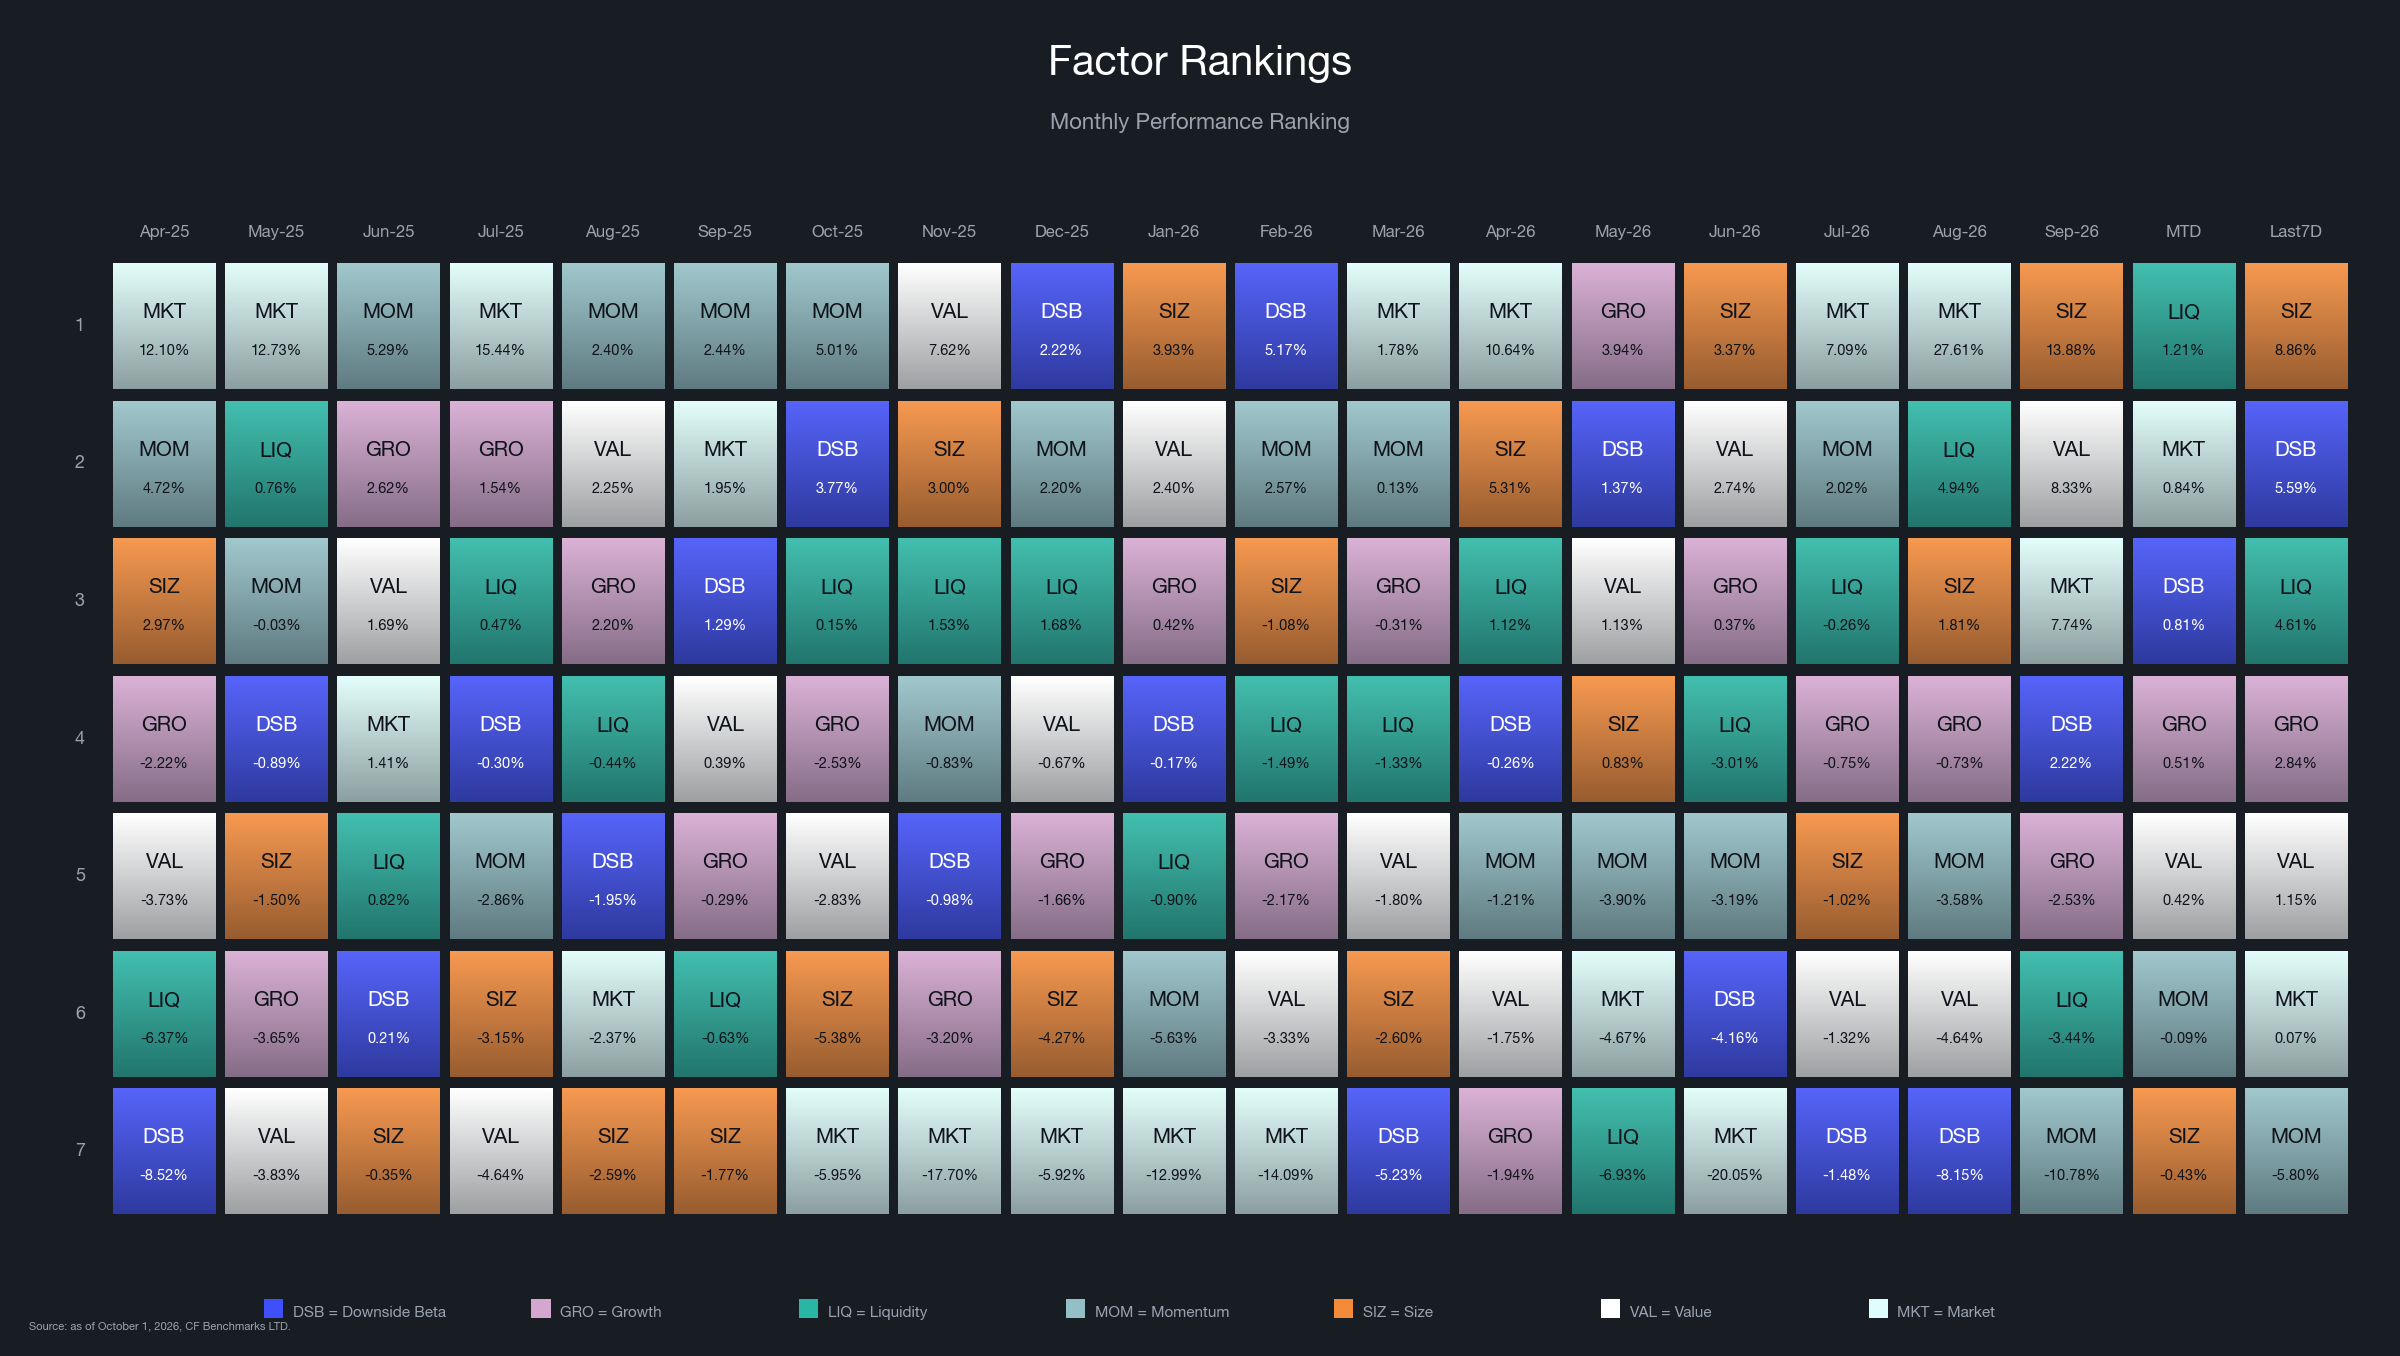
Size took the top of the weekly table from the Market, which dropped from first to sixth as last week's 11.70% gain gave way to 0.07%. Downside Beta climbed from sixth to second at 5.59%, reversing a -3.37% print, and Liquidity rose from last to third at 4.61% after -4.71%. Growth gained one place to fourth, Value slipped from third to fifth, and Momentum fell from fourth to last as its loss widened from -1.02% to -5.80%. September closed with Size first for the month at 13.88%, ahead of Value (8.33%) and the Market (7.74%), and Momentum last at -10.78%, the lowest Momentum reading on the quilt, which runs back to April 2025. October's first session already pointed the other way, with Size last on the day at -0.43% as QNT gave back 12.32%. Last week's report flagged that leadership resting on the Market alone would be fragile, and within a week the three sign-inverted factors hold the top three places. Read literally, that ordering favors smaller, more defensive and less liquid tokens, yet QNT sat on the favorable side of all three for most of the week, so the signal is narrower than the rankings imply. Should Size and Downside Beta stay near the top after QNT's move leaves the weekly window, the rotation will have a broader base.
Market and Key Factor Betas
Market Beta
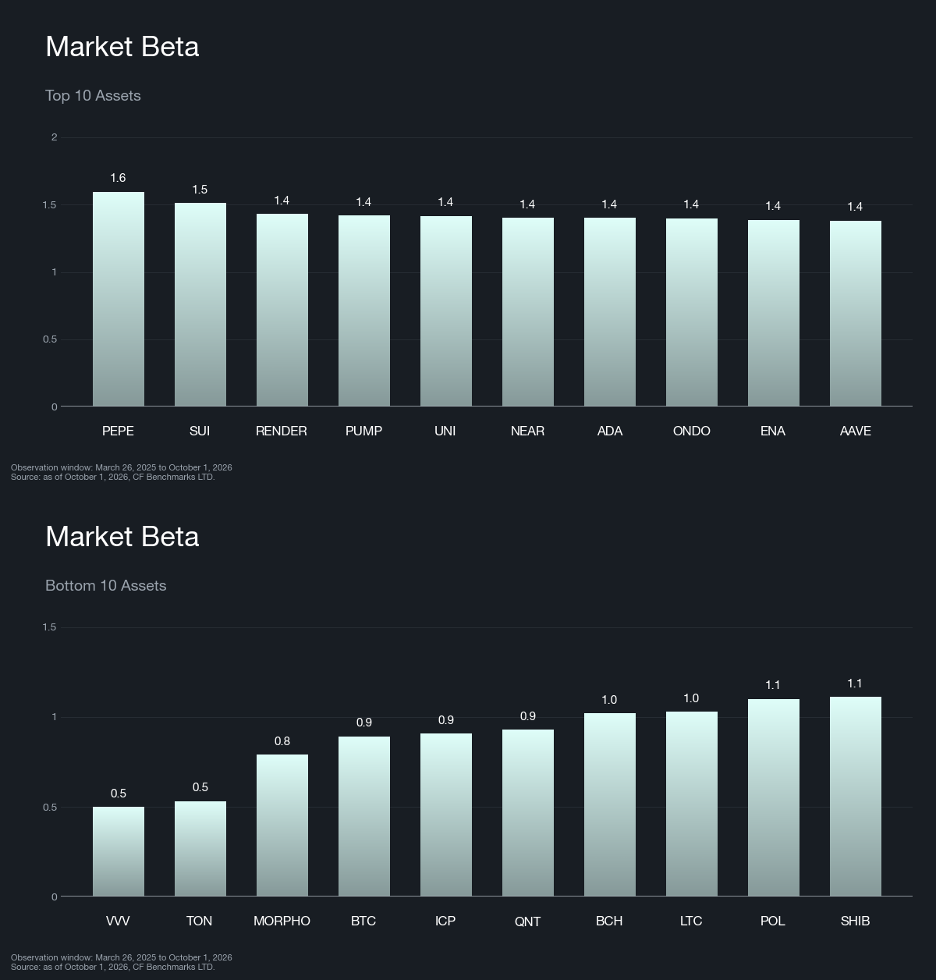
Broad beta went unrewarded this week. The high market-beta roster kept all ten names from last week, a mix of meme-linked tokens, DeFi protocols and alternative layer-1 platforms alongside AI compute and real-world-asset names, with only the order shifting. Turnover came at the low end, and most of it reflects index membership rather than behavior. Venice (VVV), Toncoin (TON) and Morpho (MORPHO) joined the CF Broad Cap basket on September 1 and this week passed the 30 observations the regression requires, entering at the bottom of the list with betas of 0.50, 0.53 and 0.79. Those estimates rest on a single month of data and should be read as provisional. Hedera (HBAR), Stellar (XLM) and Algorand (ALGO) left the low-beta ten, and Bitcoin now sits fourth from the bottom at 0.89. The ten highest market-beta names returned an average 8.69%, while the ten lowest averaged 17.31%, a figure that falls to -3.02% once QNT is removed. Excluding that one token, high beta outperformed by close to 12 pp in a week when the cap-weighted Market barely moved, which places the return in token-specific and size effects that a Bitcoin-heavy benchmark does not capture. Holders of broad beta earned close to nothing while the typical constituent rose, a week after the Market itself gained 11.70%.
Size
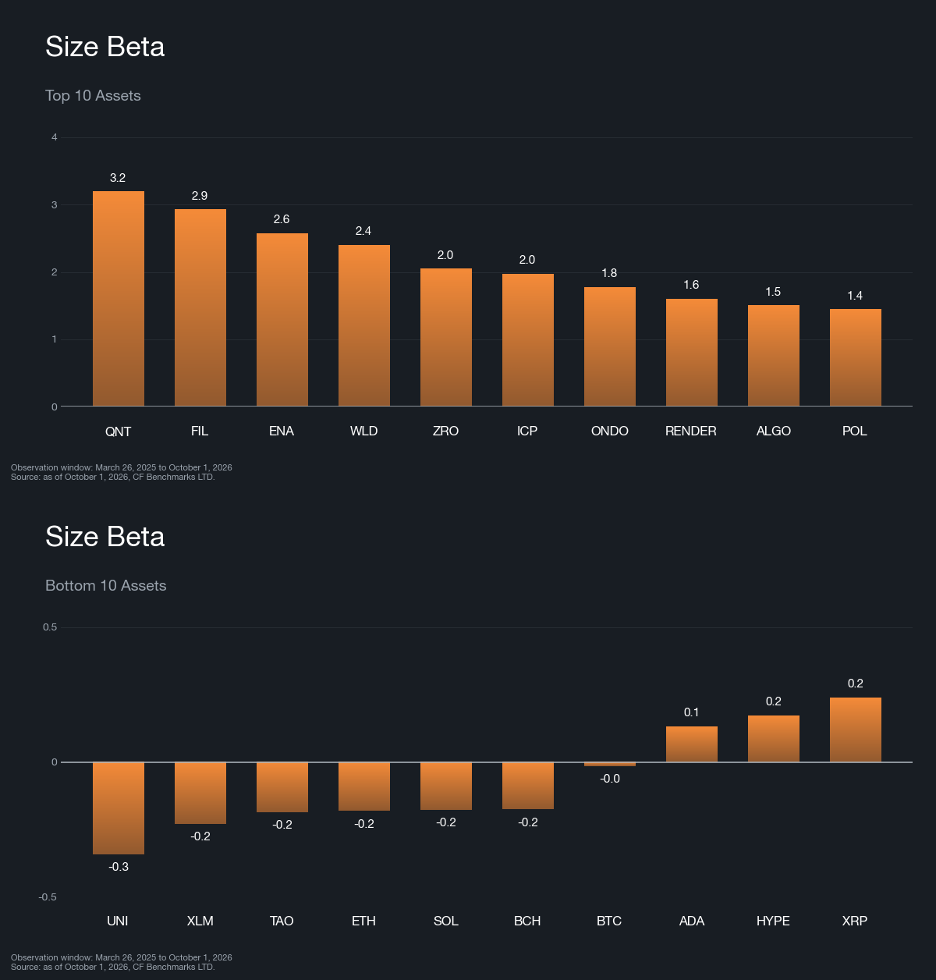
Size rose 8.86% and now leads the table on every horizon shown. The factor is sign-inverted, so a positive print means smaller assets outperformed larger ones. QNT entered the high size-beta cohort at the top with a beta of 3.19, displacing Filecoin (FIL), whose beta eased from 3.54 to 2.92. The rest of the cohort is still drawn from storage, AI compute, interoperability and DeFi tokens, with ALGO also entering as Polkadot (DOT) and Pepe (PEPE) left. The opposite end remains weighted toward the largest networks, including Ether (ETH), Solana (SOL) and Bitcoin, with Hyperliquid (HYPE) and XRP entering as Sui (SUI) and Aave (AAVE) dropped out. Part of QNT's rise up the list is mechanical: its own return is now a large piece of the Size factor's daily series, so its regression against that series picks up the overlap. The factor scores show the other side of the same move. QNT's size score barely changed, from 0.23 to 0.22, yet that was enough to move it from the long side of the portfolio to the short side on September 29, as its market capitalization caught up with the median. The ten highest size-beta names returned an average 26.32% against -1.47% for the ten lowest. Excluding QNT, the high-beta average is 6.99%, which still leaves an 8.46 pp spread in favor of smaller caps. That residual spread is the part of the Size print that does not depend on one token, and it is the figure to track as QNT's move rolls out of the window.
Momentum
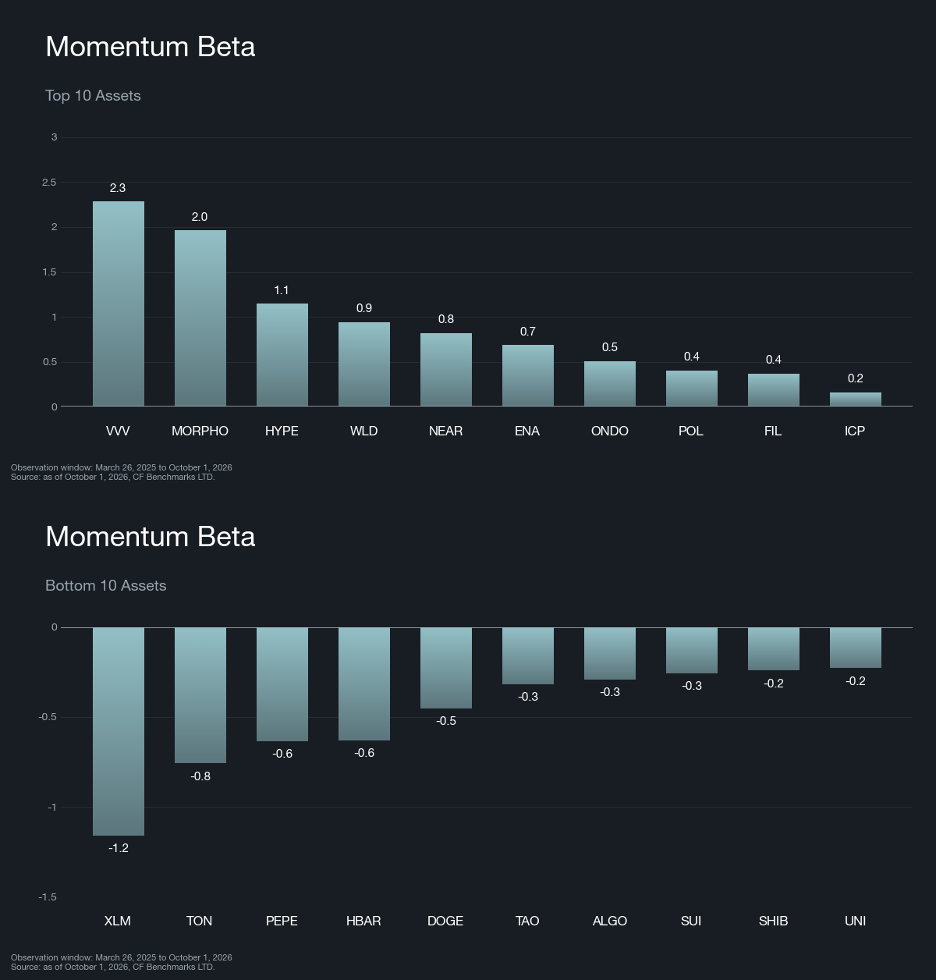
Momentum finished last on the week at -5.80% and holds the bottom spot on every horizon, at -7.00% over four weeks and -19.61% year to date. The loss came from a sharp reversal in ranking. QNT entered the week on the short side of the Momentum portfolio with a score of -0.74, then tripled in price; its score swung to 4.24, the largest Momentum score change of any constituent, and it reached the long side only on September 29, after most of the gain was in and shortly before its 12.32% decline on October 1. VVV traced the opposite path, from a long-side score of 3.33 to -0.28 as it fell 15.49%. The beta list carries the same imprint. VVV and MORPHO, both new to the regression, entered the high momentum-beta cohort at the top with betas of 2.28 and 1.96, displacing QNT and Avalanche (AVAX), and both fell more than 10% on the week. The rest of that cohort mixes trading-venue, DeFi and AI-linked tokens with a few layer-1 networks. The low end is still made up of meme coins and the payment and enterprise chains led by XLM, with TON entering as LayerZero (ZRO) left. The ten highest momentum-beta names averaged -0.41% against 4.62% for the ten lowest, a 5.02 pp gap against the trend-following side. While leadership turns over this quickly, a signal built on two-week performance is more likely to absorb reversals than to earn from them.
What Factors are Driving Markets
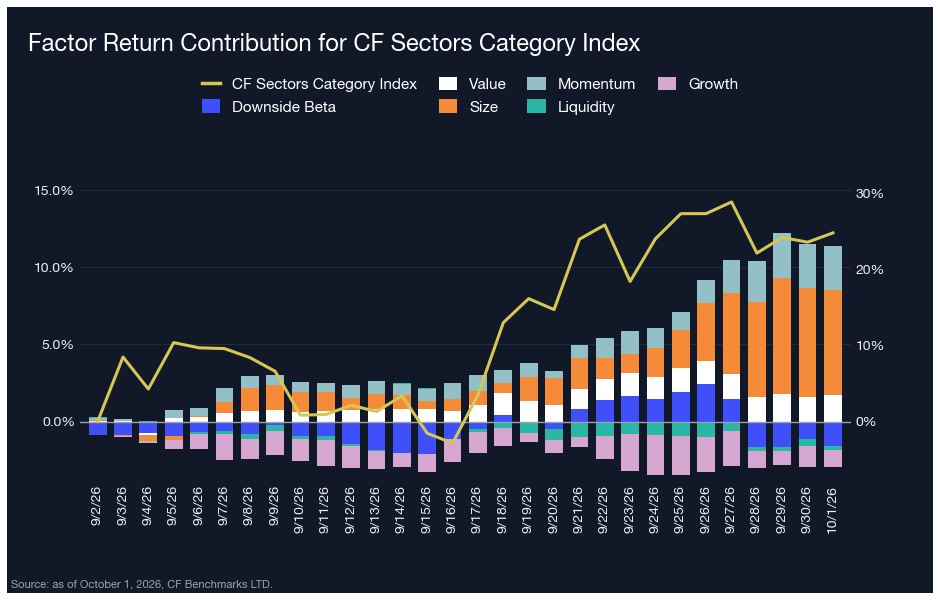
Factor contributions across the CF DACS Sectors universe total 8.40% over the trailing 30 days against an index return of 24.79%, leaving the index 16.39 percentage points (pp) ahead, a gap that narrowed from 20.29 pp last week. The factor sleeve nearly tripled from 3.02%, with Size (6.85%) now the dominant contributor after 1.40% a week earlier, ahead of Momentum (2.83%) and Value (1.69%), while Downside Beta (-1.59%), Growth (-1.11%) and Liquidity (-0.28%) were the drags. The index rose only 0.62% on the week, held back by Dogecoin (DOGE), which carries 45.18% of the weight and fell 1.66%. Pump (PUMP) led at 47.17%, 46.54 pp ahead of the index, with AAVE and Ethena (ENA) also above 10%, while MORPHO lagged at -10.28%, 10.90 pp behind. Factors now explain about a third of the 30-day return, up from 13%, so Size exposure is carrying a larger share of a category that had been driven mostly by token-specific moves.
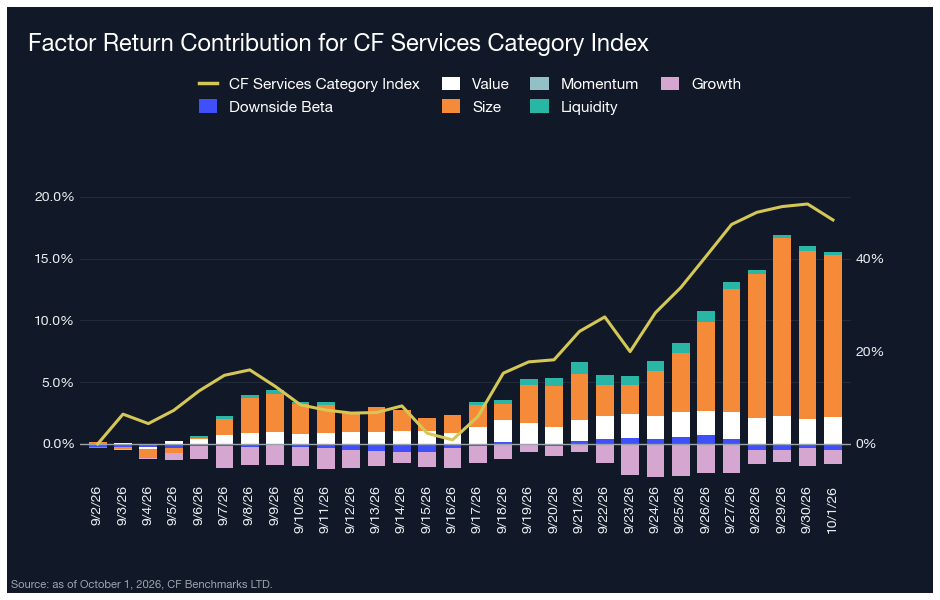
In the CF DACS Services universe, factor contributions total 13.86% against an index return of 48.21%, a 34.35 pp gap that nearly doubled from 17.72 pp. Size accounts for nearly all of the factor sleeve at 13.09%, up from 1.93%, with Value adding 2.17% and Growth (-1.15%) the largest drag. The category's 15.67% weekly gain rests largely on one constituent: QNT returned 200.30%, 184.63 pp ahead of the index, and its weight rose from 5.37% to 13.94%, accounting for roughly 11 pp of the week's gain. VVV lagged at -15.49%, 31.16 pp behind. With factor contributions explaining under a third of the 30-day return and one token responsible for most of the week, Services now carries meaningful single-asset concentration, and a reversal in QNT would reach the index before it reached the Size contribution.
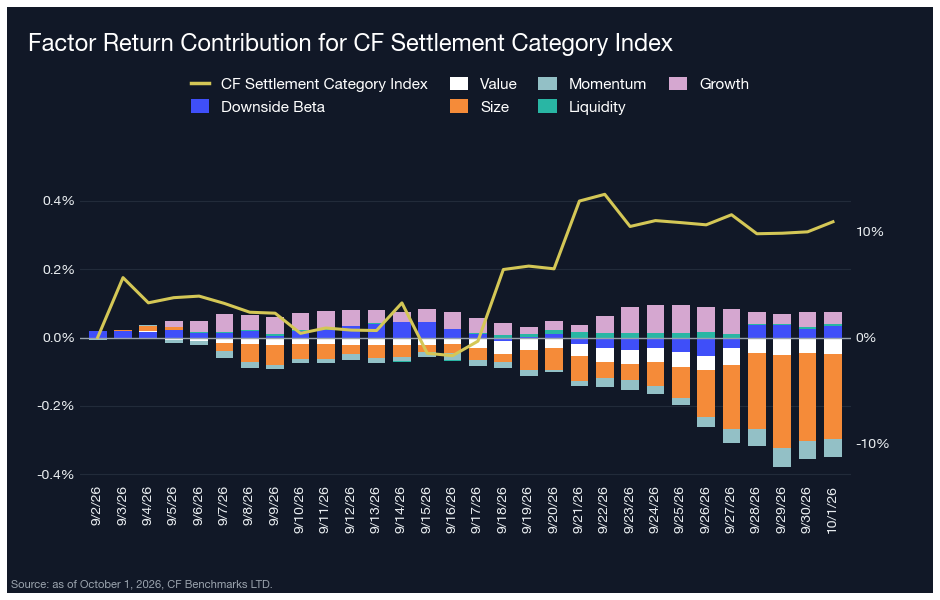
The Settlement universe, dominated by Bitcoin, again shows the weakest link to the factor set. Factor contributions total -0.28% against an index return of 10.97%, an 11.24 pp gap that widened from 9.26 pp, and Size (-0.25%) was the only factor to contribute more than 0.06 pp in either direction. The index slipped 0.10% on the week as declines in XRP (-2.05%) and HYPE (-7.30%) offset Bitcoin's 0.22% gain at 73.27% of the weight. Smaller constituents moved further: SUI rose 15.91%, 16.01 pp above the index, with ALGO and HBAR also above 11%, while Bitcoin Cash (BCH) fell 9.03%, 8.93 pp behind. Those names carry too little weight to move the total, so Settlement remains a Bitcoin position and the week's Size rally passed it by.
Appendix: CF Factor Methodology
Market Factor
The market factor captures the broad, systematic risk that permeates the digital asset ecosystem. It reflects aggregate influences such as macroeconomic conditions, investor sentiment, and overall market volatility. As such, this factor is defined by the daily returns of the CF Broad Cap (Free Float Market Cap Weight) Index, offering a comprehensive and capitalization-weighted representation of the asset class.
Size Factor
The size factor captures the return differential associated with asset scale, reflecting the hypothesis that smaller-cap digital assets tend to outperform their larger-cap counterparts. This effect is understood to compensate for elevated operational and financial risks while exploiting potential market inefficiencies. In this framework, the size factor is defined by each asset’s fully diluted market capitalization. The value is sign-inverted so that higher z-scores are assigned to smaller assets and vice-versa.
Value Factor
The value factor reflects a protocol’s ability to generate economic output relative to its capital base and market valuation, combining measures of both efficiency and user engagement. It is constructed as the average z-score of two key ratios: transaction fees relative to total value locked (Fees/TVL) and daily active users relative to market capitalization (DAU/MCap). This composite metric captures how productively a protocol utilizes its resources while also serving as a proxy for user-driven demand. A higher combined score indicates efficient resource utilization and strong user engagement.
Momentum Factor
The momentum factor captures short-term price persistence by identifying assets that have recently exhibited strong performance. It is computed as the average z-score of two metrics: the 2 weeks cumulative performance and the 2 weeks risk-adjusted cumulative performance. This approach aligns with established findings in traditional financial literature and demonstrates empirical relevance in digital assets, where price trends tend to exhibit momentum over short horizons.
Growth Factor
The growth factor captures the expansion of a protocol’s network activity and user adoption. In the context of digital assets, it reflects metrics such as fee generation and user engagement, which serve as indicators of increased platform utilization and operational scale. The factor is defined as the average z-score of 30-day fee growth and 30-day weekly active user growth, thereby identifying assets exhibiting consistent and measurable increases in underlying network usage.
Downside Beta
The downside beta factor captures an asset’s sensitivity to adverse market conditions by isolating its behavior during periods of negative market returns. Empirical evidence shows that assets with lower downside beta tend to outperform their higher-beta counterparts over the long-term, due to their reduced participation in market drawdowns and more stable return profiles during periods of elevated volatility. As such, it is estimated through a regression of the asset’s daily returns over the most recent four-week period against market returns observed exclusively during negative sessions. The resulting value is sign-inverted to ensure that assets with lower downside exposure are assigned higher z-scores.
Liquidity Factor
The liquidity factor captures the ease with which a digital asset can be traded without significantly impacting its price. Empirical evidence shows that illiquid assets tend to command a higher risk premium than their more liquid counterparts, serving as compensation for trading friction and price volatility. To quantify this, the factor is measured using token turnover, defined as trading volume as a percentage of circulating supply. The value is sign-inverted such that higher z-scores are assigned to less liquid assets.
For further detail, view the CF Factors Methodology Document, the CF Factor Data Suite, and Our paper “A Factor Model for Digital Assets” in Springer Nature’s Mathematical Research for Blockchain Economy.
The information contained within is for educational and informational purposes ONLY. It is not intended nor should it be considered an invitation or inducement to buy or sell any of the underlying instruments cited including but not limited to cryptoassets, financial instruments or any instruments that reference any index provided by CF Benchmarks Ltd. This communication is not intended to persuade or incite you to buy or sell security or securities noted within. Any commentary provided is the opinion of the author and should not be considered a personalised recommendation. Please contact your financial adviser or professional before making an investment decision.
Note: Some of the underlying instruments cited within this material may be restricted to certain customer categories in certain jurisdictions.
Changes to the Token Market Price Benchmarks Series - Market Prices – 20 October 2026
The Administrator has confirmed changes to the Token Market Price Family for the period 13 October 2026 to 20 October 2026

CF Benchmarks
Altcoins Lag as Bitcoin Tests The 50-Day Moving Average
Digital assets fell broadly over the past week as Bitcoin slipped to a moving average, with inflation prints and an equity sell-off in the background. Losses grew with distance from Bitcoin, hitting diversified and smaller-cap exposure hardest, while implied volatility rose.
Mark Pilipczuk
Factor Friday - October 16, 2026
Size led the factor table for a third week at 0.59% as the Market rebounded 0.40% and 15 of 35 Broad Cap tokens closed higher. Momentum fell 1.58% in a rebound led by laggards, and Size's weekly print has narrowed from 8.86% to 0.59% in three weeks, even as its year-to-date lead holds at 22.81%.
Mark Pilipczuk
By clicking Accept, you consent to CF Benchmarks's use of cookies.
Visit Cookie Settings to learn how CF Benchmarks uses cookies and to adjust your preferences.