
Mar 09, 2022
CF Digital Culture Index benchmarks protocols of fun
The latest portfolio index to emerge from CF Digital Asset Classification Structure maps the investible digital arts and entertainment world of today and tomorrow
What price digital culture?
What Price Culture?, asked economists David Throsby and Glenn Withers in an often-cited paper published in 1984.
Their subject was public arts funding, but in principle, the question echoes broadly across other spheres; transcending time and space to reach us in 2022, as we search for cogent valuations of the metaverse, and other digital asset categories.
Investors currently face a commercial iteration of the dilemma that began to emerge in earnest a few years ago.
Now, the exploitation of various forms of immersive virtualisation – a rough definition of ‘metaverse’ – is gathering pace.
Similar trends are discernible in the NFT market, as well as in other increasingly digitised forms of entertainment arts, including music and video games.
Additionally, these domains are sufficiently interleaved that the melding of each into the others has not just begun – it is now evolving.
Digital culture dilemma
Given that it’s difficult to determine the precise constitution and nature of digital arts and entertainment markets, ascertaining their size and scope for growth is also problematic.
Definite estimates require that frames of reference be limited to definable and quantifiable aspects of activities categorised under digital entertainment arts.
As we’ve seen over the last few years though, the space is moving too fast for this approach to produce sustainable estimates.
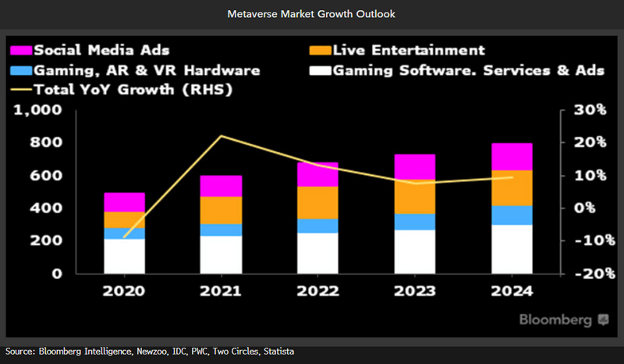
Still, in the interests of starting from somewhere, Bloomberg Intelligence analysts in December summarised the industry’s growth profile in the graphic below.
The $1 trillion answer
Around the same time, equity analysts at JPMorgan published a comprehensive appraisal of the “seamless convergence of our physical and digital lives”, though they cautioned that there is no “singular, all-encompassing definition”.
They estimated annual metaverse revenues, from a “market opportunity” perspective, as likely to be over $1 trillion.
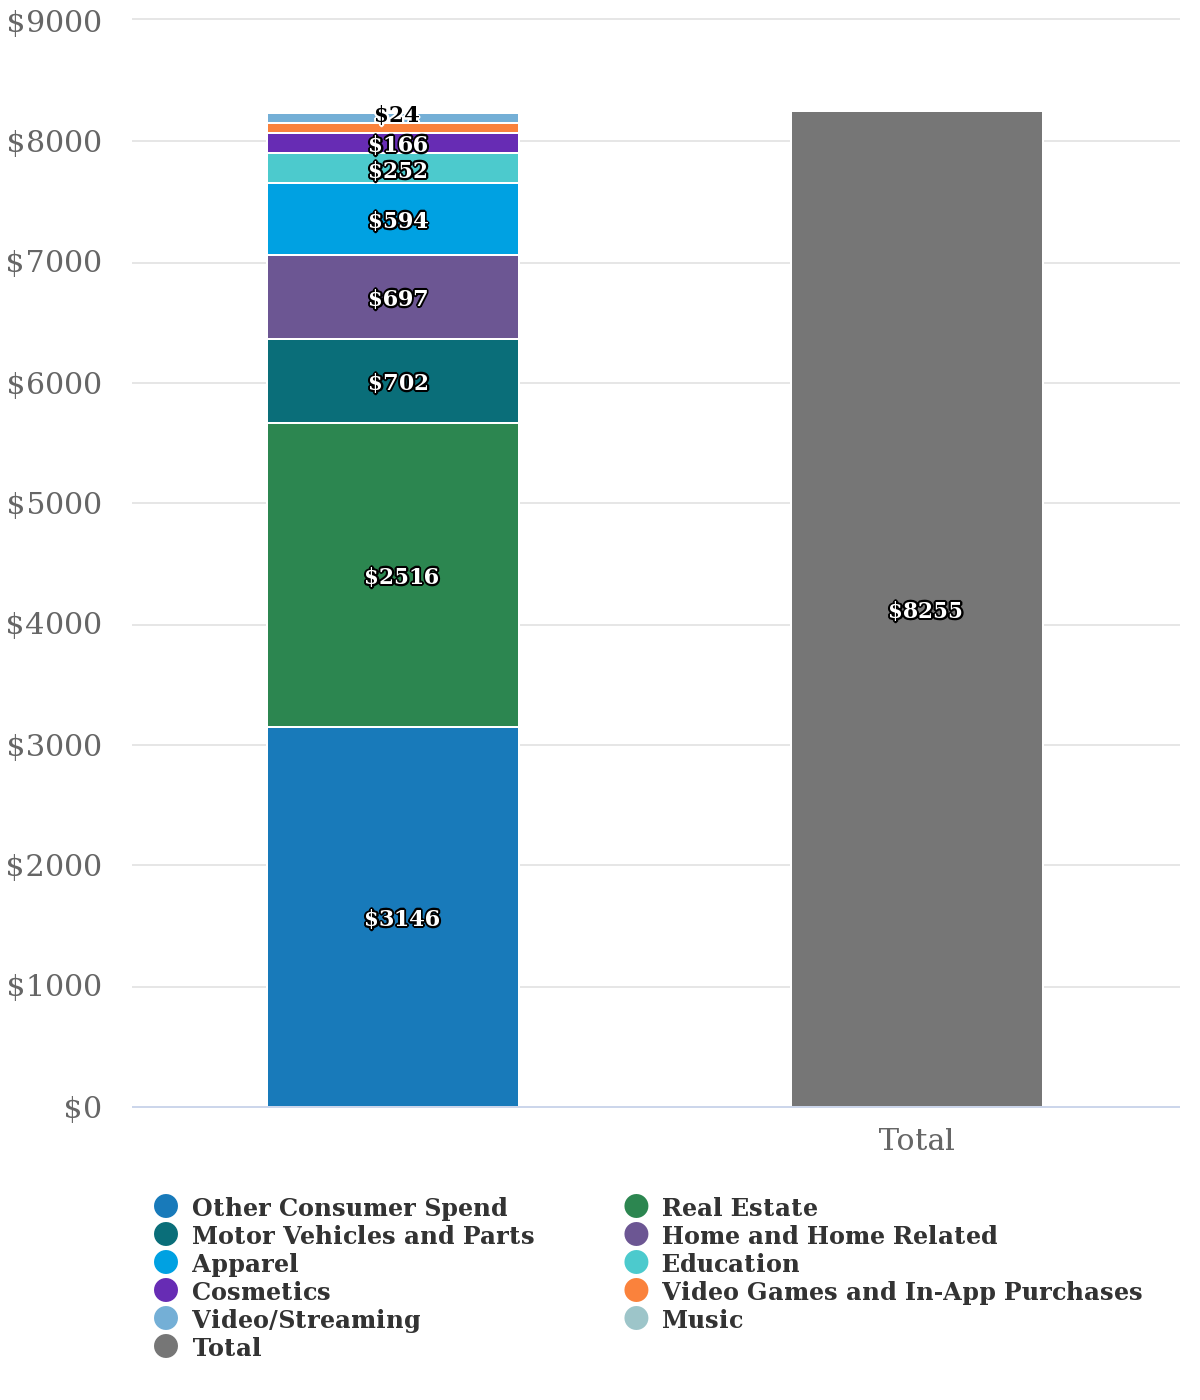
Meanwhile, Morgan Stanley’s assessment of the potential U.S. consumer expenditure total addressable market (TAM) of the metaverse, published in February, was $8.3 trillion, “depending on the level of disruption.” (See the graphic below).
One Metaverse, myriad forecasts
Note that these separate metaverse sector estimates appear to be based on differing market assumptions, with the corollary that variations on possible metaverse components have been considered across their forecasts.
It demonstrates the inconclusive nature of the space as it continues to develop, and the consequent indeterminate nature of its growth expectations.
Culture stocks
As for the metaverse’s equity market outlook, noise from public hype, followed by increased volatility amid recent geopolitical events adds more opacity.
Still, indications of actual or likely increased allocation to leading equities linked to this emerging sphere have been clear enough.
- Among the best-known ETFs, Roundhill Ball Metaverse ETF (META) launched in June, with assets growing to more than $800m by late November
- Lesser-known individual shares also caught the tailwind of Meta Platforms’ rebranding (which of course lifted FB shares as well):
- Shares of digitalisation services provider Matterport surged by 80%;
- Shares of AR/VR platform firm Glimpse, by 76%
Platform level
For the most direct reflection of growing public, market and institutional interest, however, we must look at the return performance of digital assets associated with protocols linked to metaverse, entertainment and other digitised cultural services.
- Decentraland’s MANA peaked at $5.47 in late November before tumbling sharply, having been worth less than 50 cents as recently as last June
- SAND token, the primary means of transacting within The Sandbox, another decentralised virtual game world platform, flashed 900% higher within a month to peak around the same time as its peer at $8.40, before reversing at a similar pace
- Axie Infinity became the best-known game of the play-to-earn model that emerged a few years ago, with hype on the platform cutting across several public spheres simultaneously, including crypto, institutional markets and video gamers. Its native AXS token touched $160 in early November, up from around $3.20 in June
- More broadly, with all key metaverse protocols and a large proportion of NFT tokens secured by the Ethereum network, it’s little surprise that ETH was the best performing large-cap crypto in 2021, closing the year with a price return of around 400% compared to Bitcoin’s advance of less than 60%.
How to win in the New Meta
At this point, the obvious question from our perspective, as the leading Benchmark Administrator in the digital assets space, is ‘how can regulated institutions begin to capitalise on the opportunities for outsize alpha at the platform level of culture and entertainment protocols, as developmental and adoption momentum accelerates?’
As recent readers of our blog may guess, our answer is going to be inextricably linked to our newly launched CF Digital Asset Classification Structure (CF DACS), a comprehensive framework for understanding and categorising the digital asset market, and thereby improving the portfolio selection process when investing in it.
Its development is among the first fruits of our efforts to broaden the public conceptual framework that ensures the replicability of our benchmarks, including by reducing information asymmetry.
The logical extension of the CF DACS is representation of its components through replicable and investible benchmark indices directly informed by the structure.
From DeFi, to Web 3.0, to Culture
The process of constructing these has already started:
- CF DeFi Composite Index was among the first, and it saw initial assets under reference last month, with the launch of Hashdex’s DEFI11, the world’s first pure-play DeFi ETF
- CF Web 3.0 Smart Contract Platforms Index, which captures returns of eligible protocols under the Settlement category and Programmable sub-category of CF DACS, followed soon afterwards
The sequence now continues, with the formation of CF Digital Culture Composite Index.
It is the investible benchmark of protocols categorised under the Culture sub-category of the Sectors CF DACS segment.
Remember, it is the Culture sub-category that captures “the return performance of protocols involved in the digitization and tokenization of cultural experiences and artefacts including the Metaverse, NFTs, Gaming, and Music”.
Micro version
Further key CF Digital Culture Composite Index details are below:
(Note, complete specifications and other information can be found on the CF Digital Culture Composite Index page.)
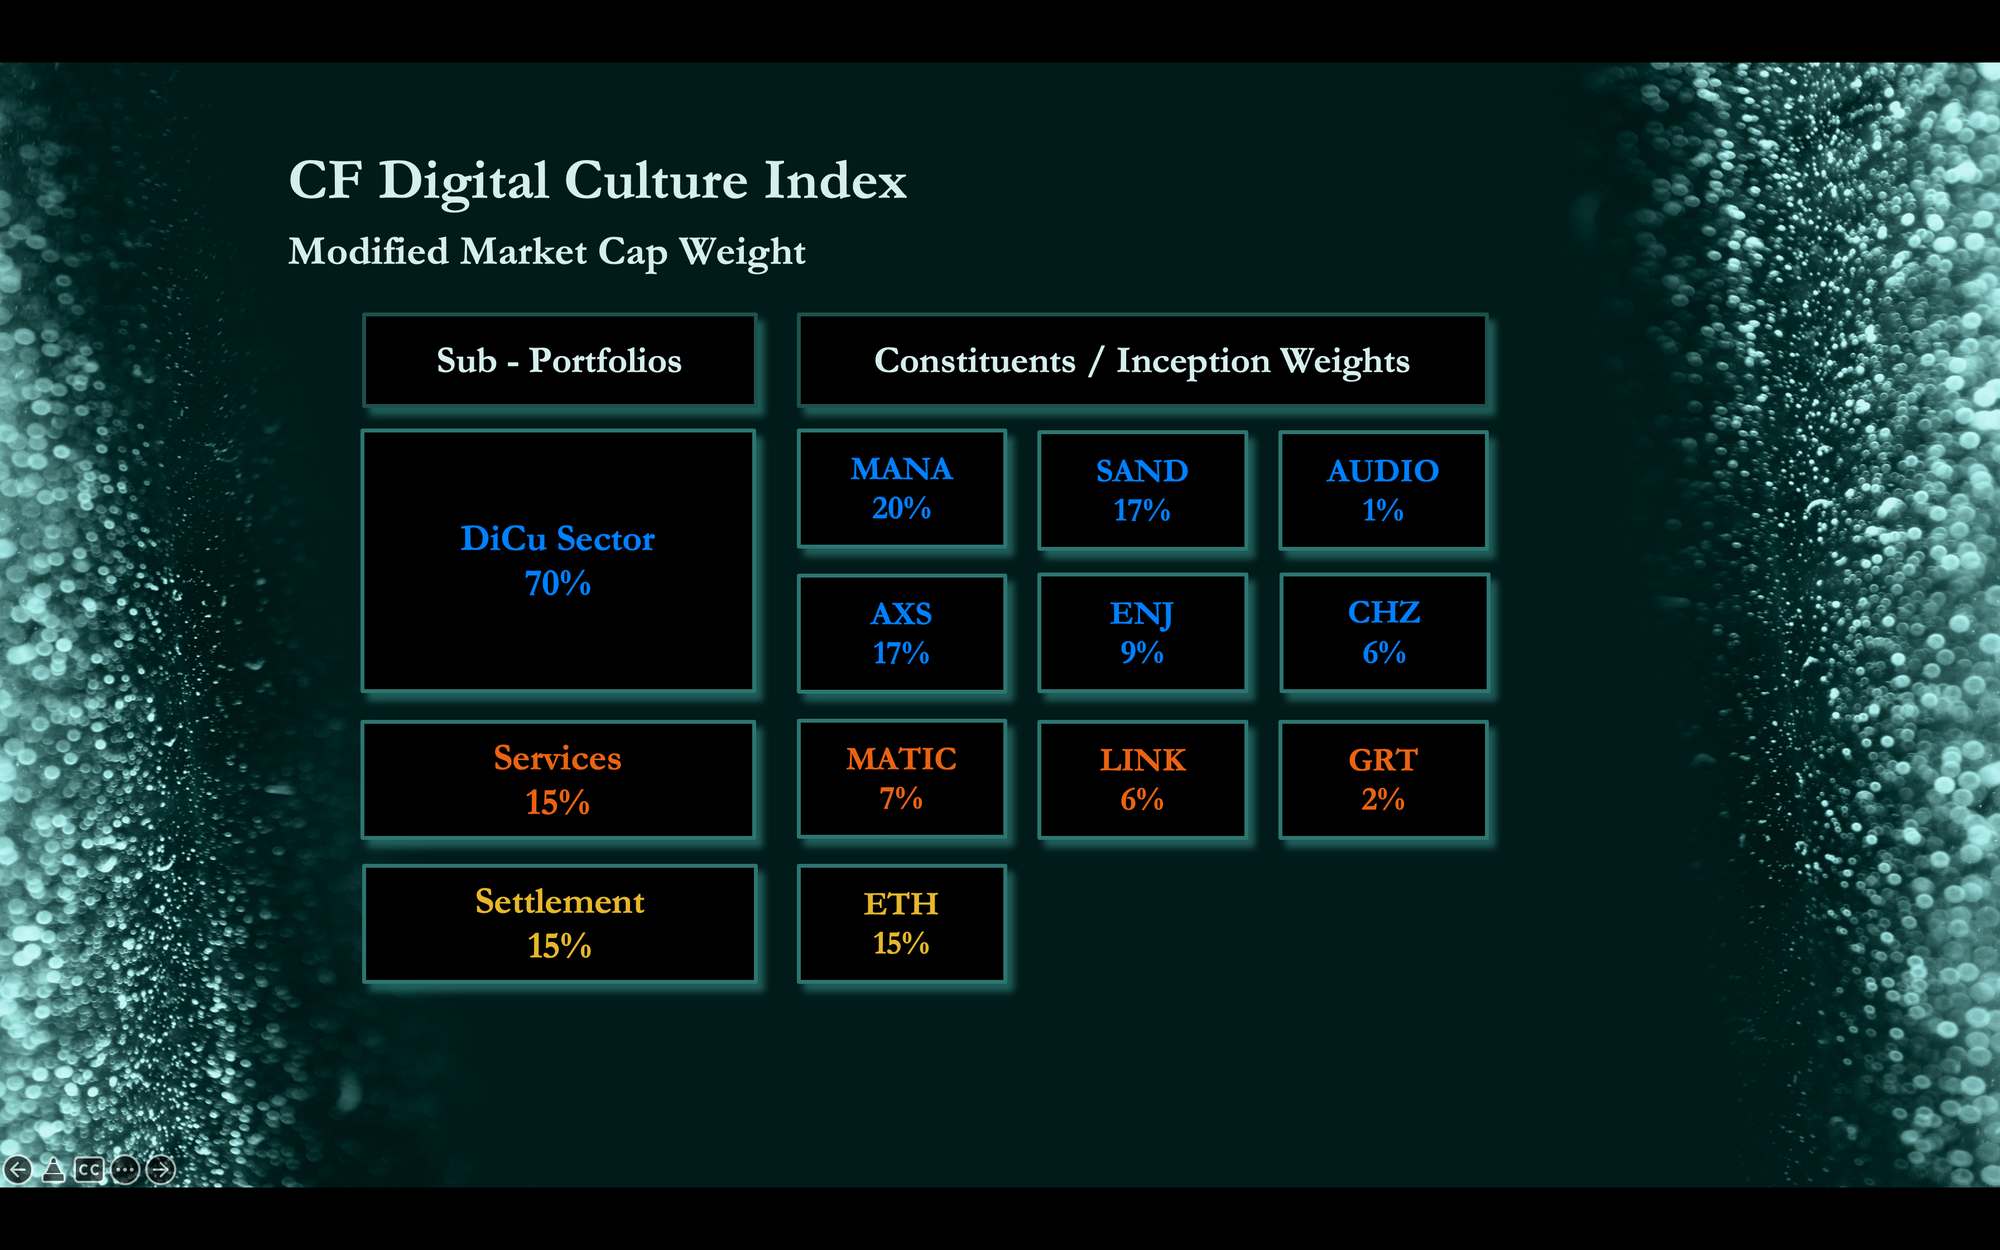
The index is comprised of three distinct sub-portfolios of fixed weight, representing the blockchain architecture components required to deliver digitised culture:
- Digital Culture Applications (DApps)
- Services
- Settlement Blockchains
The digital assets are classified in accordance with the CF Digital Asset Classification Structure (CF DACS) for sub-portfolio eligibility
The assets are weighted by free float market capitalisation within each sub-portfolio, in accordance with the CF Digital Asset Series Ground Rules and the index methodology
The current meta
Current CF Digital Culture Composite Index constituents, together with their ticker symbols are shown below.
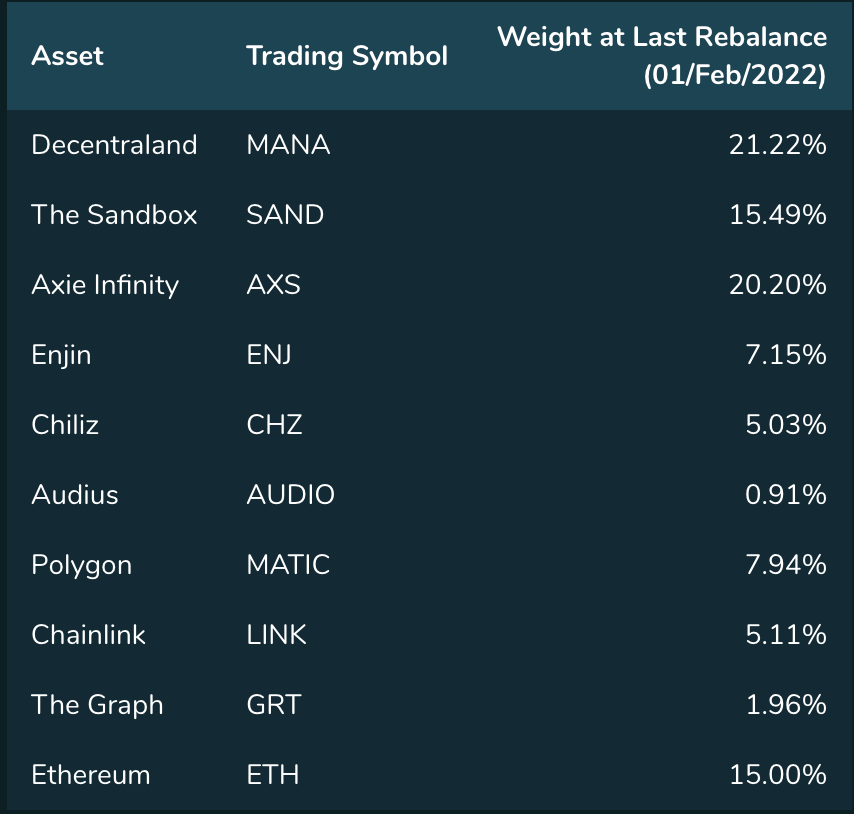
Weightings of the index’s three sub-portfolios and of constituents at inception were as follows:
The Future’s now
The formation of CF Digital Culture Composite Index means that for the first time, institutional participants seeking to capture alpha from material present and promising future opportunities in the Metaverse, NFTs, video games and digitalised music consumption, can now do so via a secure, replicable, methodology devised by a regulated Benchmark Administrator.
Furthermore, institutions can participate in markets for such protocols with the assurance that both CF DACS, and the CF Digital Culture Composite Index have been built from the ground up to adapt to new protocol activities that may emerge in future.
Combining CF Benchmarks’ typical safeguards of integrity and transparency (as engendered by Benchmark Regulation) with our track record of robust, reliable crypto indices, and CF Digital Culture Composite Index’s adaptive evolvability by design, it becomes the most credible gateway for investing in the emerging digital asset universe at the level of its authentic infrastructure.
Visit the CF Digital Culture Composite Index homepage
Understand CF Digital Asset Classification Structure in minutes
Click below to watch the CF DACS video:
The information contained within is for educational and informational purposes ONLY. It is not intended nor should it be considered an invitation or inducement to buy or sell any of the underlying instruments cited including but not limited to cryptoassets, financial instruments or any instruments that reference any index provided by CF Benchmarks Ltd. This communication is not intended to persuade or incite you to buy or sell security or securities noted within. Any commentary provided is the opinion of the author and should not be considered a personalised recommendation. Please contact your financial adviser or professional before making an investment decision.
Note: Some of the underlying instruments cited within this material may be restricted to certain customer categories in certain jurisdictions.
Digital Assets Absorb Hawkish Repricing Ahead of the FOMC
Digital assets traded through a hawkish macro surprise this week but closed mostly higher, with breadth holding across major names and indices. Sector leadership traced to a single regulatory catalyst, not a broad rotation, and implied volatility stayed firmer than realized into the weekend.

Mark Pilipczuk
Factor Friday - July 24, 2026
Beta's four-week grind higher stalled this week as style leadership rotated again: Momentum took the top spot, last week's leader Value fell to the bottom, and Growth stayed July's weakest factor. Size remains the only style factor positive on the year; beta, not style selection, is setting returns.
Mark Pilipczuk
Changes to the Token Market Price Benchmarks Series - Market Prices – 21 July 2026
The Administrator has confirmed changes to the Token Market Price Family for the period 14 July 2026 to 21 July 2026.
CF Benchmarks
By clicking Accept, you consent to CF Benchmarks's use of cookies.
Visit Cookie Settings to learn how CF Benchmarks uses cookies and to adjust your preferences.