
Nov 02, 2022
CF Benchmarks Recap - Issue 51
Life above $20k
Institutional digital asset adoption still rising• Increasing regulatory clarity helps • What’s behind dwindling crypto volatility?
It doesn’t take much. CME CF Bitcoin Reference Rate (BRR) (the most liquid institutional bitcoin price) recently breaking above $20k for the first time in six weeks stoked a bout of moderate celebration on ‘crypto Twitter’ and beyond. If little else, the outbreak of 'hopium' helps underline the drop off in market activity we’ve seen of late. More to the point, the collapse in volatility (weighing on futures volumes) and a lull in banner digital asset news has also enabled more attention on less directly relevant developments. (Get our institutionally focused markets update below.) Chiefly, the crypto aspirations of the quixotic Elon Musk continue to outweigh concrete outcomes, but completion of his controversial Twitter acquisition (assisted by Binance among—reportedly—several other corporates) unleashed the latest bout of speculation over potential crypto verticalization at the social network. (Bloomberg's take).
Crypto adoption increases, pace moderates
More substantially, Fidelity Digital Assets’ fourth annual survey of institutional investors’ stances, intentions and involvements, although offering increasingly moot points about the broad direction of travel, still showed affirmatory increases in adoption, “despite market headwinds”. The 9- and 11-percentage point increases in adoption to respectively 42% in the U.S. and 67% in Europe, during the January-to-June 2022 survey period contrast with Asia, where the rise was less emphatic. It’s the region with the highest existing “adoption and [positive] perception” of digital assets, which puts the 3-point downtick to 60%, in context. Crypto purchase intentions were more mixed across investor categories than in 2021’s survey. 38% of traditional hedge funds indicated they’d make medium-term digital asset investments, down from 56%. Endowment, pension and family office intents were flat. Crypto native hedgers and VCs were just slightly higher. Despite all that though, aggregate survey intent rose to 74% from 71% in 2021. (Download FDA's summary here.)
Clearer regs a plus, say investors
Meanwhile, complementary results from a poll by Bloomberg answer a key question that wasn’t posed directly to FDA respondents. Almost 60% of 564 participants in Bloomberg’s weekly MLIV survey indicated they’d veer to cryptoassets faster in the wake of a tacit bout of scrutiny of the industry by U.S. regulators, chiefly the SEC. Perhaps unsurprisingly, the list of such actions is growing, including probes of failed firms like 3AC and Celsius, as well as more exploratory investigations, like whether Bored Apes creator Yuga Labs’ ApeCoin and certain NFTs are unregistered securities.
Washington, industry square off
The counterpoint is a small spate of legal challenges to perceived overreach by Washington. See Coinbase joining non-profit Coin Center’s suit against the U.S. Treasury Department, over the sanctioning of crypto mixer Tornado Cash. Also, Grayscale recently filing opening and Amicus briefs in its suit vs. the SEC, alleging “flawed” and “inconsistently applied” logic in the commission’s rejection of Grayscale’s application to convert Grayscale Bitcoin Trust into an ETF. The key takeaway from legal battlelines being drawn is increasing engagement between industry and the official sector - which, ultimately, should be positive. As Bloomberg’s respondents suggest, institutional adoption should accelerate with increased regulatory clarity and certified integrity.
Markets: Meme coin surges as volatility ebbs
In markets the Twitter theme was also inescapable as Elon Musk’s pet digital asset, Dogecoin, duly outperformed on confirmation that the social network had changed hands. CF Dogecoin-Dollar Spot Rate, the only regulated real-time price of the principal ‘meme coin’, soared to a suitably frothy gain of well over 100% in a week. More broadly a choppy but ultimately accretive week for risky assets inevitably played favourably for crypto, enabling BTC, ETH and other large caps to tack on gains. Not quite ‘Uptober’ (because crypto needs more annoying buzzwords) after a year-long cross-asset bonfire of the values, but at least Bitcoin and Ether posted their first monthly advance since July.
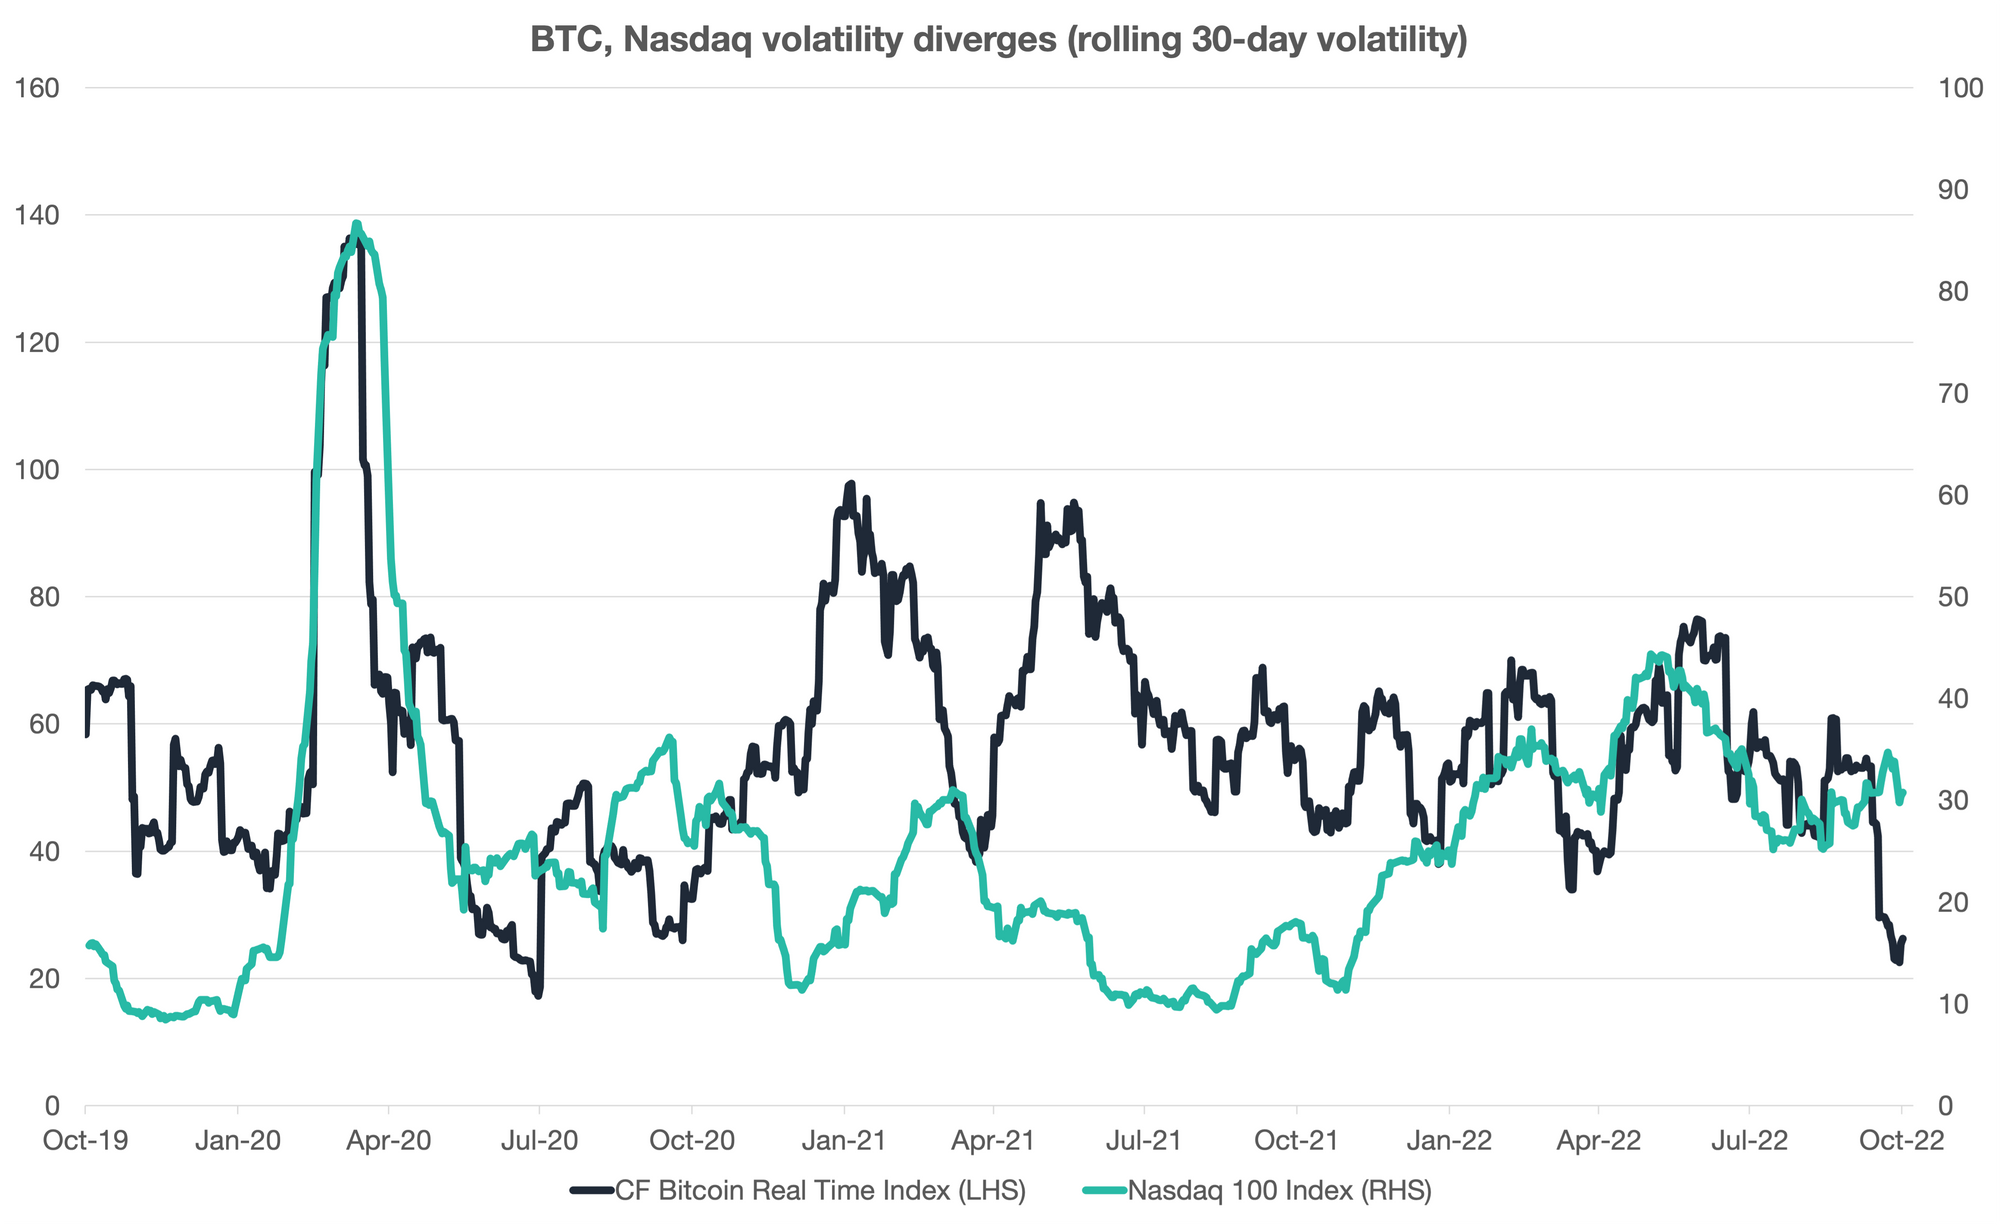
Bitcoin volatility eases while Nasdaq’s ramps
As well as continuing to creep higher in recent days, Bitcoin is also definitively holding above $20K for the first time since mid-September, with CME CF Bitcoin Realtime Index (BRTI) depicting constructive and unusually benign price action. Meanwhile, BRTI’s 30-day rolling volatility is approaching its lowest levels since June of 2020. Since the beginning of October, bitcoin price variance has halved, falling to approximately 27% from just over 60%. By contrast, Nasdaq 100 index volatility has been steadily increasing, rising to just over 33% from 25%.
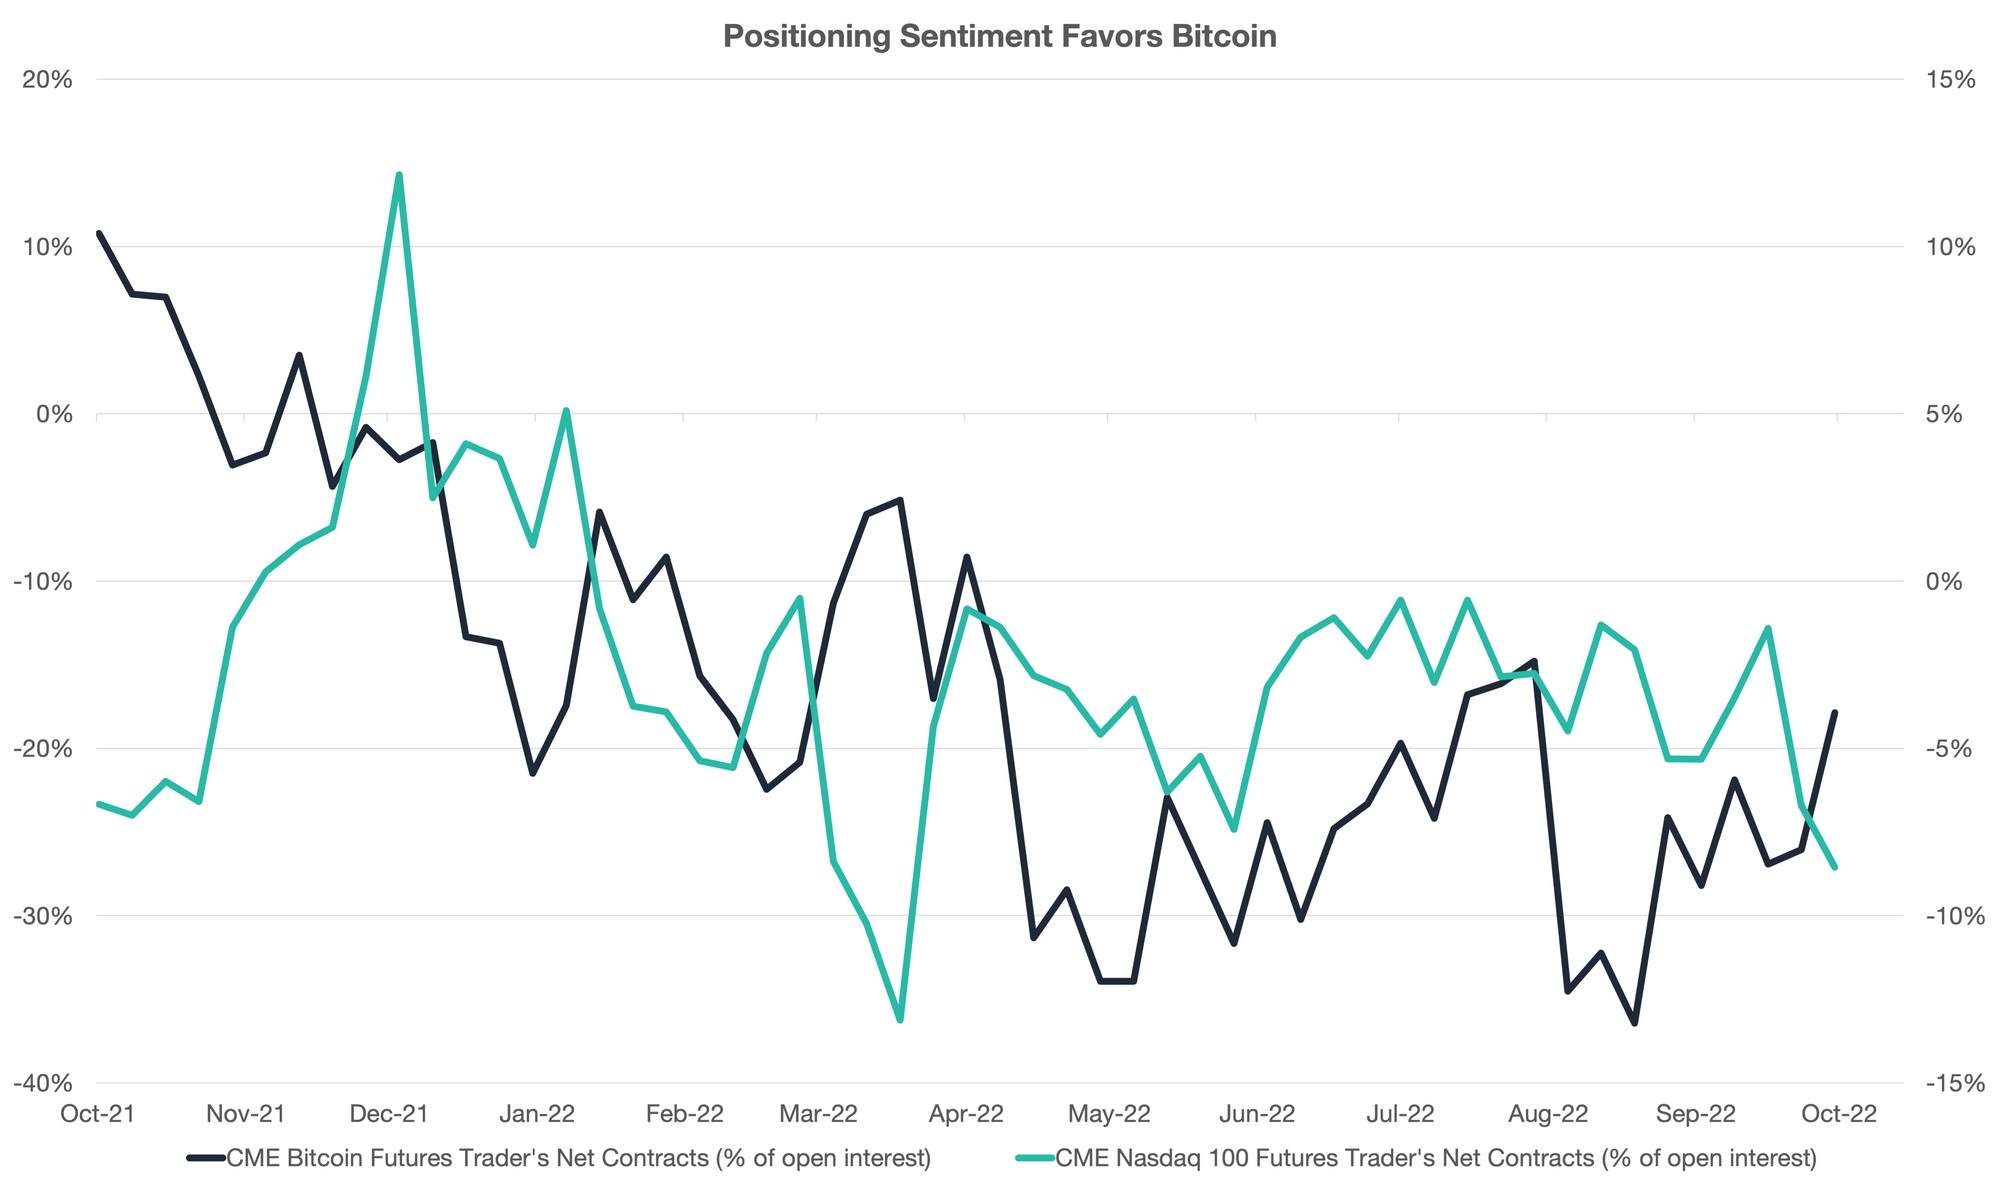
BTC sentiment diverges vs. Nasdaq
The exact catalyst isn’t easy to determine. Certainly, continued increases in rates and the U.S. dollar, both negatively correlated to the bitcoin price, would normally be expected to keep crypto off balance. Perhaps speculative positioning holds clues. The CFTC’s weekly Commitment of Traders (CoT) report revealed a similar divergence trend. As shown below, net positioning in CME Bitcoin Futures has begun to trend positive whilst Nasdaq positions are pointing to increasingly bearish expectations, despite a more positive turn in cash equity indices of late. Bitcoin’s ‘store of value’ thesis—said to be particularly applicable during times of market duress—wins moderate additional credence, with the largest rise in bullish positioning coinciding with the shake up in sterling and Gilt markets a short while back.
Macro Outlook
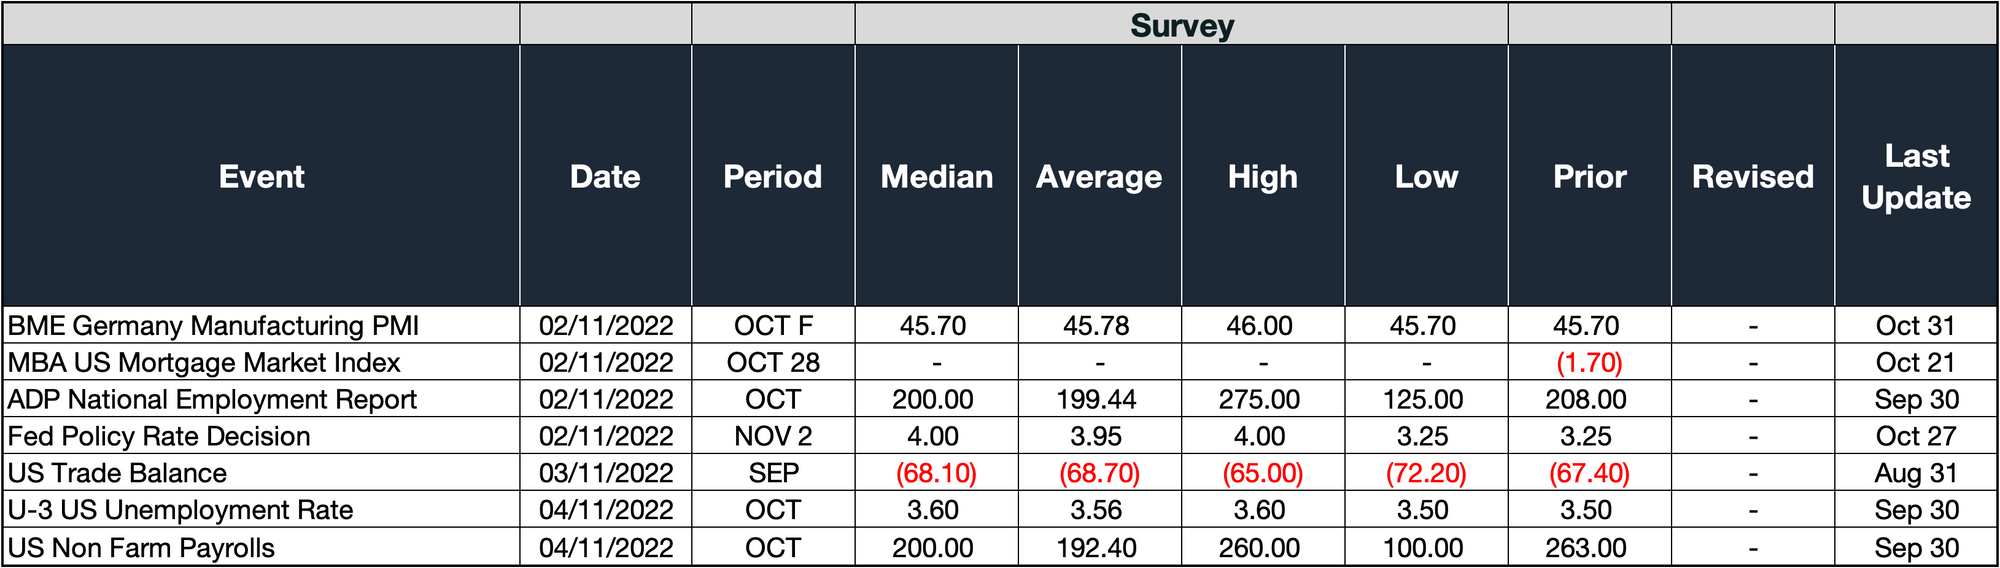
The latest policy rate decision by the Fed should take centre stage, along with the most recent Non-farm Payrolls data. Markets are fully anticipating that the central bank is poised to increase its target by another 75 bps. However, the degree of change for the December meeting remains in question. Crypto investors will be keen to find out if the latest payrolls data will embolden or deter another super-sized hike for the year-end meeting. If we continue to see upside surprises in jobs growth, then the Fed's inflation-fighting campaign will be far from over.
Featured utility: CF Digital Asset Classification Structure
VIDEO: Animations bring our Quarterly Attribution Analyses to life
Our recently launched Quarterly Attribution Analyses series, utilising the CF Digital Asset Classification Structure (CF DACS) as the framework for returns analysis of CF Benchmarks portfolio indices, is the first set of institutional-standard attribution reports for the digital asset class that most readers are likely to have seen.
Together with the reports themselves, we also produced short animations to better enable visualisation of return trends through the previous quarter, and as an additional aid to understanding how and why CF DACS works.
These animations are expected to become a regular feature for each set of Quarterly Attribution Analyses. As such, we believe it’s well worth providing readers who may have missed the first set of animations with another opportunity to access them in one place.
To watch each animation, simply click on one of the thumbnails below.
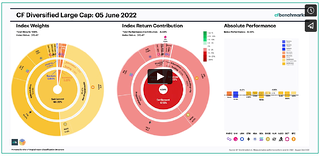
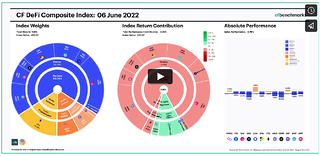
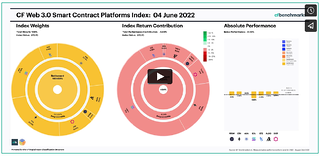
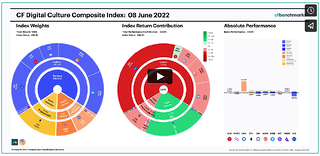
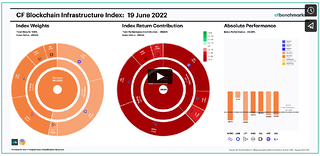
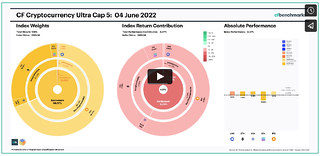
The animations represent investment returns of our digital asset portfolio indices, depicted in terms of CF DACS categories and sub-categories.
Each animation thereby provides instant insights into the market and blockchain protocol trends driving the performance of the respective index during the previous quarter.
Additional Resources
The definitive introductory article to the only comprehensive cryptoasset classification structure published by a regulated Benchmark Administrator
All the tools you’ll need to understand CF DACS fast
The information contained within is for educational and informational purposes ONLY. It is not intended nor should it be considered an invitation or inducement to buy or sell any of the underlying instruments cited including but not limited to cryptoassets, financial instruments or any instruments that reference any index provided by CF Benchmarks Ltd. This communication is not intended to persuade or incite you to buy or sell security or securities noted within. Any commentary provided is the opinion of the author and should not be considered a personalised recommendation. Please contact your financial adviser or professional before making an investment decision.
Note: Some of the underlying instruments cited within this material may be restricted to certain customer categories in certain jurisdictions.
Digital Assets Absorb Hawkish Repricing Ahead of the FOMC
Digital assets traded through a hawkish macro surprise this week but closed mostly higher, with breadth holding across major names and indices. Sector leadership traced to a single regulatory catalyst, not a broad rotation, and implied volatility stayed firmer than realized into the weekend.

Mark Pilipczuk
Factor Friday - July 24, 2026
Beta's four-week grind higher stalled this week as style leadership rotated again: Momentum took the top spot, last week's leader Value fell to the bottom, and Growth stayed July's weakest factor. Size remains the only style factor positive on the year; beta, not style selection, is setting returns.
Mark Pilipczuk
Changes to the Token Market Price Benchmarks Series - Market Prices – 21 July 2026
The Administrator has confirmed changes to the Token Market Price Family for the period 14 July 2026 to 21 July 2026.
CF Benchmarks
By clicking Accept, you consent to CF Benchmarks's use of cookies.
Visit Cookie Settings to learn how CF Benchmarks uses cookies and to adjust your preferences.