
Jun 10, 2025
CF Benchmarks Quarterly Attribution Reports - June 2025

Navigating the Tariff Route on the Macro Road to Recovery
The most recent rebalance period remained centered on macro-driven volatility, with crypto markets getting whipsawed between escalating trade tensions and constructive policy frameworks. What began as a broad-based risk-off environment ultimately evolved into a more discriminating institutional rotation, highlighting important structural shifts in digital asset capital flows. The period's initial tariff-driven selloff exposed the sector's continued sensitivity to stagflation concerns, with Bitcoin ETFs hemorrhaging over $1.5 billion in sustained outflows as investors fled risk assets amid escalating trade tensions. The Federal Reserve's dovish pivot—holding rates steady while revising growth forecasts downward and inflation expectations upward—amplified volatility across digital assets. During this phase, we observed a pronounced flight-to-quality dynamic, with large-cap protocols significantly outperforming sector-specific exposures as DeFi and Digital Culture segments faced substantial pressure.
April's policy recalibration following Trump's Liberation Day tariff announcements initially spooked traditional markets into brief bear territory. However, Bitcoin's remarkable surge and accompanying robust ETF inflow reversal demonstrated the asset's emerging utility as a policy uncertainty hedge. This divergence from broader risk asset behavior marked a critical inflection point in institutional positioning. The period's final phase saw momentum culminate in Bitcoin's ascent through key psychological levels, marking new all-time highs underpinned by robust spot ETF accumulation led by BlackRock's IBIT. The launch of CME's regulated Solana and XRP futures expanded institutional access channels, while temporary tariff reductions with China and passage of the House tax-and-spend bill created a more constructive backdrop for digital assets. The fiscal implications of the expansionary legislation brought sustainability concerns to the forefront of investor consciousness, inadvertently reinforcing Bitcoin's appeal as a hedge against currency debasement and deficit-driven monetary accommodation.
Key takeaways:
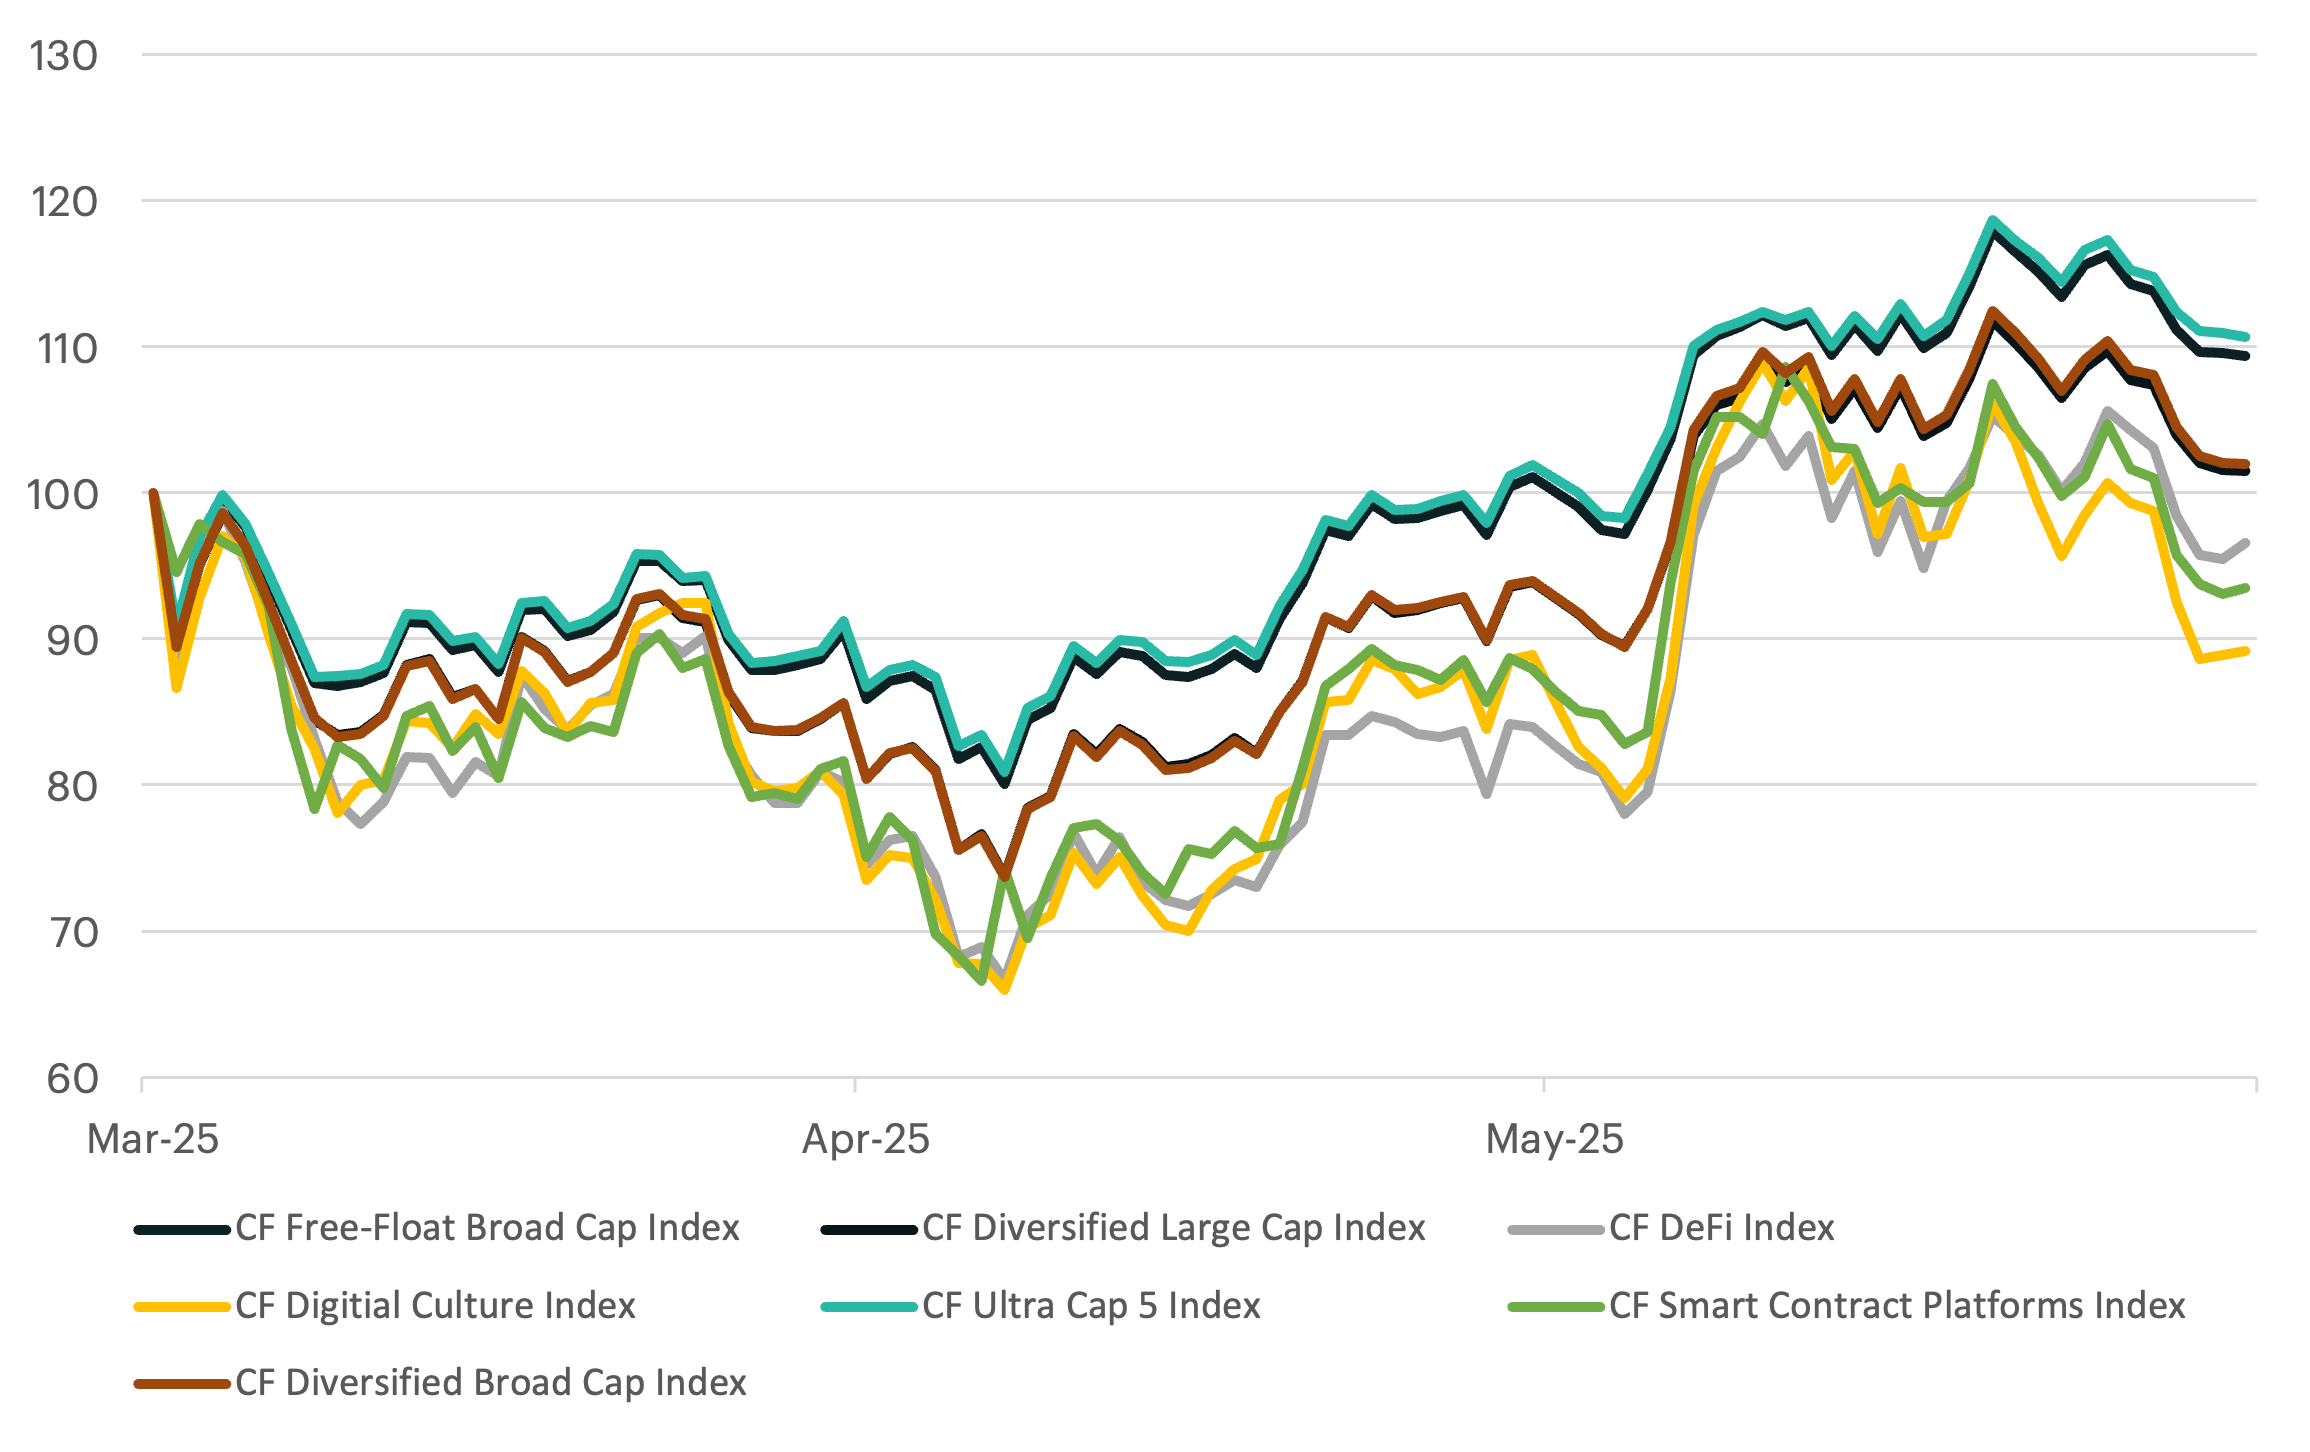
Digital Assets See Mixed Performance
- This convergence of macroeconomic uncertainty and regulatory tailwinds has moderated market momentum, positioning investors at a strategic inflection point that ultimately translated into subdued price performance across digital assets.
- The CF Digital Culture Index declined 10.81% and the CF Smart Contract Platforms Index fell 10.47%, marking the steepest drops among the indices. The CF DeFi Index declined a more modest 3.44% .
- The CF Diversified Large Cap Index posted a modest gain og 0.74%, while broader market measures gained greater traction with the CF Free-Float Broad Cap Index rising 9.32% and the CF Ultra Cap 5 Index rallying 10.69%. This performance pattern underscores how smaller-cap and sector-specific strategies underperformed as large-cap assets rallied.
Normalized Index Performance
Macro Headwinds Create Alpha Pockets
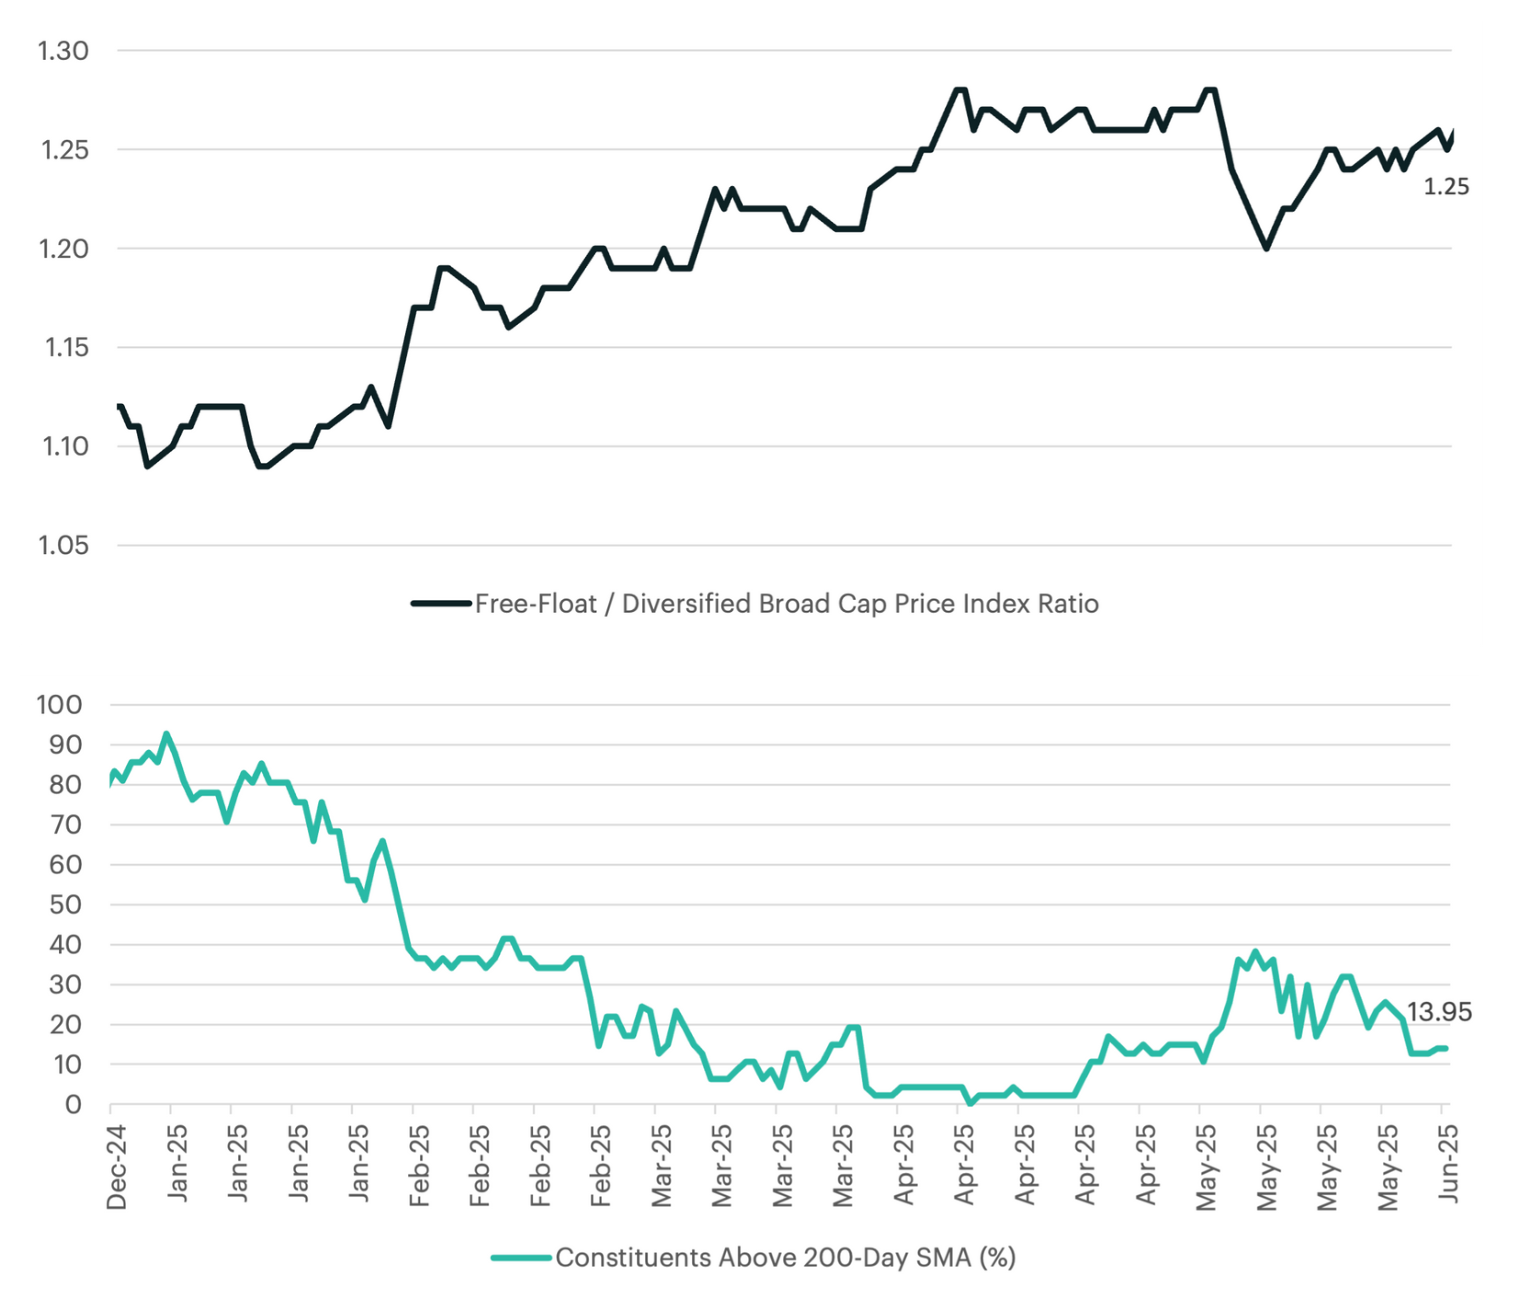
The CF Free-Float Broad Cap Index has retraced much of its prior drawdown, now trading just 10.00% below all-time highs following a strong recovery from the tariff-induced selloff. In contrast, the CF Broad Cap Diversified Index remains near the 20.00% drawdown threshold, reflecting a more subdued rebound across mid- and small-cap constituents. The price ratio between the two indices currently stands at 1.25, near the upper end of its historical range, indicating gains have been concentrated in the largest, most heavily weighted tokens.
This concentration is evident in the leadership of Bitcoin and Ether, which dominate the free-float index and have driven most of the recent strength. However, breadth remains thin: only 13.95% of index constituents are trading above their 200-day simple moving averages, while an equal-weighted view shows a -5.10% return over the period, suggesting most tokens remain under significant pressure.
Looking ahead, this lack of broad participation could signal market exhaustion and set the stage for further consolidation or alternatively, serve as a foundation for leadership rotation into the broader market as confidence in select narratives deepens.
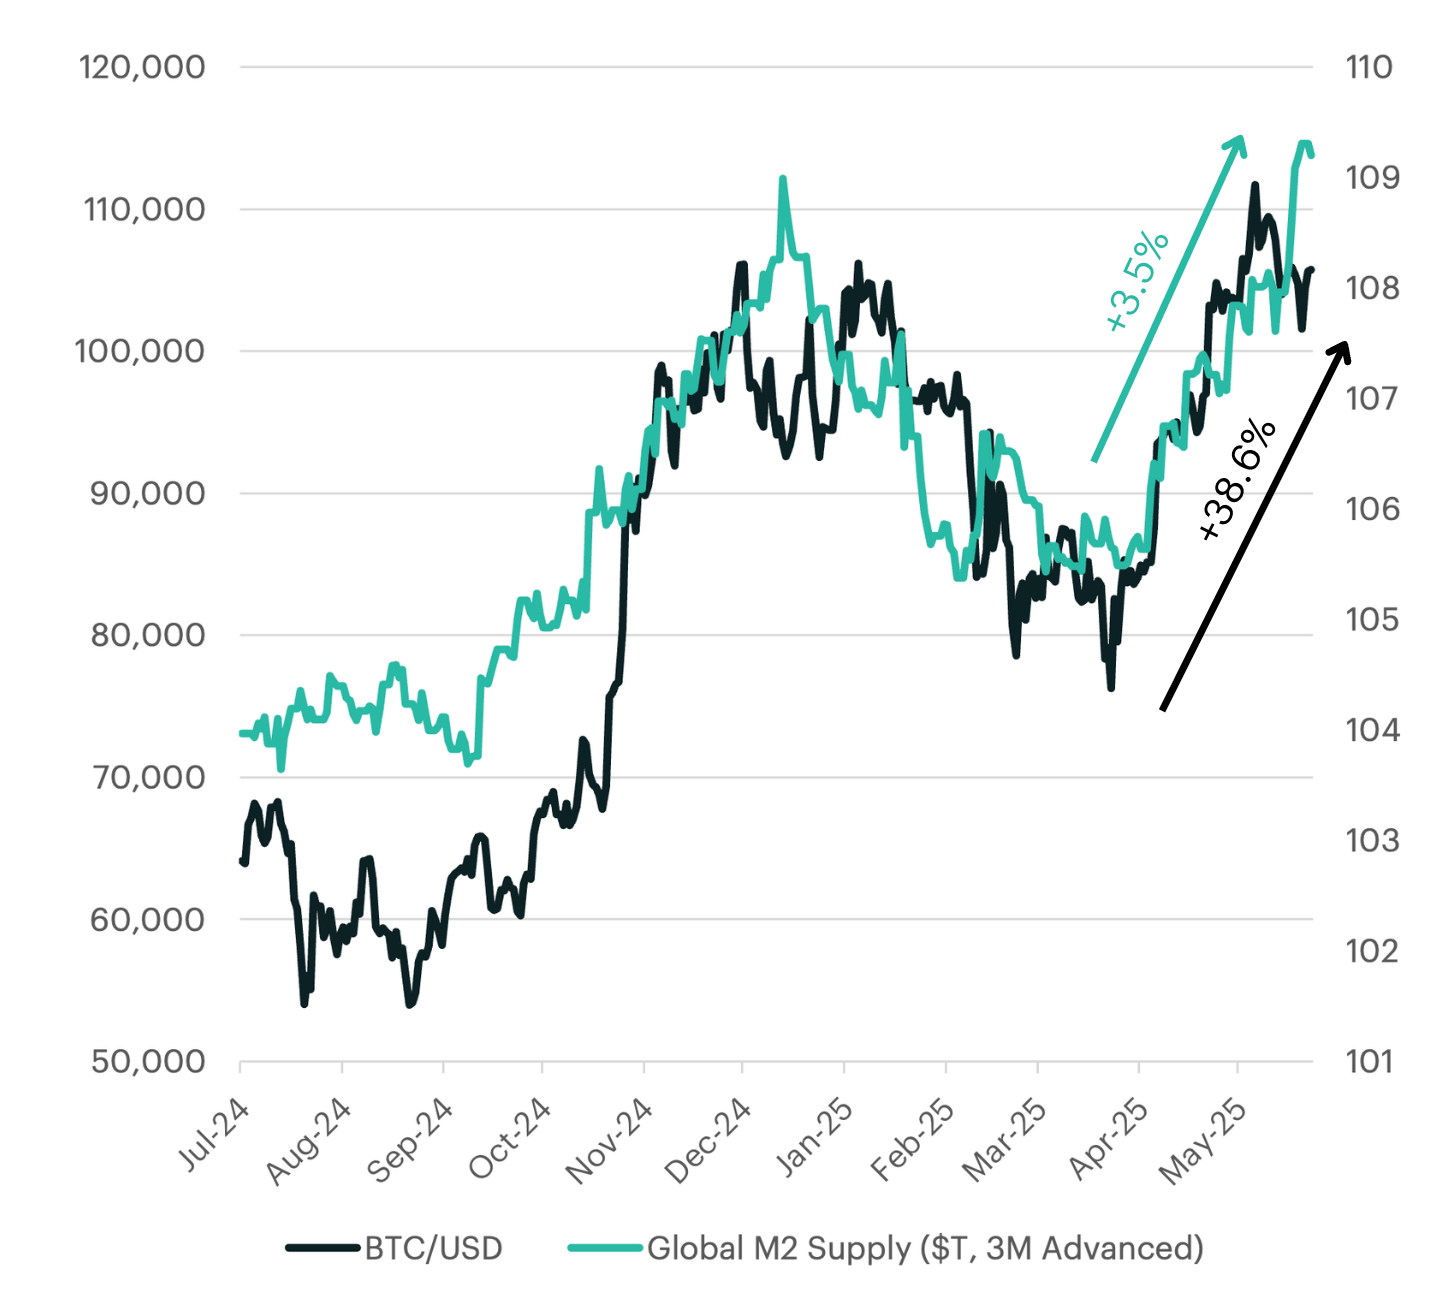
Bitcoin Rebounds as Global Liquidity Accelerates
As we highlighted in our prior Attribution report and Q2 Outlook, Bitcoin's relationship to global liquidity dynamics and fiat currency debasement via M2 money supply continues to be a defining feature of its performance. With a weighting of over 70% in the CF Ultra Cap 5 Index, directional moves in Bitcoin have an outsized impact on the broader index. The macro narrative we outlined, centered on Bitcoin's sensitivity to shifts in global liquidity, has unfolded largely as expected, reinforcing the importance of monitoring leading indicators like global M2.
A key dynamic underpinning Bitcoin's long-term appreciation has been its relationship with global liquidity conditions, specifically the global M2 money supply, which serves as a leading indicator of risk appetite. This relationship remains intact. The latest data shows Bitcoin has climbed 38.6% from its April lows, tracking closely with a 3.5% rise in global M2 over the same period (3-month advanced basis).
This recovery has coincided with a broader shift in risk sentiment. Following the sharp pullback driven by "Liberation Day" tariff uncertainty, digital assets sold off broadly. However, as trade tensions eased and tariff delays were announced, Bitcoin rebounded sharply, mirroring the upturn in liquidity. The reacceleration in global M2 provides a potential tailwind, and Bitcoin's sensitivity to these shifts continues to make it a bellwether for broader digital asset performance.
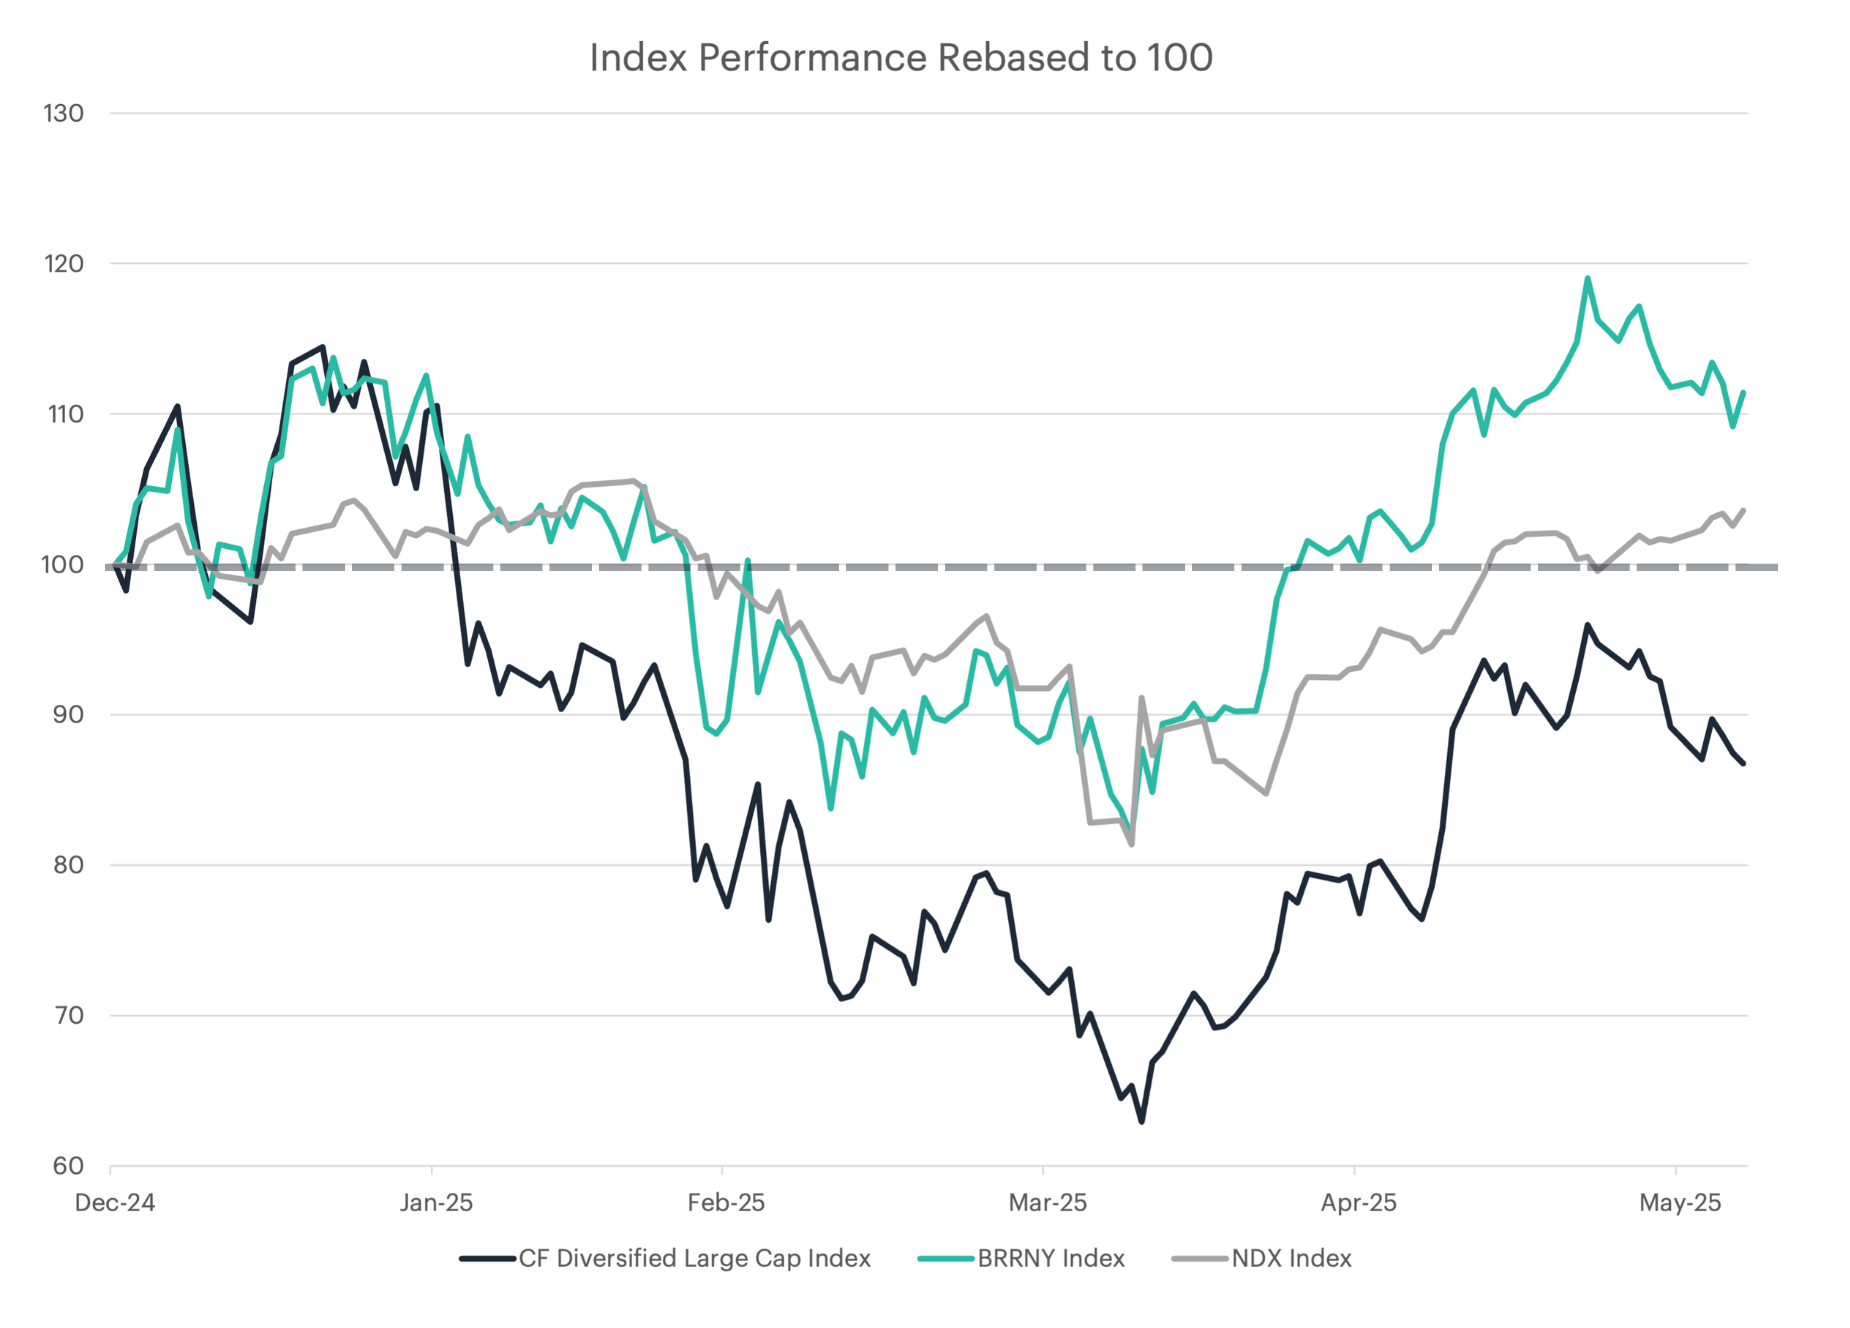
Bitcoin Soars as Altcoins Stumble
Year-to-date performance in large-cap crypto has exhibited stark concentration risk, with Bitcoin and Ether capturing majority capital flows while other token performance remains stagnant. Bitcoin, tracked by the BRRNY Index, has delivered 10.40% returns YTD and achieved fresh all-time highs through institutional ETF adoption. Ether has similarly benefited from rising institutional open interest. Yet this strength masks underlying weakness: the CF Diversified Large Cap Index sits 11.70% lower YTD, signaling a lack of momentum in altcoin recovery.
This contrasts sharply with U.S. tech equities, where the Nasdaq 100's 3.60% YTD gain reflects broader participation across its constituents. The performance gap between crypto's mega-caps and mid-tier assets has created a compelling risk-reward setup. Opportunities may lie in quality altcoins with robust fundamentals, active developer ecosystems, and growing institutional positioning. The current dislocation may reward patient capital if market breadth normalizes and rotational flows extend beyond Bitcoin-Ether dominance. For portfolios seeking asymmetric exposure, this divergence represents a potentially attractive entry point into relatively underperforming segments.
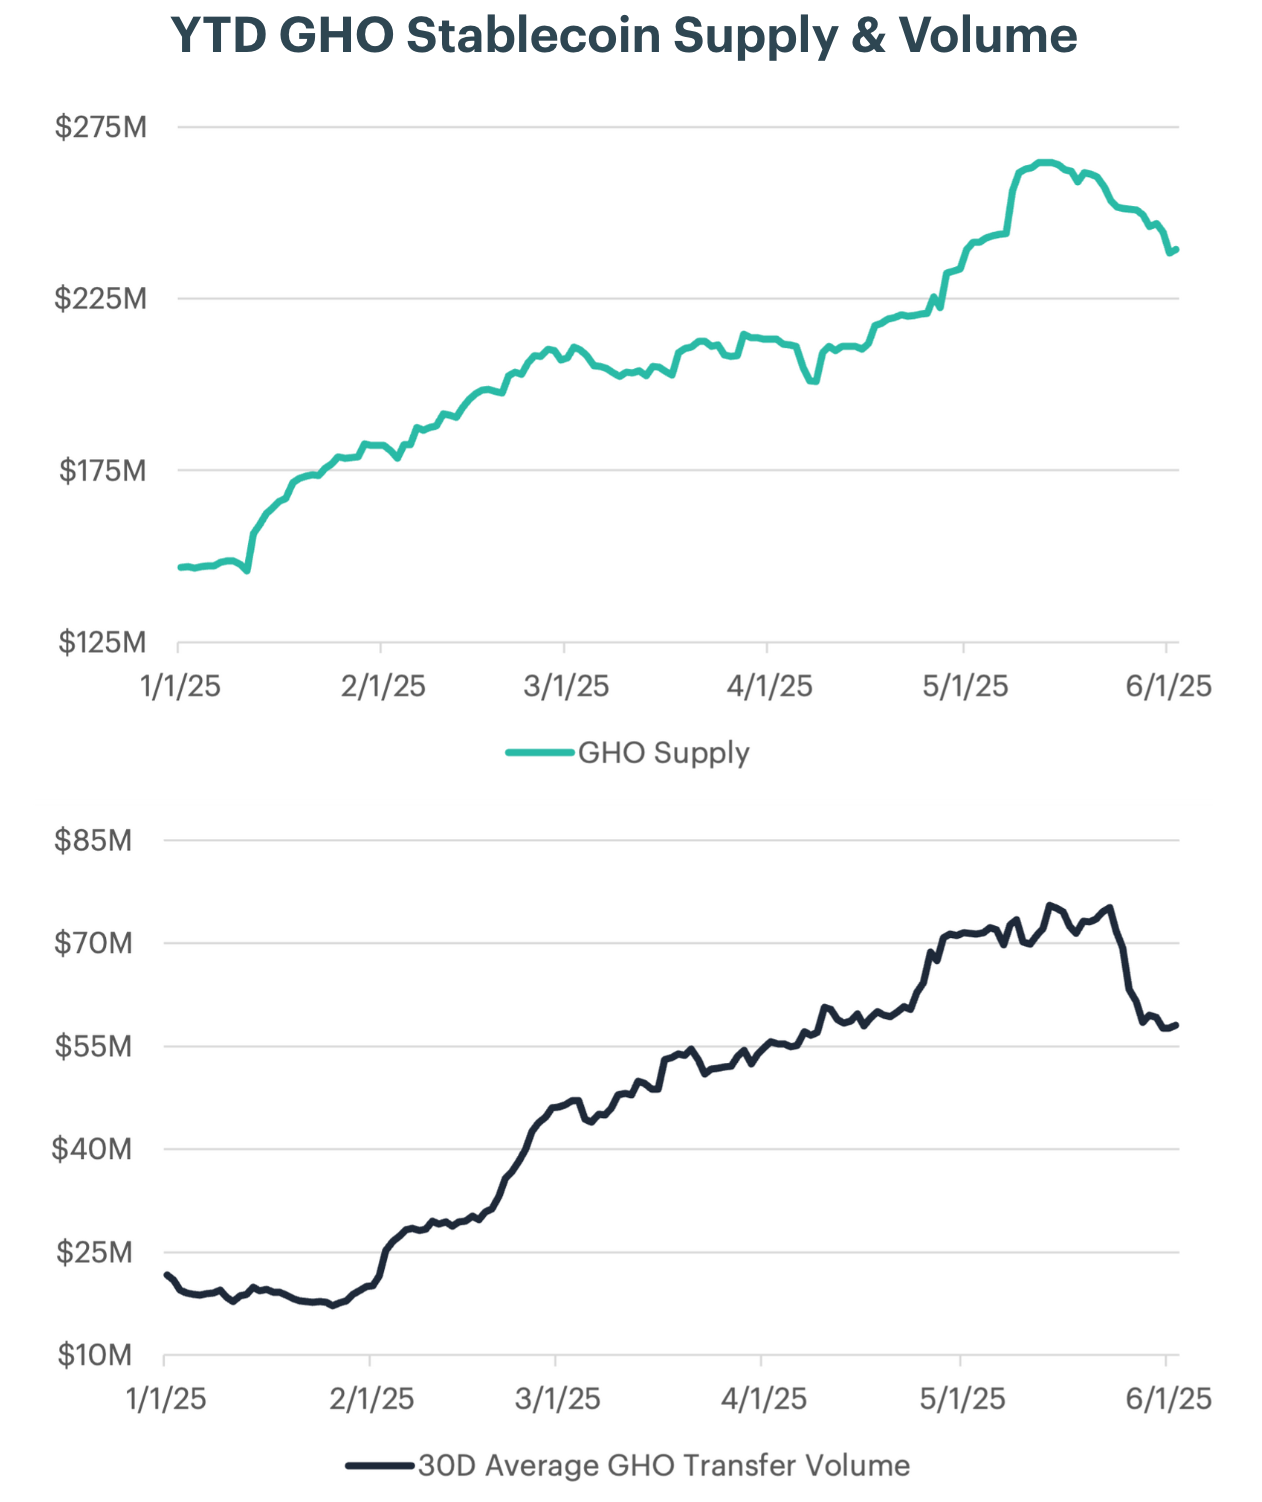
AAVE Strengthens on Stablecoin Adoption
The rapid expansion of Aave’s native GHO stablecoin, along with growing investor demand for stablecoin exposure, has likely served as a tailwind for AAVE’s price. In 2025, GHO’s circulating supply rose from approximately $146 million in early January to nearly $250 million by May, while its 30-day average transfer volume nearly tripled. Since all interest payments from GHO borrowing flow directly to the Aave DAO, this increased usage strengthens the DAO’s long-term financial position, in turn enhancing the value of the governance token.
During the most recent rebalance period, AAVE returned 22.97%, as investors responded to key developments related to GHO. A major catalyst was GHO’s cross-chain expansion to Arbitrum and Base. These deployments, supported by governance-approved rate limiters, helped maintain peg stability while enabling steady growth. The broader reach and increased minting activity boosted protocol revenues, further reinforcing AAVE’s appeal as a governance token tied to productive on-chain assets.
Momentum continued in April with the proposal of sGHO, a savings-rate mechanism designed to distribute protocol income directly to GHO holders. This initiative marked a shift from pure growth to utility, offering users tangible incentives for holding GHO. At the same time, Aave’s ability to adjust GHO borrowing rates in response to market conditions demonstrated disciplined risk management and contributed to growing trust in the ecosystem.
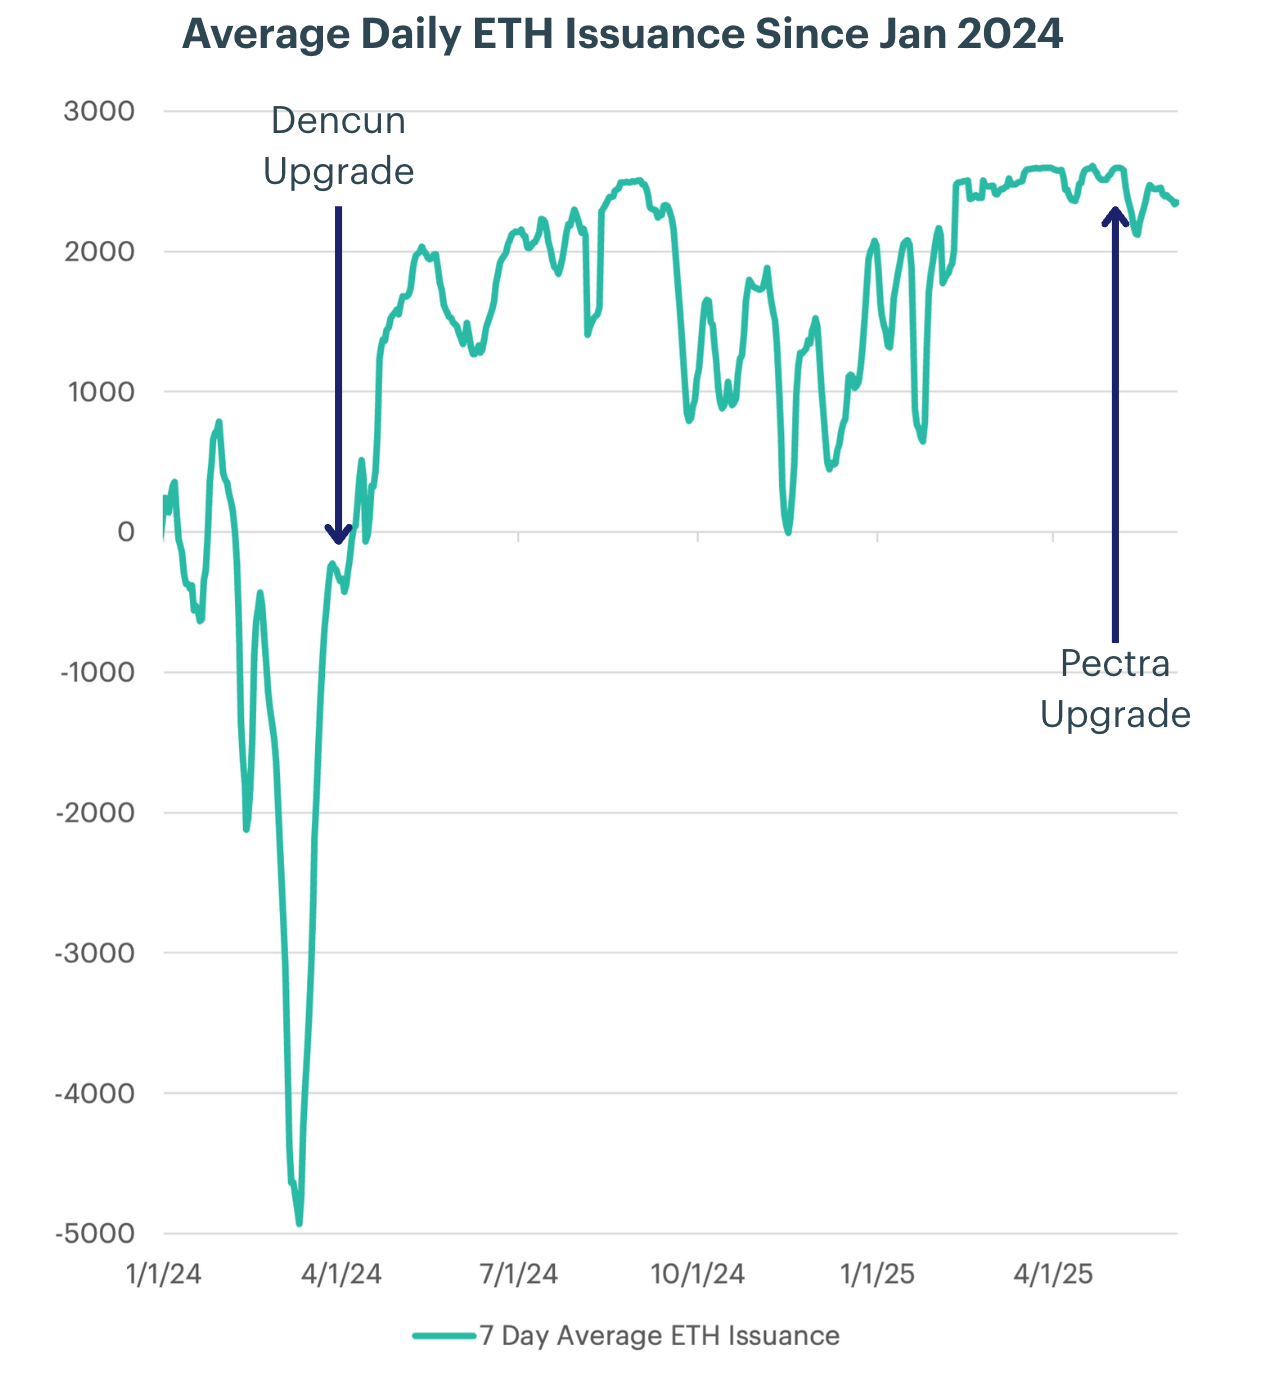
ETH Issuance Lower as Pectra Spurs Network Activity
Ethereum’s Pectra upgrade, activated on May 7, 2025, marked the network’s most significant advancement since the Merge. Combining the Prague and Electra hard forks, Pectra introduced 11 EIPs aimed at improving usability and scalability. Key changes included EIP-7702, which allows account-abstraction wallets to pay gas fees in any ERC-20 token, and EIP-7251, which raises the validator cap from 32 to 2,048 ETH, streamlining staking for institutions. The upgrade also expanded blob capacity, lowering data costs for rollups and reinforcing Ethereum’s layer-2-centric scaling strategy. Together, these updates enhance the user experience, improve validator efficiency, and lay the foundation for further upgrades.
Since its launch, Pectra has caused a shift in Ether’s supply dymanics. ETH’s annualized net issuance fell to around -0.53% in the weeks following the upgrade. This deflationary trend is supported by rising burn rates, driven by increased layer-2 activity, and a growing queue of staking deposits as validators consolidate under the new cap. Additional gas usage from expanded rollup data has also increased the volume of ETH burned through EIP-1559. While the token still trails its all-time highs, post-Pectra dynamics could strengthen demand for Ether and help close the user experience gap with the latest-generation smart contract platforms.
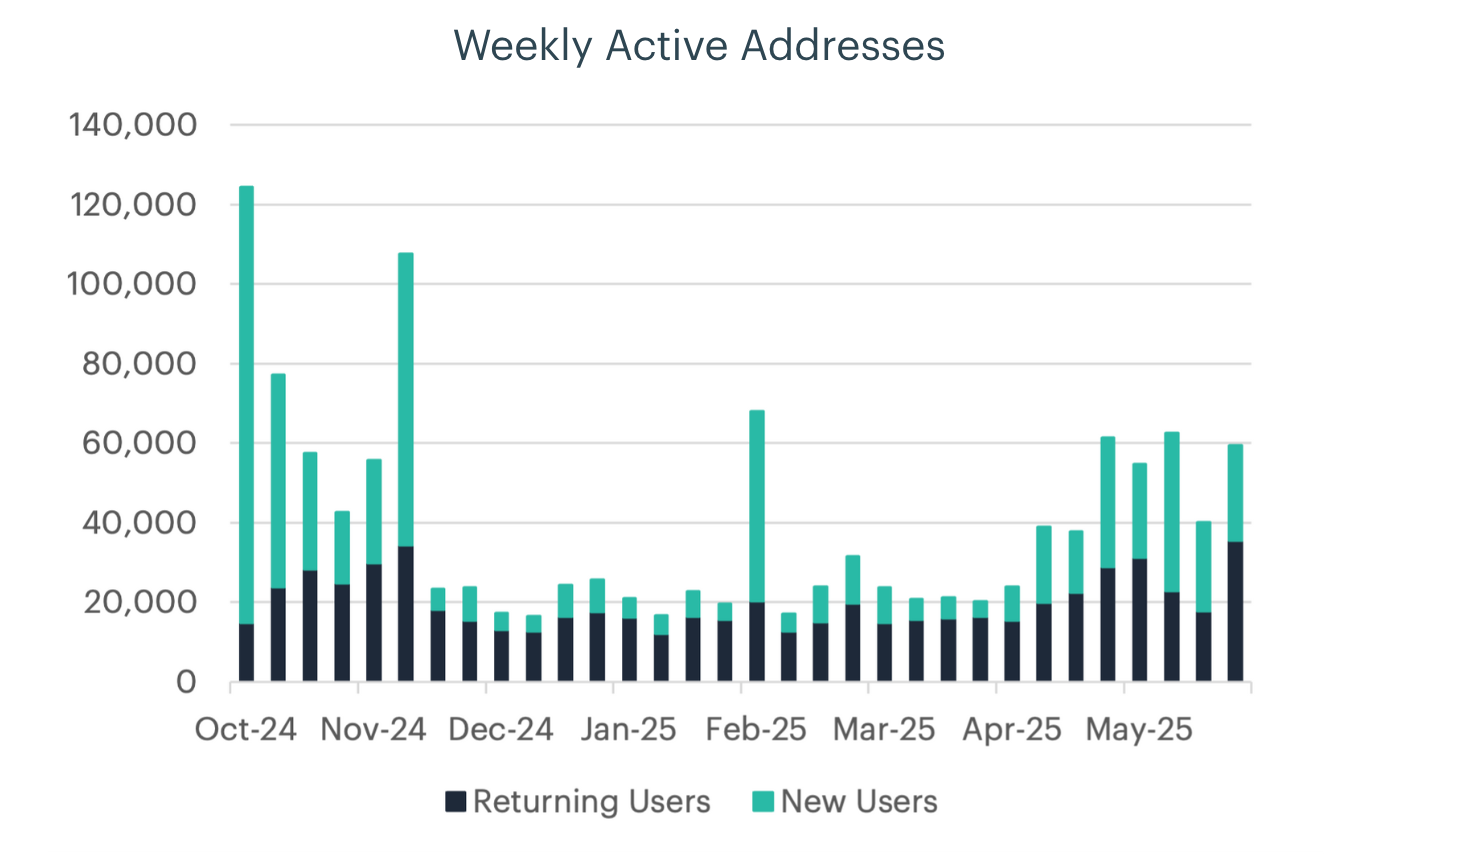
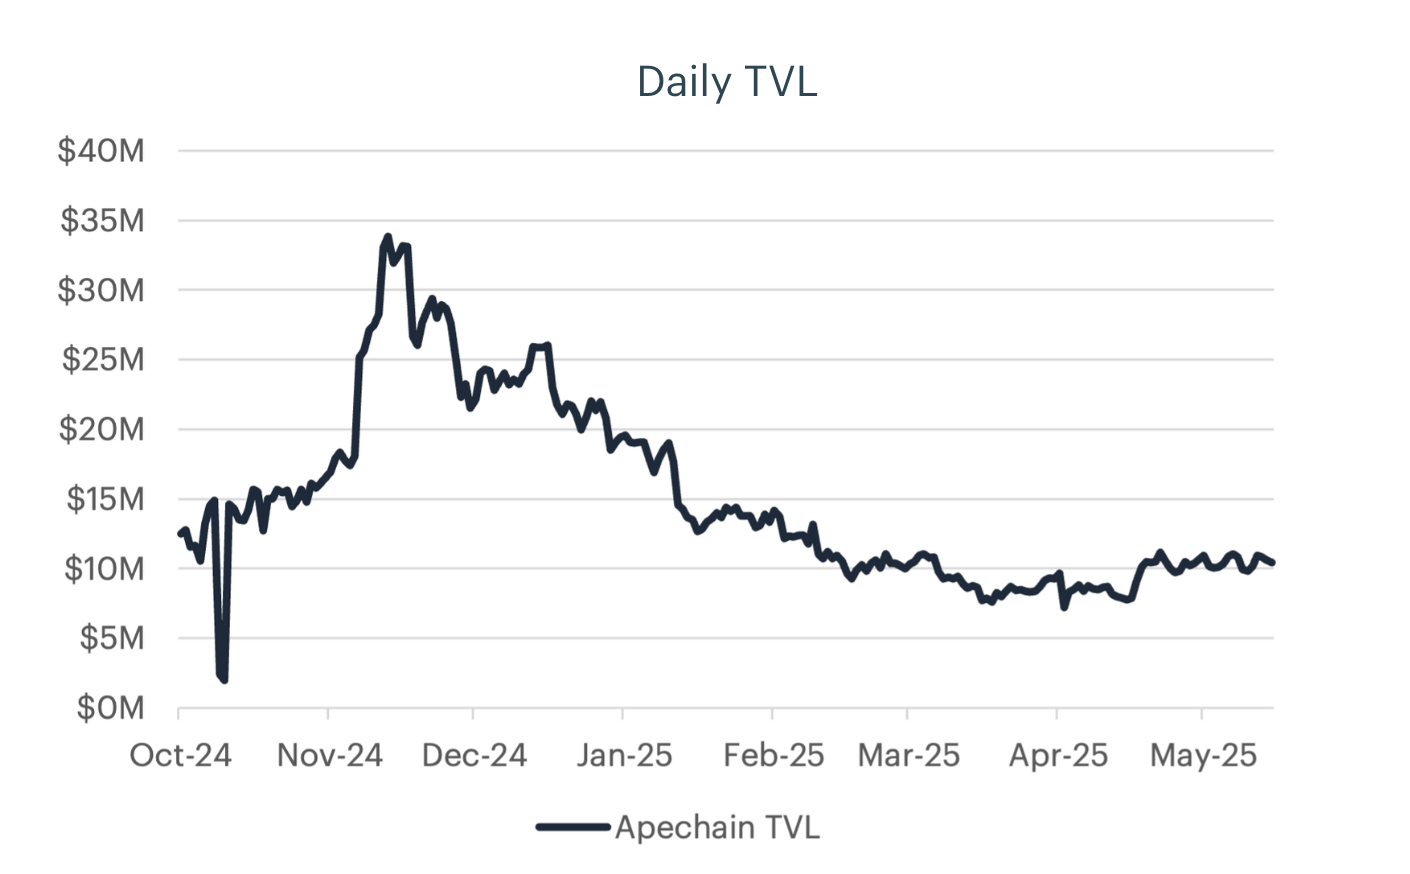
Apechain Sees Early Signs of Growth in Q2
ApeChain is an Arbitrum-based Layer-3 network built for the ApeCoin ecosystem, with APE serving as both the gas and governance token. Developed using Arbitrum Orbit, ApeChain offers low fees, Ethereum-level security, and developer-friendly tools like Stylus, making it a dedicated platform for NFT apps, social experiences, and Web3 gaming tied to Bored Ape Yacht Club and Otherside.
In 2025, ApeChain has shown early signs of adoption, with weekly active addresses rising 132% year-to-date. This growth has been supported by a developer grant from Arbitrum and Horizen Labs, along with wallet integrations that simplify user onboarding. Most notably, Yuga Labs has proposed consolidating the ApeCoin DAO treasury under a new entity to accelerate ApeChain’s development. If approved, the move could unlock significant funding for incentives and ecosystem growth, setting the stage for broader adoption in the second half of 2025.
To read the full report , please click on the respective links below:
- Quarterly Attribution Report (PDF Version)
Lastly, our Quarterly Attribution Reports are designed to help investors understand the performance of digital assets through a purpose-centric lens called the CF Digital Asset Classification Structure (CF DACS). To learn more about CF DACS, please utilize our interactive CF DACS Token Explorer.
Contact Us
Have a question or would like to chat? If so, please drop us a line to:
The information contained within is for educational and informational purposes ONLY. It is not intended nor should it be considered an invitation or inducement to buy or sell any of the underlying instruments cited including but not limited to cryptoassets, financial instruments or any instruments that reference any index provided by CF Benchmarks Ltd. This communication is not intended to persuade or incite you to buy or sell security or securities noted within. Any commentary provided is the opinion of the author and should not be considered a personalised recommendation. Please contact your financial adviser or professional before making an investment decision.
Note: Some of the underlying instruments cited within this material may be restricted to certain customer categories in certain jurisdictions.
Changes to the Token Market Price Benchmarks Series - Market Prices – 21 July 2026
The Administrator has confirmed changes to the Token Market Price Family for the period 14 July 2026 to 21 July 2026.

CF Benchmarks
Softer CPI Reprices July Hike Risk & Lifts Digital Assets
Digital assets extended their recovery over the past week as cooler US inflation prints repriced Fed expectations; the bid was broad across the large cap indices, growth factor leadership returned, stablecoin funding repriced lower, and stress stayed isolated in names hit by token-specific news.
Mark Pilipczuk
Notice of the Demising of CF Dai-Dollar Settlement Price and Spot Rate
The Administrator announces that it will demise the CF Dai-Dollar Settlement Price (DAIUSD_RR) and CF Dai-Dollar Spot Rate (DAIUSD_RTI) which are members of the CF Digital Asset Index Family.
CF Benchmarks
By clicking Accept, you consent to CF Benchmarks's use of cookies.
Visit Cookie Settings to learn how CF Benchmarks uses cookies and to adjust your preferences.