
Jun 10, 2024
CF Benchmarks Quarterly Attribution Reports - June 2024

A Balancing Act: Milestones and Macro Shape Market Performance
Last quarter's price action was primarily driven by waves of opposing forces. On the constructive side, excitement surrounded the upcoming Bitcoin halving, an event that programmatically reduces the supply of new Bitcoins and has historically provided a catalyst for driving prices higher. Additionally, the successful launch of spot Bitcoin and Ether Exchange Traded Funds (ETFs) in Hong Kong offered a new, regulated way for investors to participate in the digital asset market. This was further bolstered by a surprising shift in U.S. regulatory stance, with the Securities and Exchange Commission's (SEC) approval of a spot Ether ETF signaling a potential thaw in its relationship with cryptocurrencies. Finally, policymakers are now considering landmark legislation to govern the digital asset space. While it was not signed into law for now, such focus by congressional leaders clearly highlights its growing importance within the traditional financial system.
However, these supportive narratives have been countered by a significant macro headwind: stubbornly high inflation. This has resulted in a rebound in rates, with the 10-year treasury yield rising as much as 50 bps and setting a new year-to-date high of approximately 4.74% since the last rebalance period. It now appears that the Federal Reserve's fight against inflation may not be over, with Fed Funds Futures markets leaving the next anticipated move by the central bank up for debate. While the recent tightening of financial conditions may curb inflation, it has led to an increase in volatility for risky assets, including digital assets. The macro-landscape remains mixed, with only some categories of inflation showing signs of retreat as economic growth is potentially slowing down. The Fed and financial markets are now locked in a data-dependency 'feedback loop' about whether rate cuts (or even hikes) will materialize later this year. This conflicting data paints a complex picture, leaving investors unsure about the future.
Key takeaways:
Ultra Caps Lead as Blockchain Infrastructure Lags in Mixed Market
- Digital assets have mostly remained in a period of consolidation, resulting in sideways price action for the broader crypto market during the latest rebalance period.
- Excitement around the Bitcoin halving and regulatory wins, such as the approval of spot Ether ETFs, has supported the market, while concerns about rising interest rates and their impact on risky assets have tempered enthusiasm.
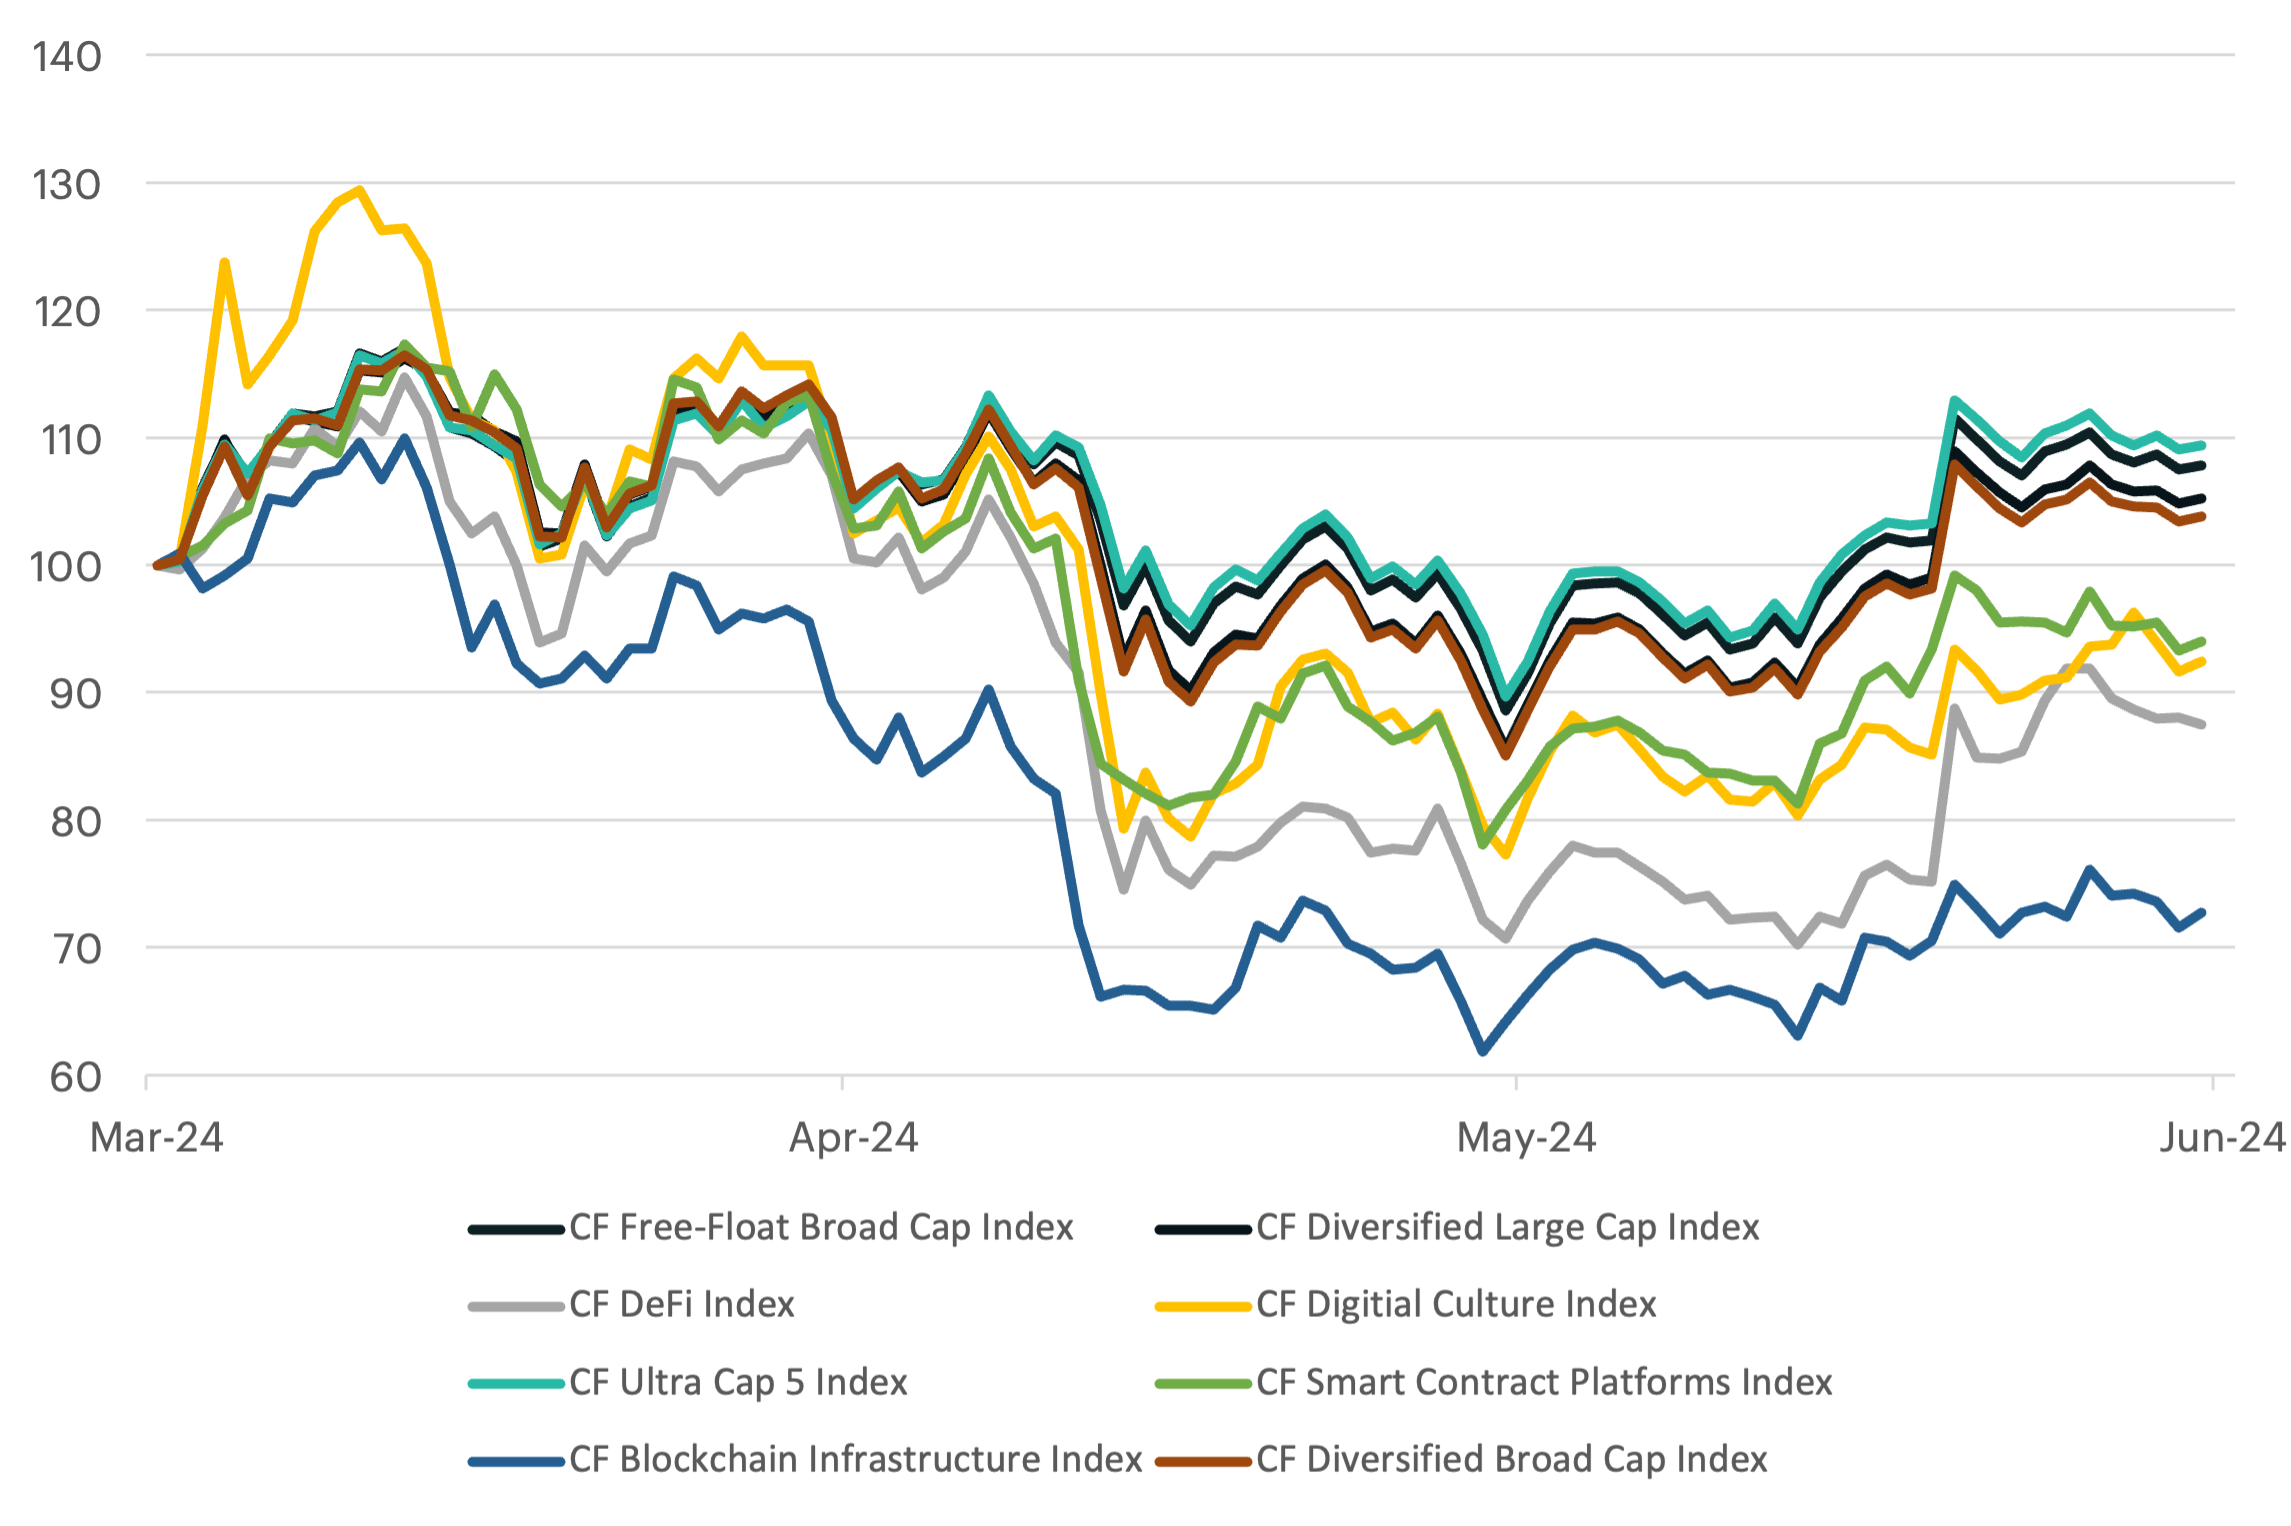
- The CF Cryptocurrency Ultra Cap 5 Index led all portfolio indices, rising over 9% and nearing its November 2021 record high levels, followed by the CF Free-Float Broad Cap Index (+8.0%), while the CF Blockchain Infrastructure Index (-26.4%) and CF DeFi Composite Index (-13.5%) lagged due to regulatory uncertainty.
Normalized Index Performance
How ETF Approvals are Shaping the ETH/BTC Ratio
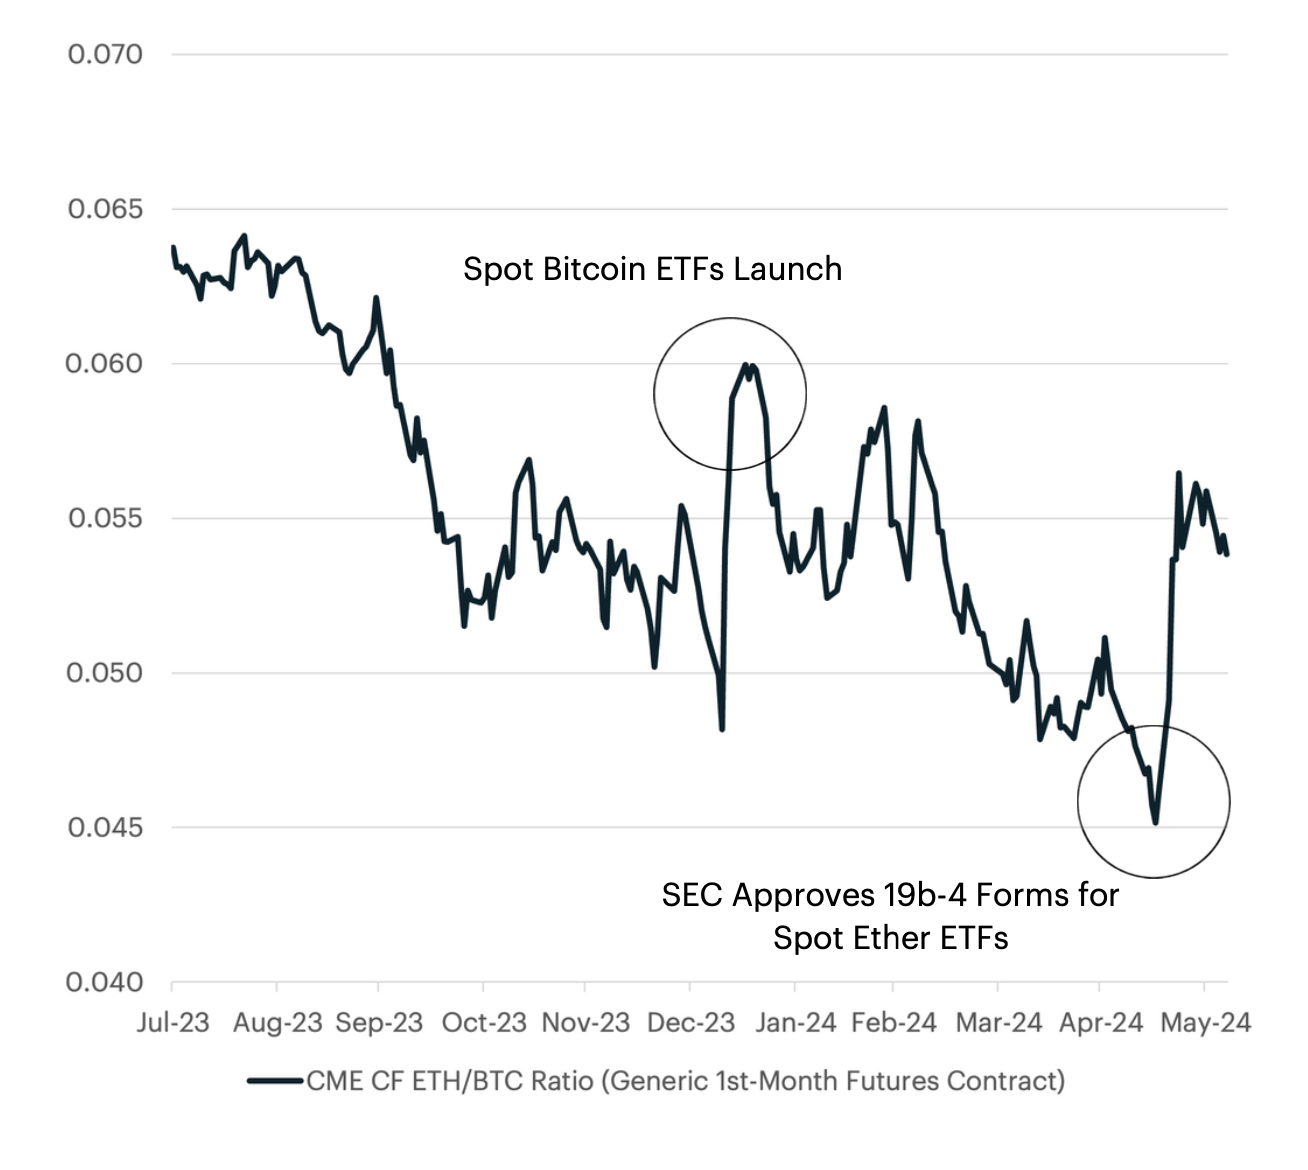
- The Ether to Bitcoin price ratio (ETH/BTC ratio) reflects the relative value of Ether to Bitcoin and serves as an indicator of market sentiment, guiding investment decisions and portfolio management.
- Following the SEC's approval of several Ether Commodity-Based Trust Shares last month, the ETH/BTC ratio showed notable upward movements, rising from 0.0451 on May 16, 2023, to 0.0558 by May 31, 2023, and 0.0538 on June 6, 2023.
- Monitoring the ETH/BTC ratio can provide valuable insights and tactical opportunities for informed investment decisions and portfolio management strategies, particularly in response to significant regulatory events.
Meme Coins Catch Up as Large-Cap Rally Broadens
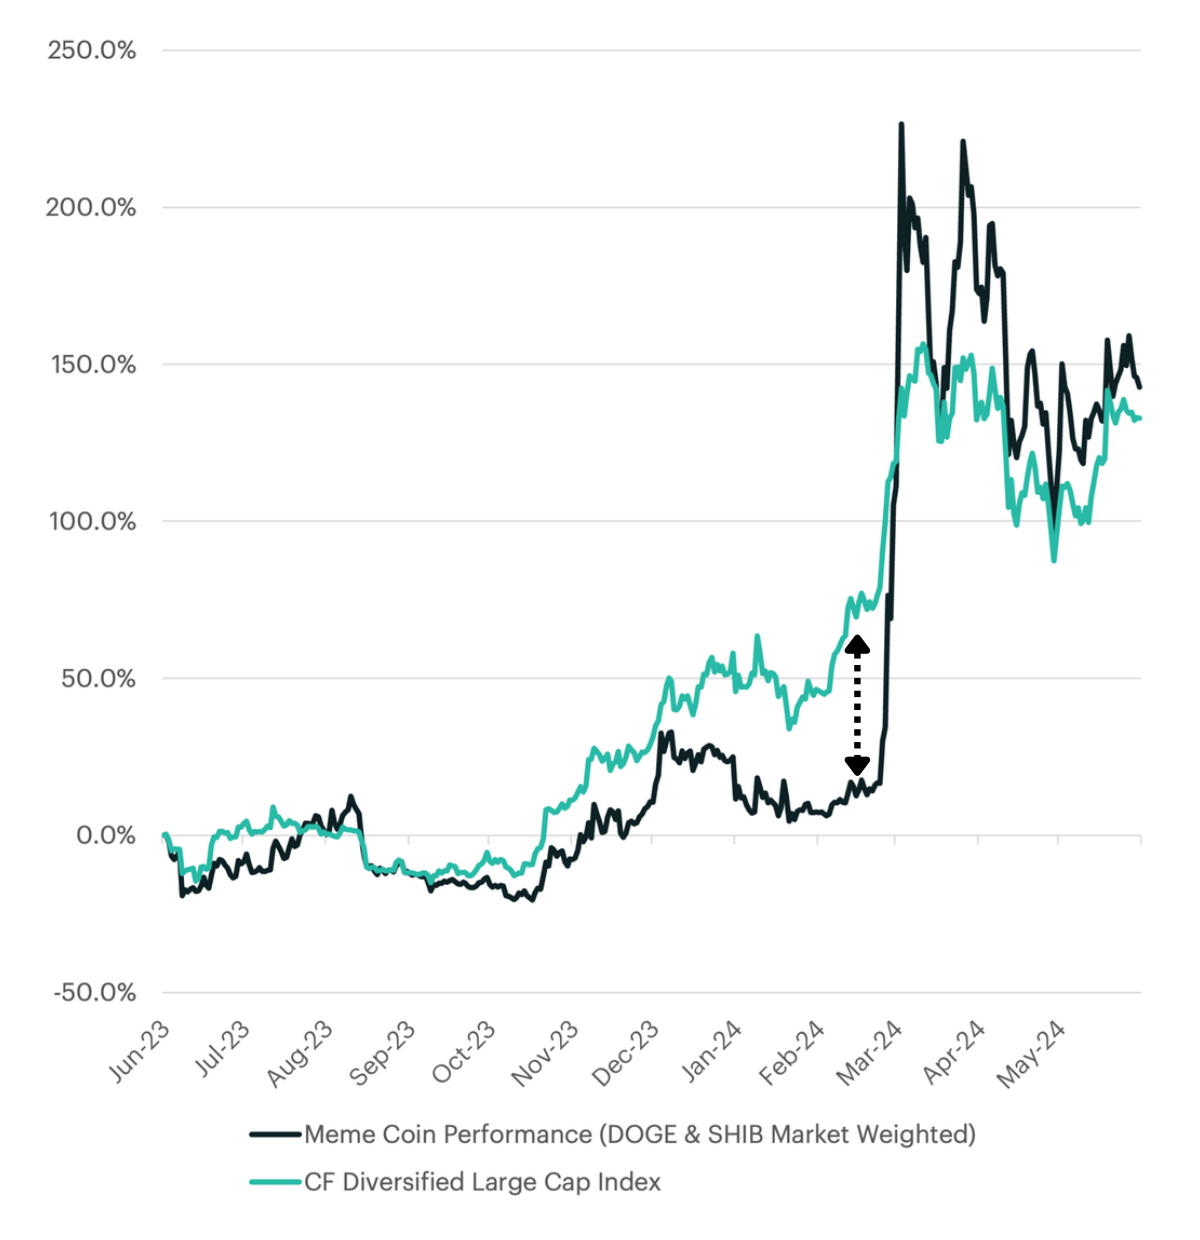
- Meme coins, such as Dogecoin (DOGE) and Shiba Inu (SHIB), have experienced a significant surge in value over the past few months, outpacing the CF Diversified Large Cap Index with rallies of up to 200% compared to the index's 50% gains since February 2024.
- Token-specific catalysts, such as Elon Musk's endorsements for Dogecoin and the launch of Shibarium and token burn mechanism for Shiba Inu, have contributed to the outperformance of meme coins, along with a broader bullish sentiment in the crypto market.
- The recent outperformance of DOGE and SHIB indicates a renewed interest in meme coins and suggests that the rally in digital assets might be broadening as other areas of the blockchain ecosystem experience positive strategic developments.
Meme Coin Mania Fuels Solana Adoption
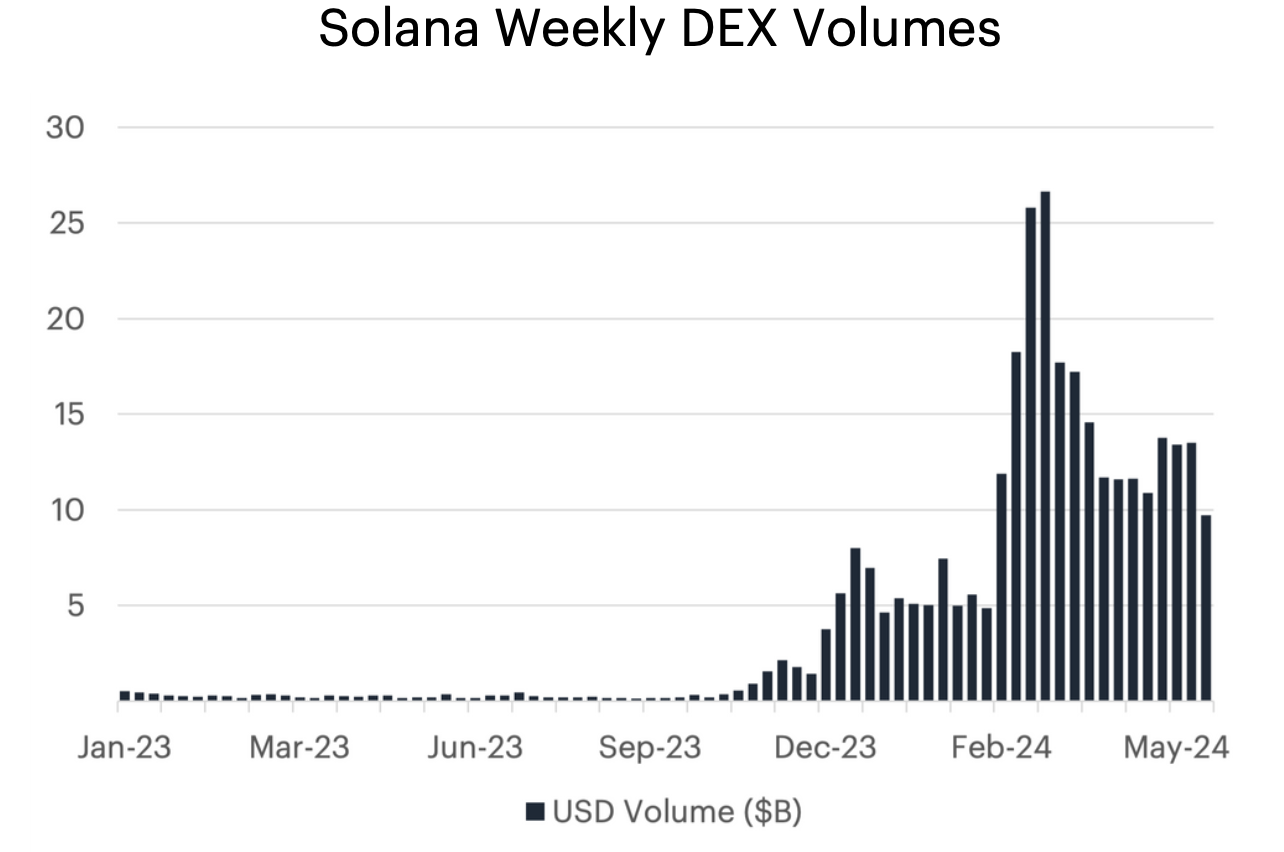
- Solana's SOL token was the largest contributor to the CF Web 3.0 Smart Contracts Index over the past 3 months.
- The Solana ecosystem experienced significant growth, with a 110% increase in TVL on decentralized exchanges surpassing $1 billion, a 161% increase in average weekly trading volumes to $15.9 billion, and the number of active traders rising to 2.3 million.
- The meme coin segment on Solana has seen a surge, with platforms like Pumpfun simplifying token launches, leading Solana to surpass other blockchains in new token creation.
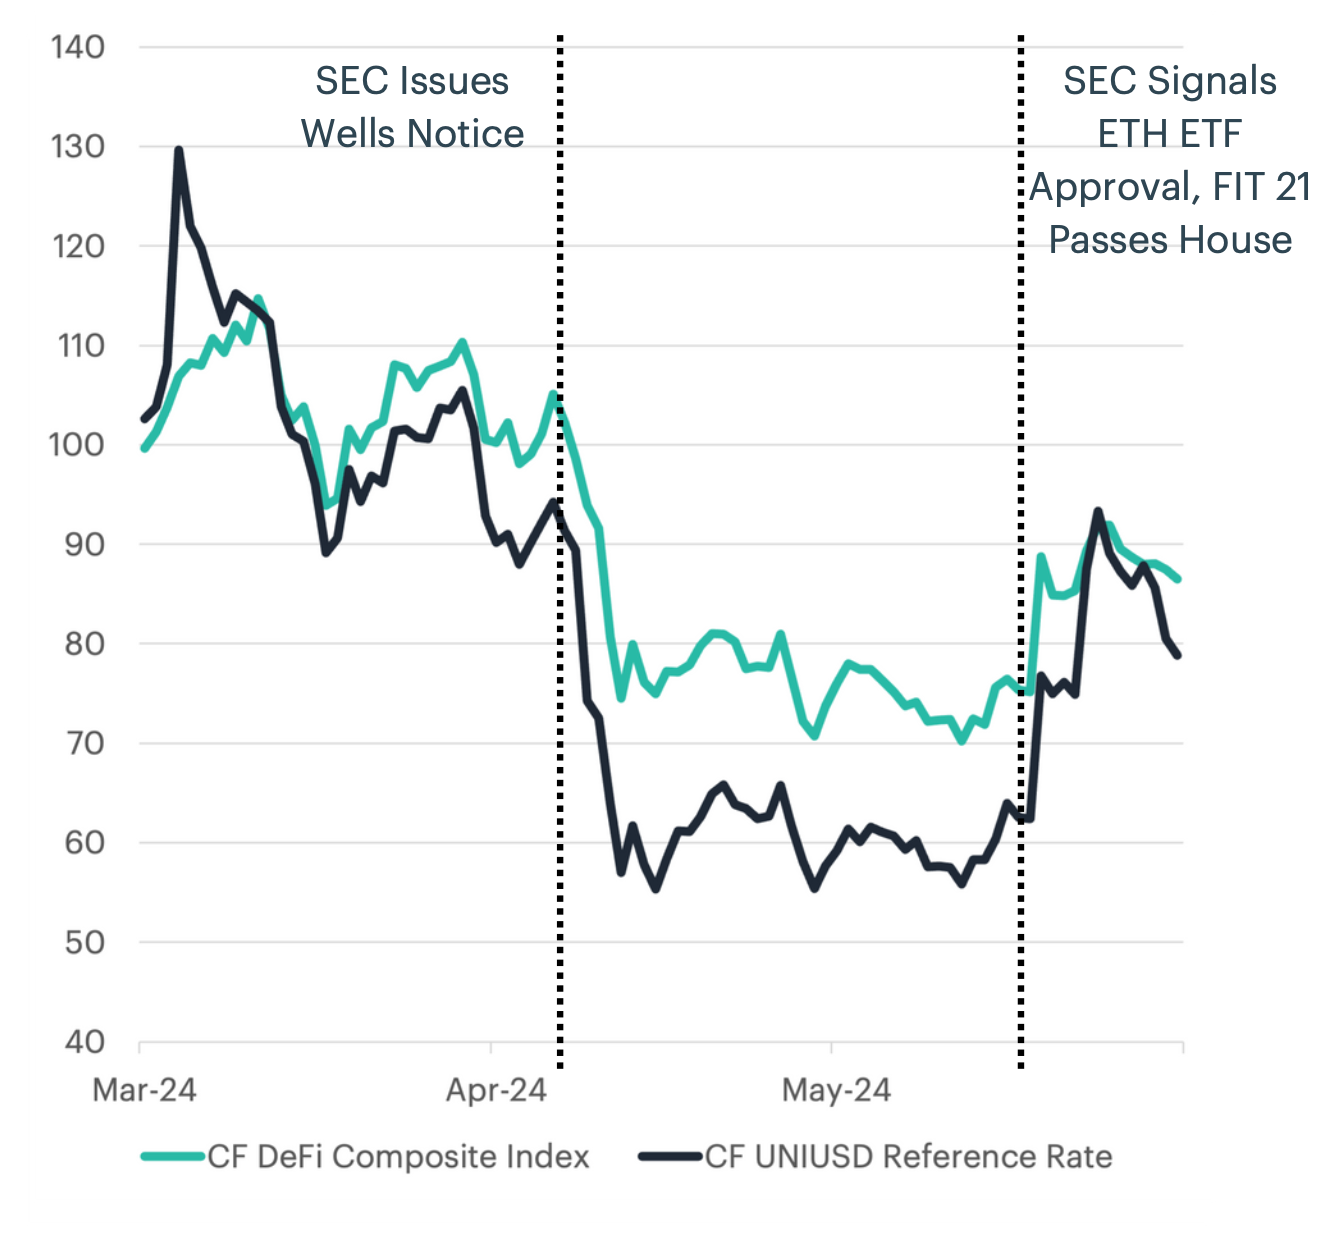
UNI Token Rebounds Amid Regulatory Shifts
- The SEC's issuance of a Wells Notice to the Uniswap Foundation on April 10th, 2024, led to a sharp decline in the UNI token (-38%) and the broader DeFi Composite Index (-28%) by May 1st.
- In a notable regulatory shift, the SEC requested revisions to spot Ether ETF applications on May 21st, signaling approval, while Congress passed the FIT 21 Act, establishing a comprehensive regulatory framework for digital asset commodities.
- Following these regulatory developments, the UNI token experienced a significant recovery, outperforming the broader CF DeFi Composite Index, highlighting the positive impact of regulatory clarity on market confidence and the resilience of DeFi platforms.
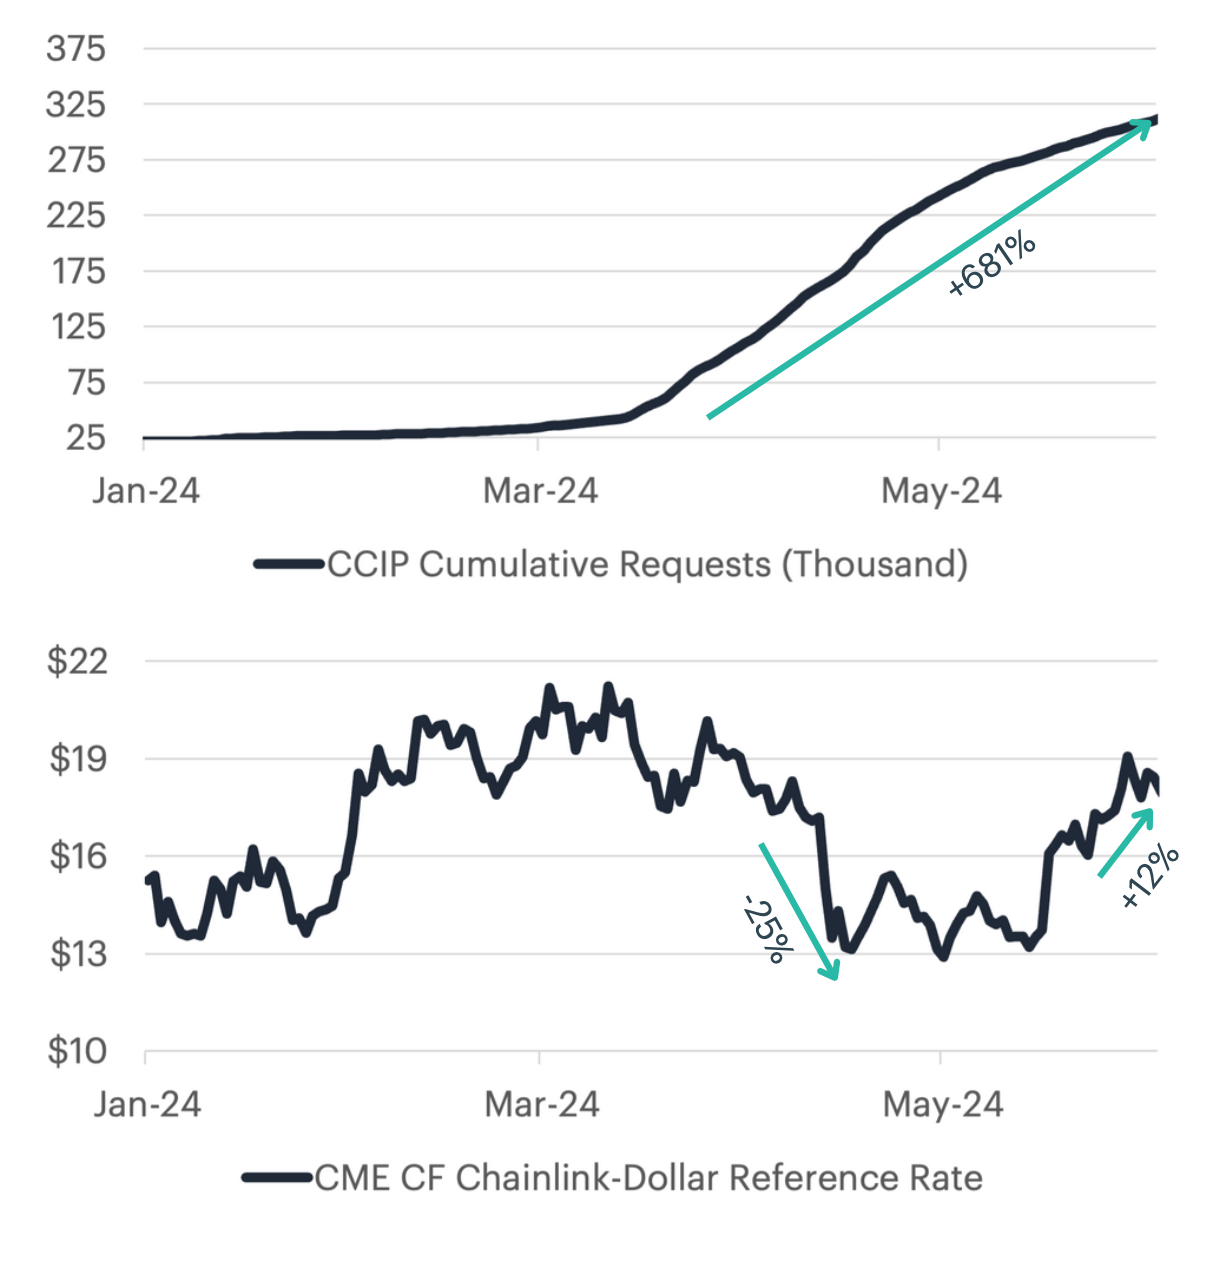
Chainlink Adoption Ignites Late Quarter Rally
- Chainlink's Cross-Chain Interoperability Protocol (CCIP) enables secure communication and transactions across various blockchain networks, enhancing the interoperability and scalability of dApps.
- In Q2 2024, Chainlink's CCIP saw a surge in usage, with USD stablecoin transfer volume exceeding $100 million in April and generating $460,000 in transaction fees on the Chainlink network.
- Despite initial setbacks due to adverse regulatory actions against Uniswap Labs, the LINK token outperformed the broader CF Blockchain Infrastructure Index by 650 bps, gaining 12% following the approval of the Ethereum ETF.
To read the full compilation report or a specific index's report, please click on the respective links below:
- Quarterly Attribution Report (PDF Version)
- CF Broad Cap Index Series
- CF Cryptocurrency Ultra Cap 5 Index
- CF Diversified Large Cap Index
- CF DeFi Composite Index
- CF Web 3.0 Smart Contract Platforms Index
- CF Digital Culture Composite Index
- CF Blockchain Infrastructure Index
Lastly, our Quarterly Attribution Reports are designed to help investors understand the performance of digital assets through a purpose-centric lens called the CF Digital Asset Classification Structure (CF DACS). To learn more about CF DACS, please utilize our interactive CF DACS Token Explorer.
Contact Us
Have a question or would like to chat? If so, please drop us a line to:
The information contained within is for educational and informational purposes ONLY. It is not intended nor should it be considered an invitation or inducement to buy or sell any of the underlying instruments cited including but not limited to cryptoassets, financial instruments or any instruments that reference any index provided by CF Benchmarks Ltd. This communication is not intended to persuade or incite you to buy or sell security or securities noted within. Any commentary provided is the opinion of the author and should not be considered a personalised recommendation. Please contact your financial adviser or professional before making an investment decision.
Note: Some of the underlying instruments cited within this material may be restricted to certain customer categories in certain jurisdictions.
Digital Assets Absorb Hawkish Repricing Ahead of the FOMC
Digital assets traded through a hawkish macro surprise this week but closed mostly higher, with breadth holding across major names and indices. Sector leadership traced to a single regulatory catalyst, not a broad rotation, and implied volatility stayed firmer than realized into the weekend.

Mark Pilipczuk
Factor Friday - July 24, 2026
Beta's four-week grind higher stalled this week as style leadership rotated again: Momentum took the top spot, last week's leader Value fell to the bottom, and Growth stayed July's weakest factor. Size remains the only style factor positive on the year; beta, not style selection, is setting returns.
Mark Pilipczuk
Changes to the Token Market Price Benchmarks Series - Market Prices – 21 July 2026
The Administrator has confirmed changes to the Token Market Price Family for the period 14 July 2026 to 21 July 2026.
CF Benchmarks
By clicking Accept, you consent to CF Benchmarks's use of cookies.
Visit Cookie Settings to learn how CF Benchmarks uses cookies and to adjust your preferences.