
Dec 10, 2024
CF Benchmarks Quarterly Attribution Reports - December 2024
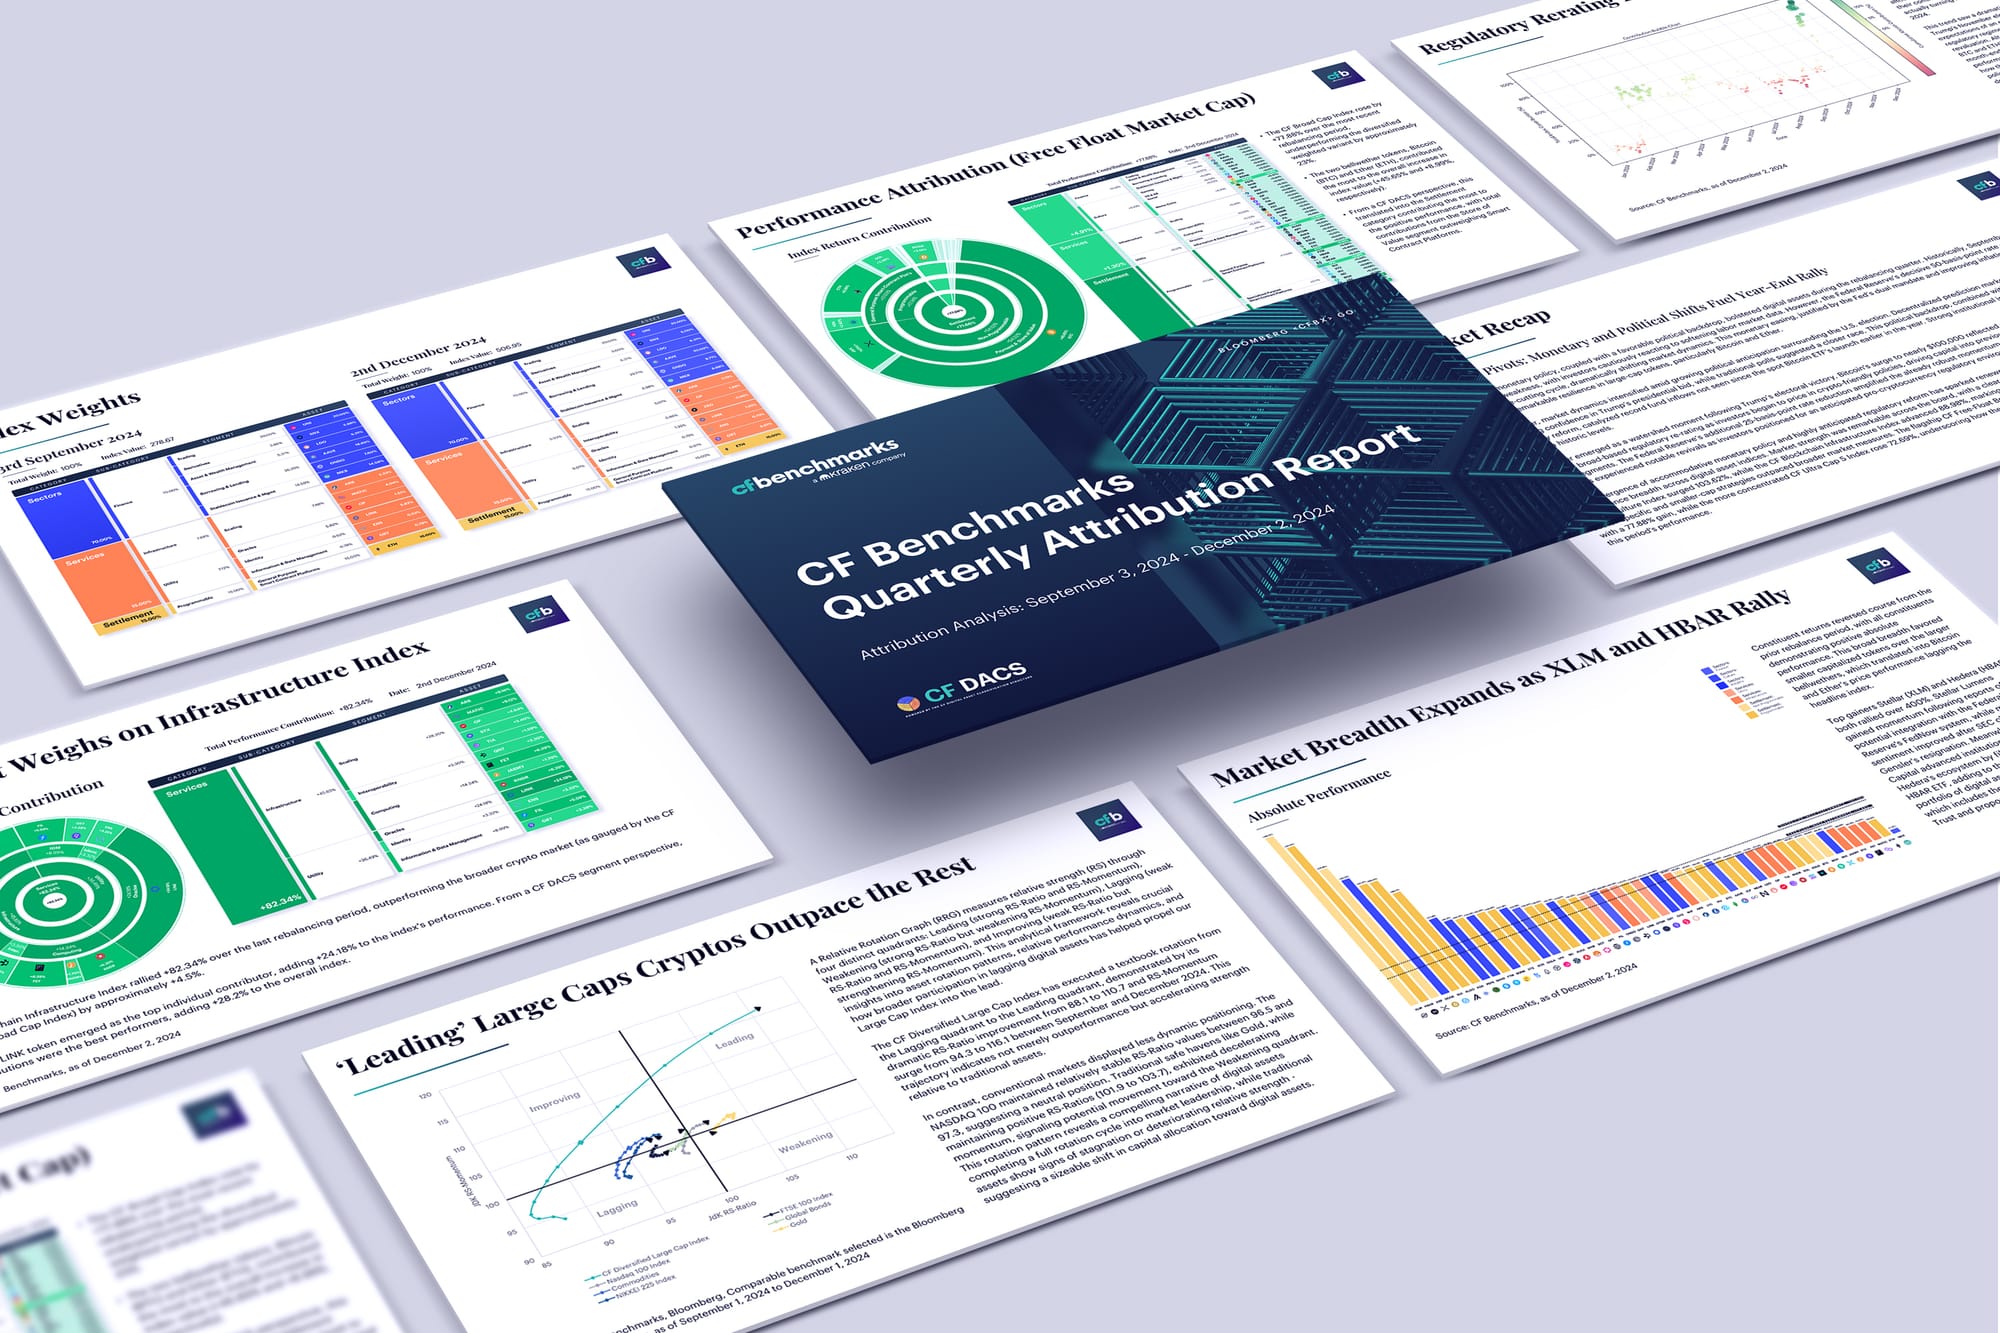

Policy Pivots: Monetary and Political Shifts Fuel Year-End Rally
A shift in monetary policy, coupled with a favorable political backdrop, bolstered digital assets during the rebalancing quarter. Historically, September exhibits seasonal weakness, with investors cautiously reacting to softening labor market data. However, the Federal Reserve’s decisive 50-basis-point rate cut initiated a new rate-cutting cycle, dramatically shifting market dynamics. This monetary easing, justified by the Fed’s dual mandate and improving inflation trends, sparked remarkable resilience in large-cap tokens, particularly Bitcoin and Ether.
In October, market dynamics intensified amid growing political anticipation surrounding the U.S. election. Decentralized prediction markets showed increasing confidence in Trump’s presidential bid, while traditional polls suggested a closer race. This political backdrop, combined with expectations of regulatory reform, catalyzed record fund inflows not seen since the spot Bitcoin ETF’s launch earlier in the year. Strong institutional interest drove CME futures activity to historic levels.
November emerged as a watershed moment following Trump’s electoral victory. Bitcoin's surge to nearly $100,000 reflected more than just price action – it marked a broad-based regulatory re-rating as investors began to price in crypto-friendly policies, driving capital into previously underperforming altcoins and market segments. The Federal Reserve’s additional 25-basis-point rate reduction amplified the already robust momentum. Previously lagging digital asset segments experienced notable revivals as investors positioned for an anticipated pro-cryptocurrency regulatory environment.
Key takeaways:
Digital Assets Demonstrate Broader Participation
- Accommodative monetary policy combined with expected regulatory reforms has created new optimism around prices, leading to broad-based performance improvements across digital asset indices.
- Market performance showed exceptional strength overall, with a significant shift in which sectors led the gains.
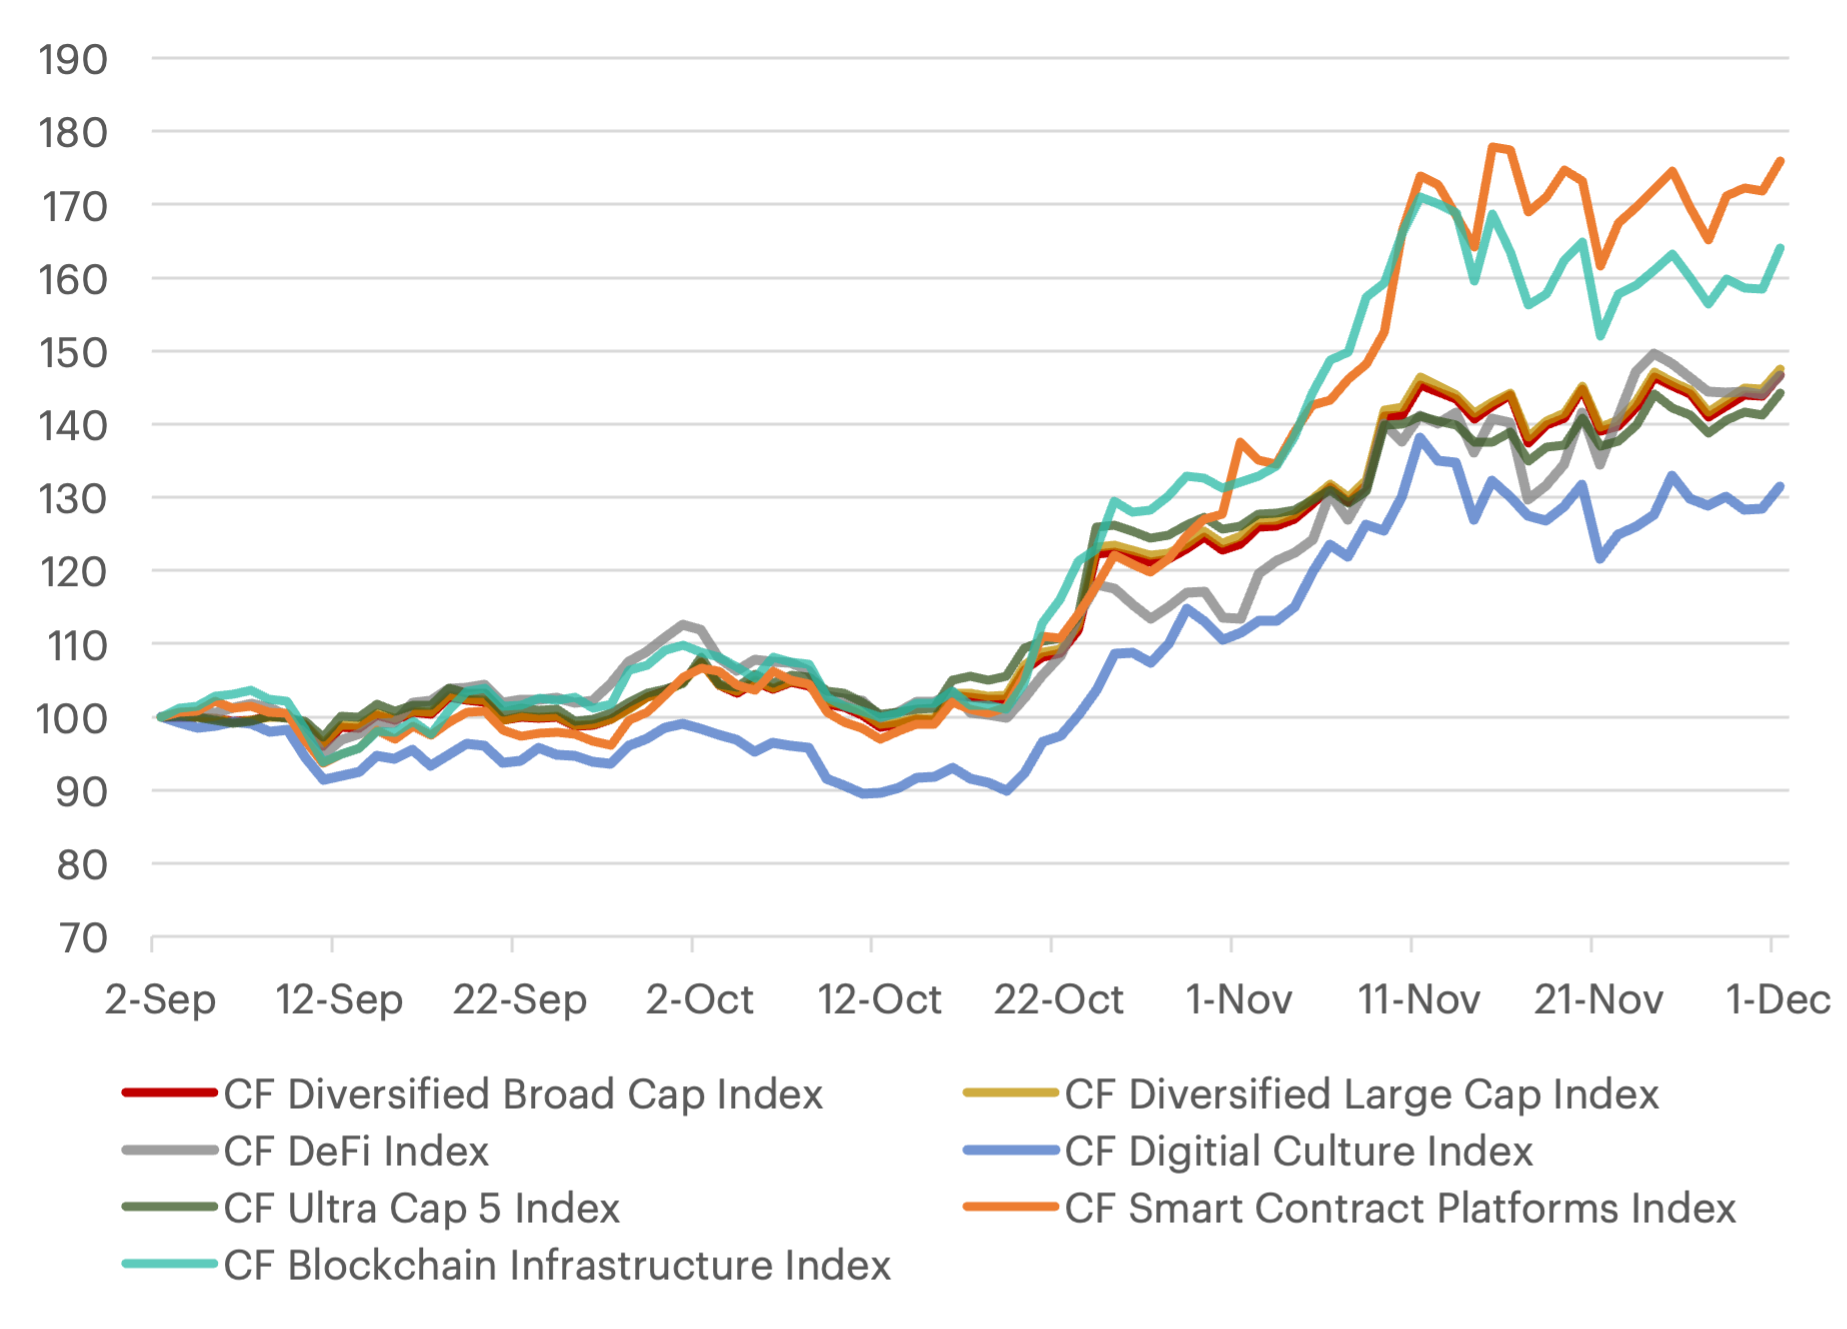
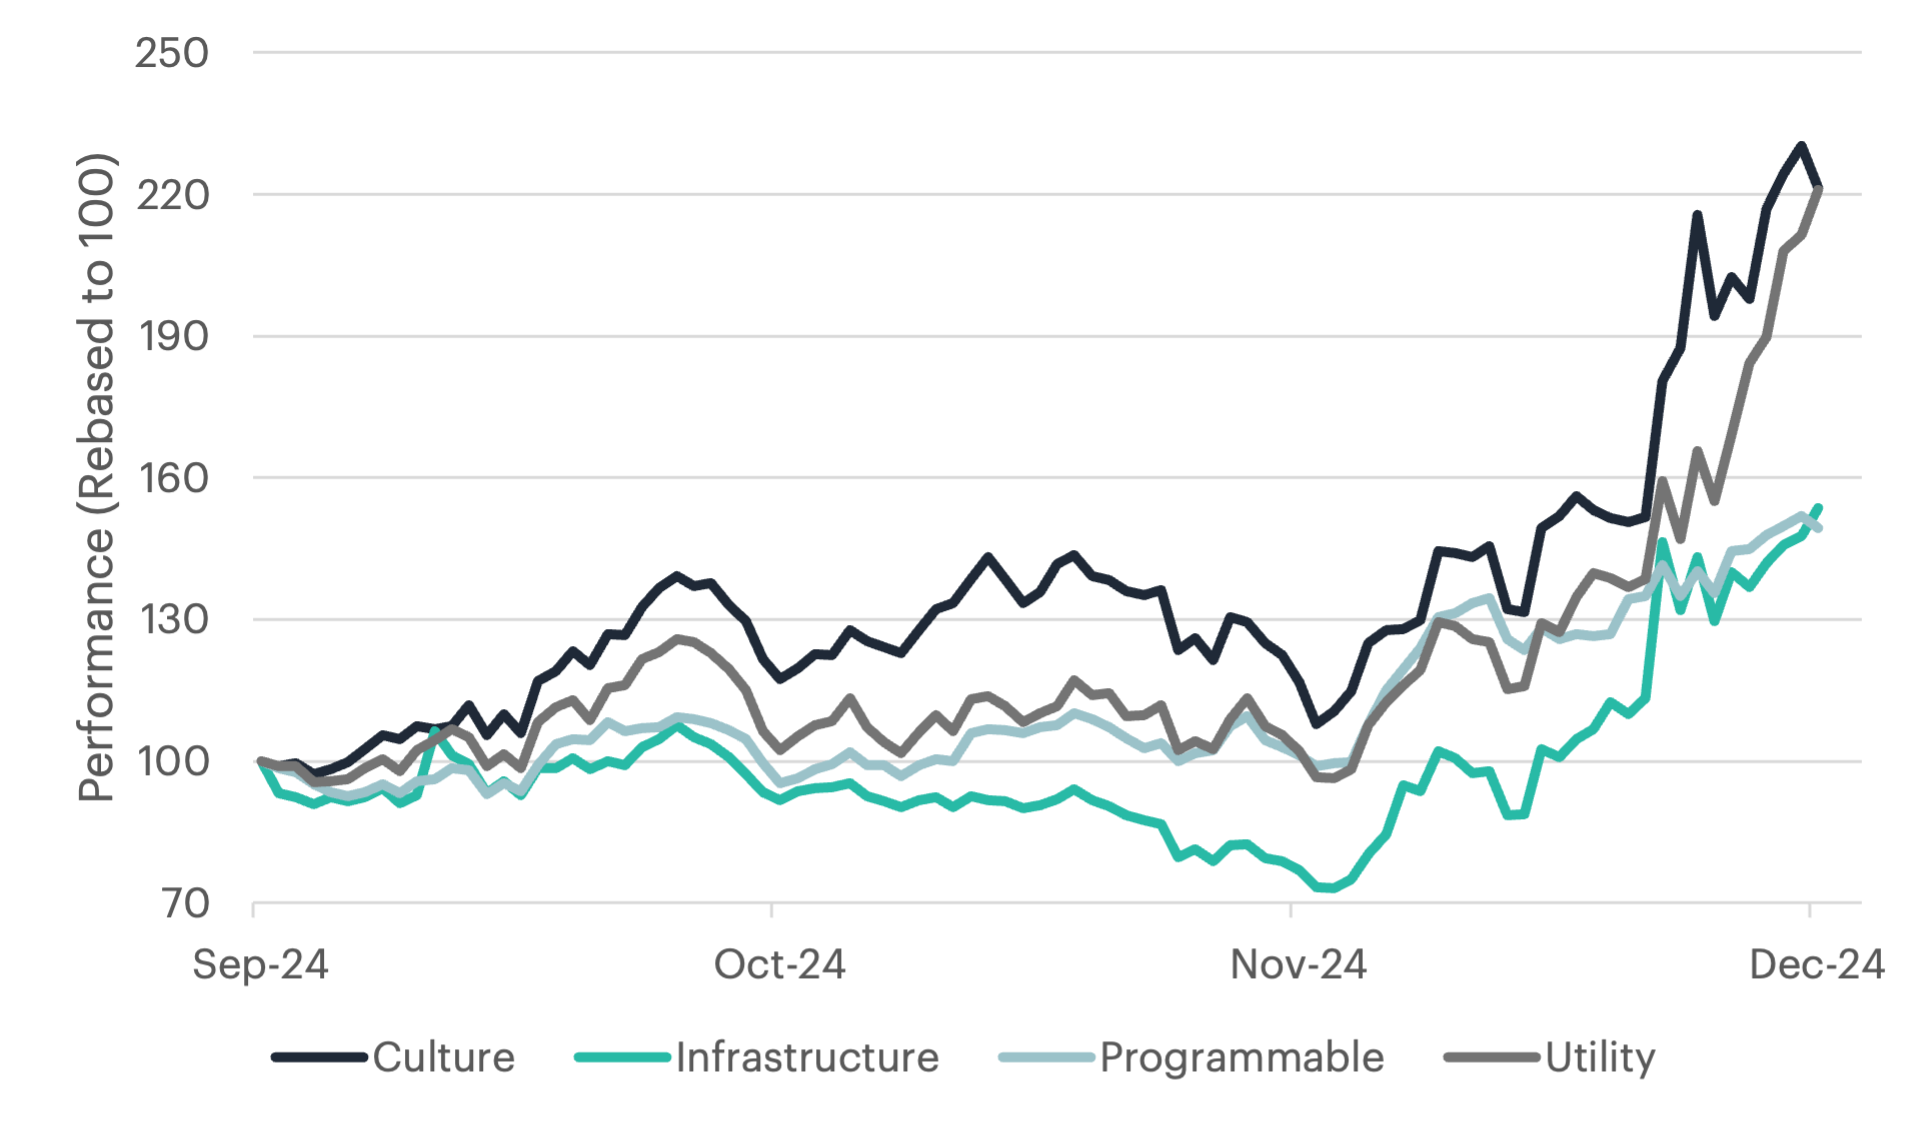
- The CF Digital Culture Index demonstrated remarkable growth with a 103.62% increase, while the CF Blockchain Infrastructure Index followed with an 82.34% gain, representing a major shift where sector-specific and smaller-cap strategies began outperforming broader market indicators.
- The CF Free-Float Broad Cap Index reflected the widespread market rally with a 77.88% increase, and the more concentrated CF Ultra Cap 5 Index rose by 72.69%, highlighting how thematic exposure and broader market participation defined this period's performance dynamics.
Normalized Index Performance
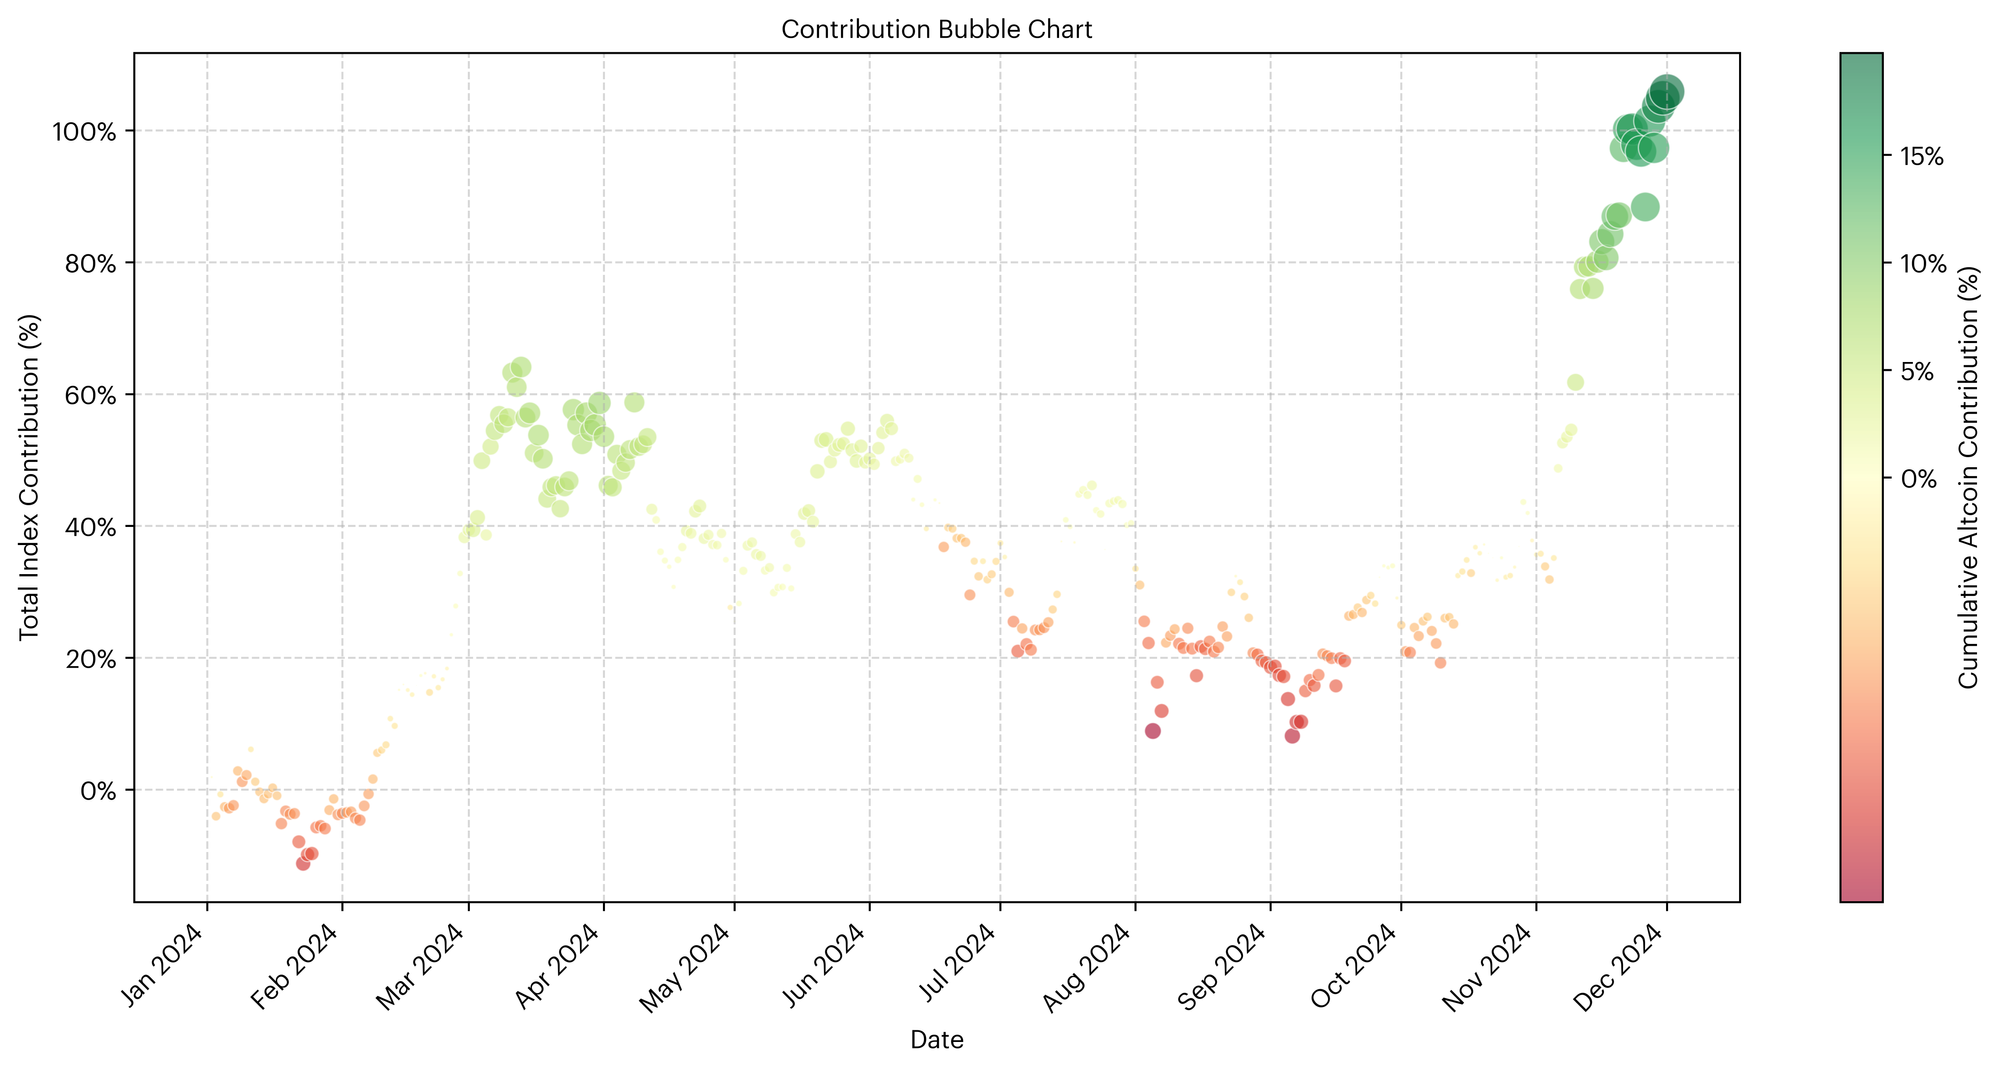
Altcoins Surge Following Pro-Crypto Election Win
- The digital asset class is undergoing a significant regulatory shift, with altcoins (cryptocurrencies other than Bitcoin and Ether) showing notable performance changes.
- Much of 2024’s rally was dominated by Bitcoin, while altcoins significantly underperformed, with their contributions to the CF Broad Cap Index turning negative during Q3 2024.
- Altcoins experienced a sharp reversal following Trump’s November election victory, as expectations of a pro-crypto regulatory regime triggered a broad market revaluation.
- Contributions from altcoins (excluding BTC and ETH) surged from -0.01% to +18.7% by the end of November, marking their strongest performance of the year.
- The prospect of cryptocurrency-friendly policies spurred a powerful “catch-up trade,” prompting investors to expand their exposure beyond Bitcoin into previously lagging market segments.
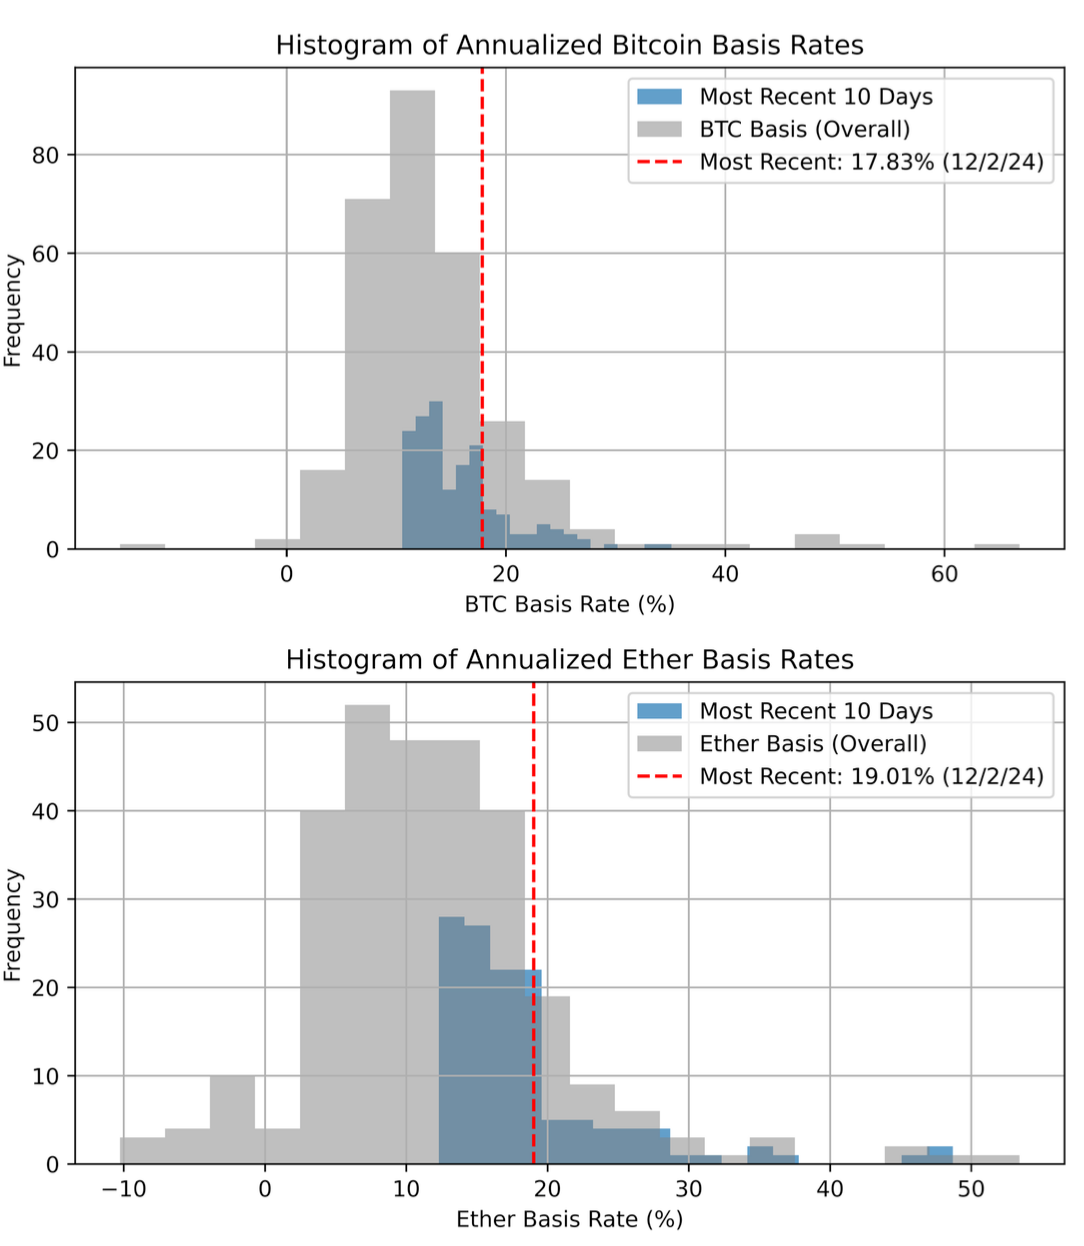
Bitcoin & Ether Basis Converges
- Bitcoin and Ether prices saw bullish momentum in November, driving notable deviations in CME Futures basis rates and a convergence in basis spreads, with Ether’s basis surging to 22.5%, more than double its historical median and matching Bitcoin’s traditionally higher levels.
- This basis expansion opens new opportunities for institutional traders to explore cash-and-carry strategies with Ether futures, historically focused on Bitcoin due to its consistently higher basis rates.
- The convergence between Bitcoin and Ether basis rates could herald a shift in institutional arbitrage activity, encouraging broader market engagement across both major digital assets.
- Persistently aligned basis spreads may increase futures open-interest and spot ETF flows, as arbitragers hedge short futures with spot positions, enhancing Ether’s overall market activity and liquidity.
Digital Assets Lead Market Rotation
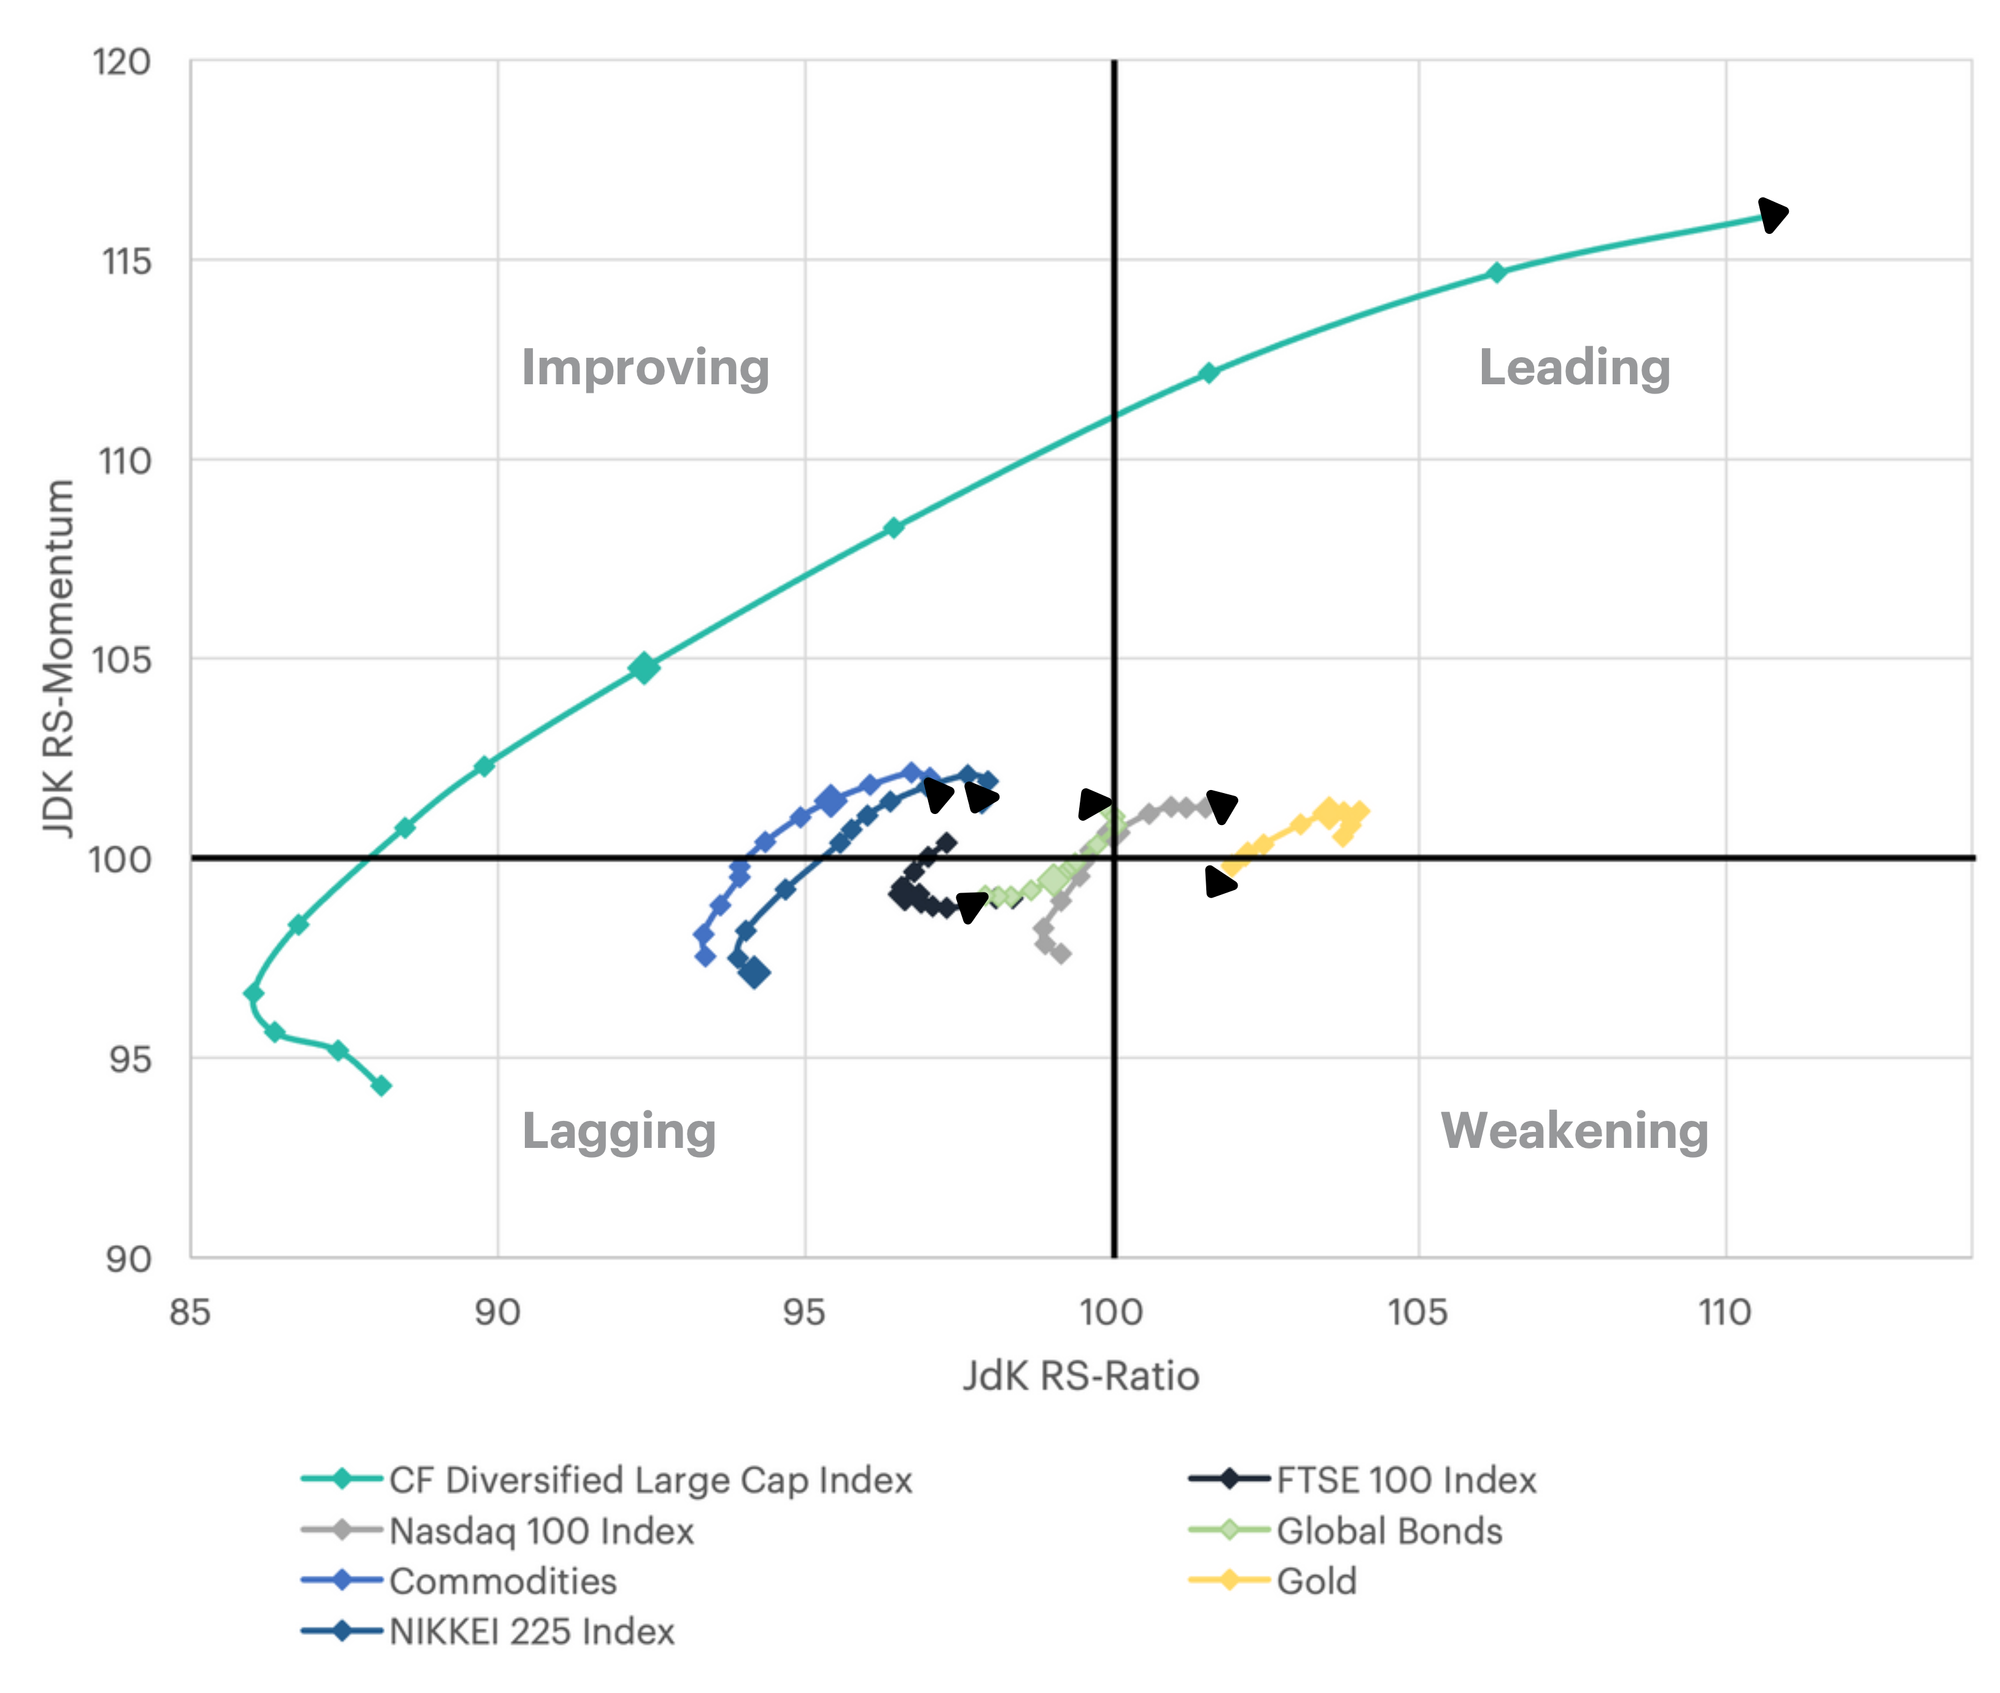
- A Relative Rotation Graph (RRG) analyzes relative strength (RS) through four quadrants: Leading (strong RS-Ratio and RS-Momentum), Weakening (strong RS-Ratio but declining RS-Momentum), Lagging (weak RS-Ratio and RS-Momentum), and Improving (weak RS-Ratio but rising RS-Momentum). It provides key insights into asset rotation patterns and relative performance dynamics.
- The CF Diversified Large Cap Index showcased a classic rotation from the Lagging to the Leading quadrant, with RS-Ratio improving from 88.1 to 110.7 and RS-Momentum surging from 94.3 to 116.1 between September and December 2024, indicating accelerating relative strength.
- Conventional markets exhibited less dynamic changes, with the NASDAQ 100 holding stable RS-Ratio values (96.5 to 97.3) in a neutral position. Gold, despite maintaining positive RS-Ratios (101.9 to 103.7), showed decelerating momentum, suggesting a move toward the Weakening quadrant.
- These patterns highlight digital assets completing a full rotation cycle into market leadership, while traditional assets stagnate or weaken, pointing to a significant capital shift toward digital assets.
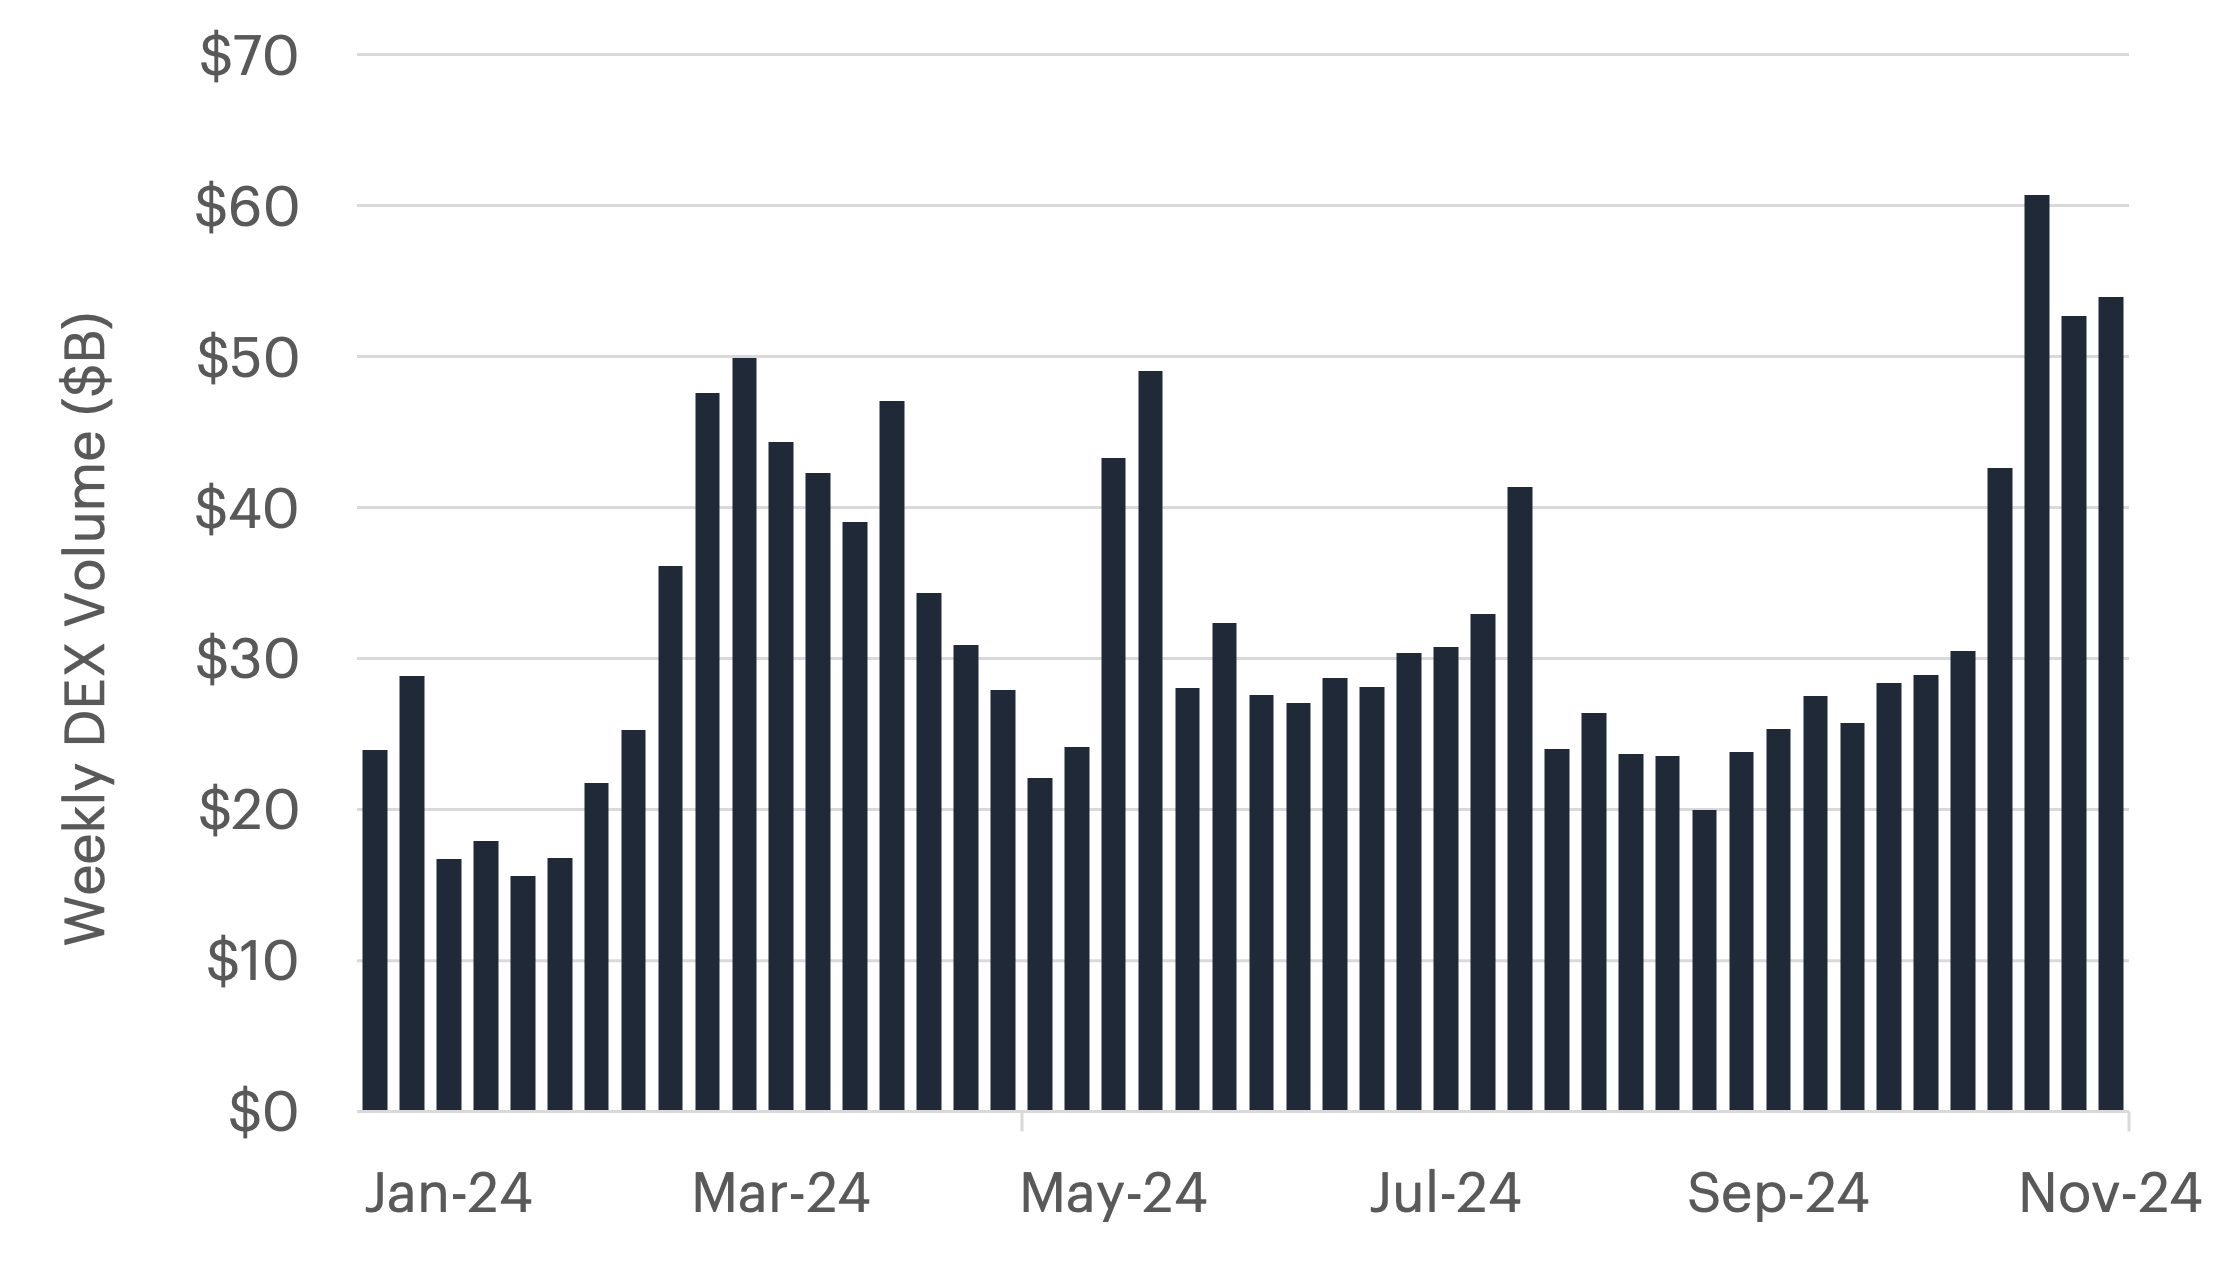
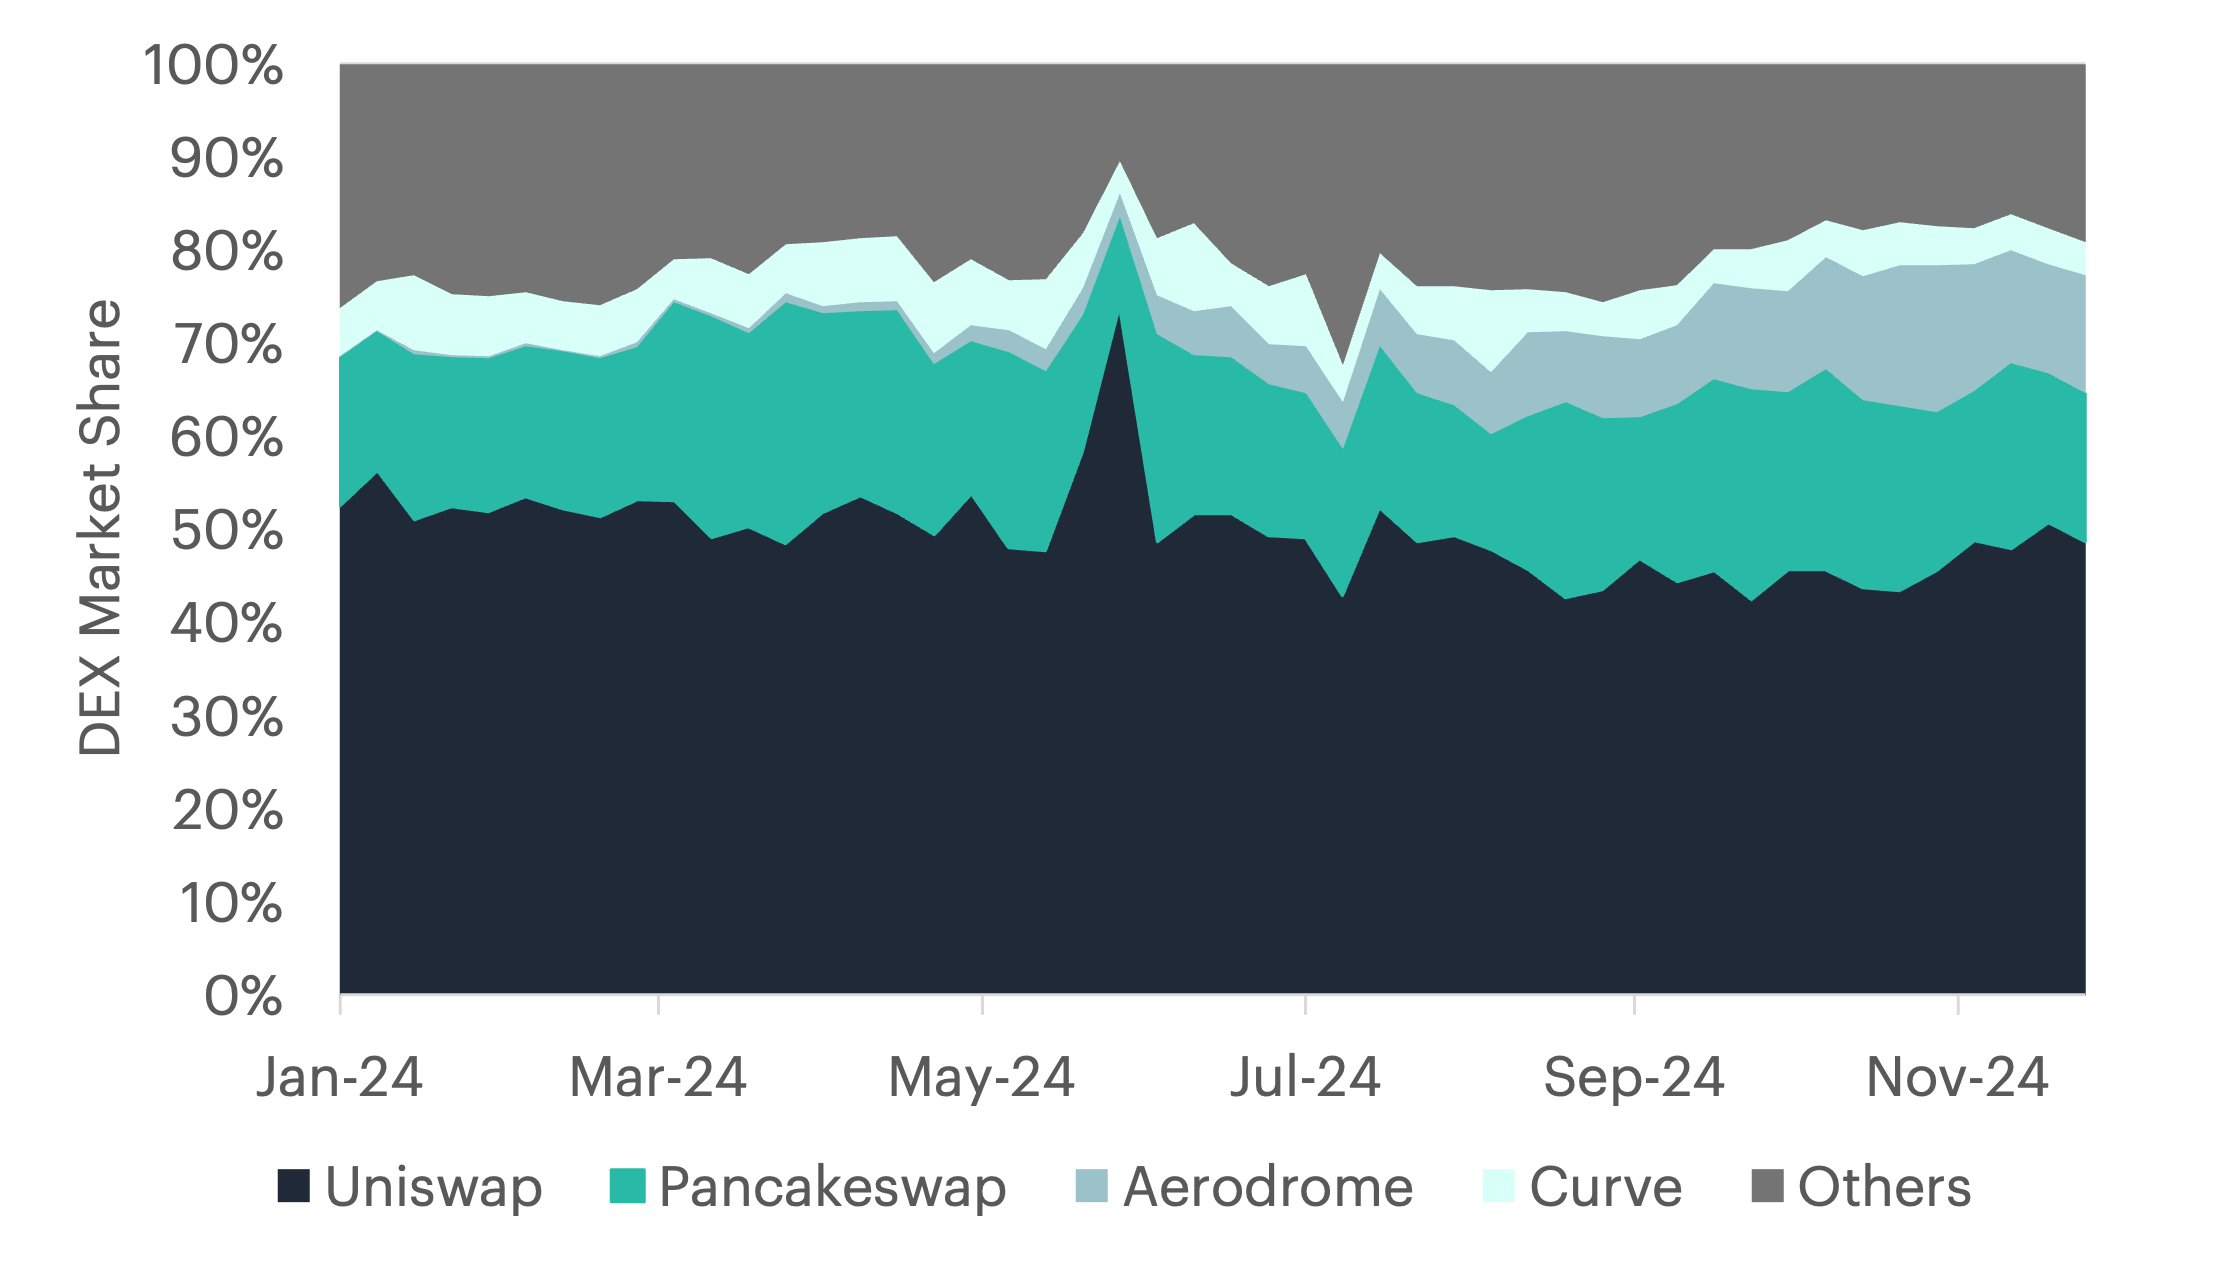
Uniswap Gains Momentum Amid DEX Volume Surge
- Decentralized exchanges (DEXes) saw steady growth in Q4 trading volumes, with a sharp post-election surge driven by anticipated regulatory changes, pushing volumes to unprecedented levels. Uniswap expanded its market share by 3.6%, largely due to increased activity on the Base blockchain and renewed retail interest in meme coins.
- Uniswap’s prominence grew alongside a broader market rally, with its mobile app reaching the 79th spot on the Apple App Store’s top 100 finance apps.
- Higher trading activity during this period generated increased transaction fees, potentially boosting value for Uniswap token holders through the proposed fee-sharing mechanism.
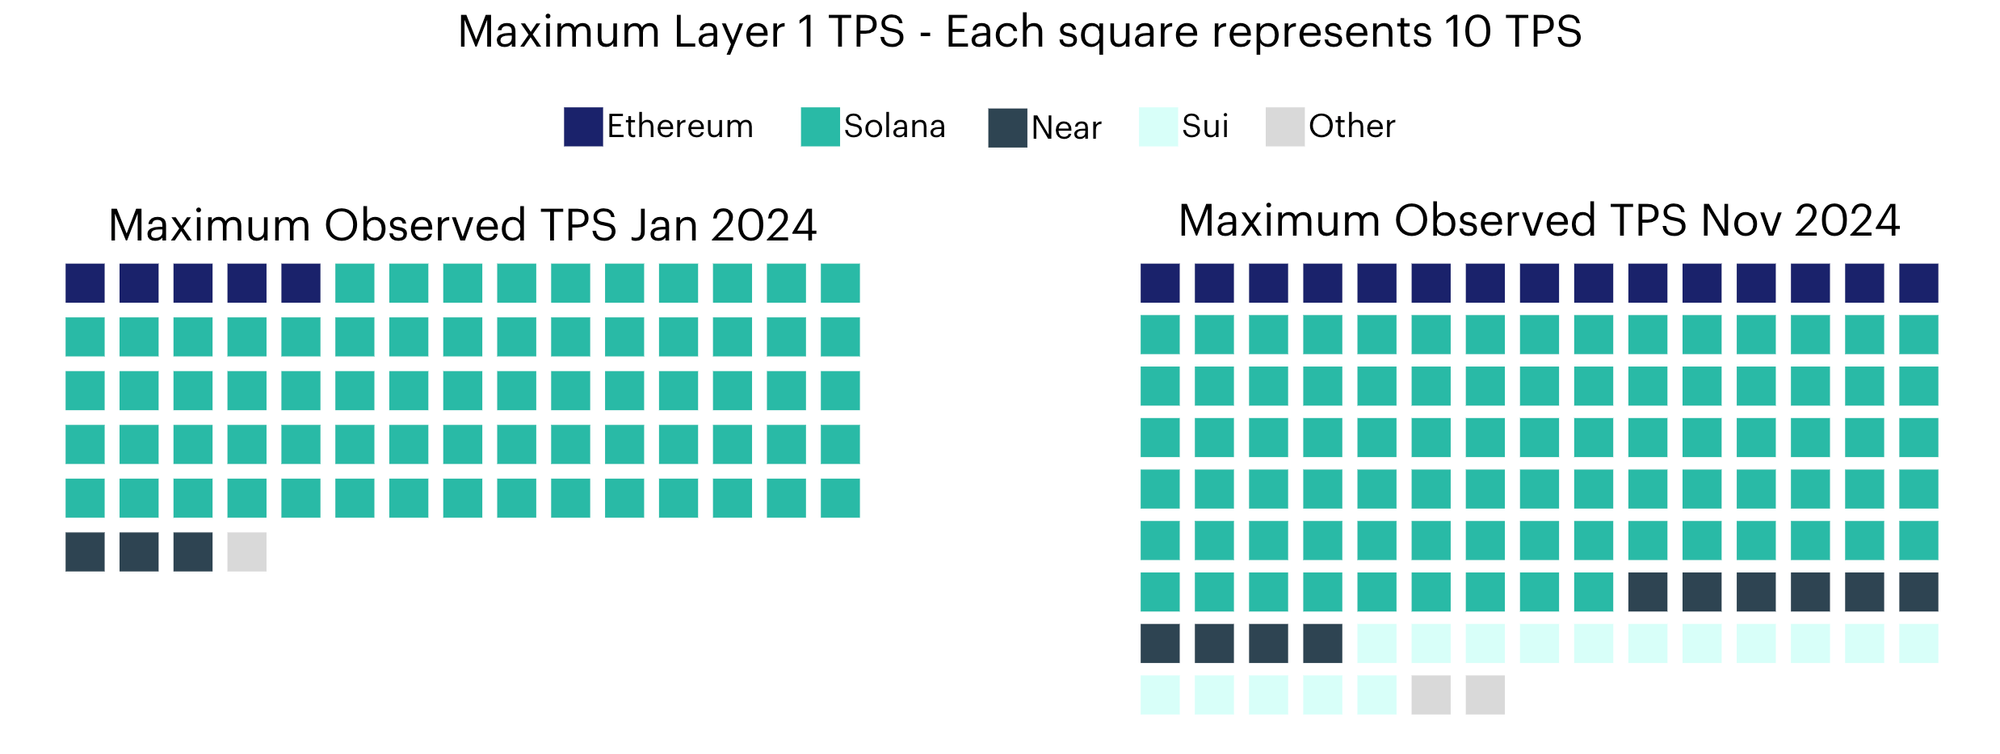
Programmable Layer 1 Blockchains Achieve 60% Scalability Boost
- Programmable Layer 1 blockchain protocols saw a surge in adoption during 2024, fueled by an influx of new users and ongoing protocol upgrades.
- By Q4, maximum transactions per second (TPS) across Web3 Smart Contract Index protocols reached 1,270 TPS, a 60% increase from the year’s start, showcasing significant scalability advancements.
- Enhanced throughput capacity demonstrates these blockchains’ readiness to handle growing transaction volumes, underscoring their maturity and readiness for broader adoption of distributed ledger technology.
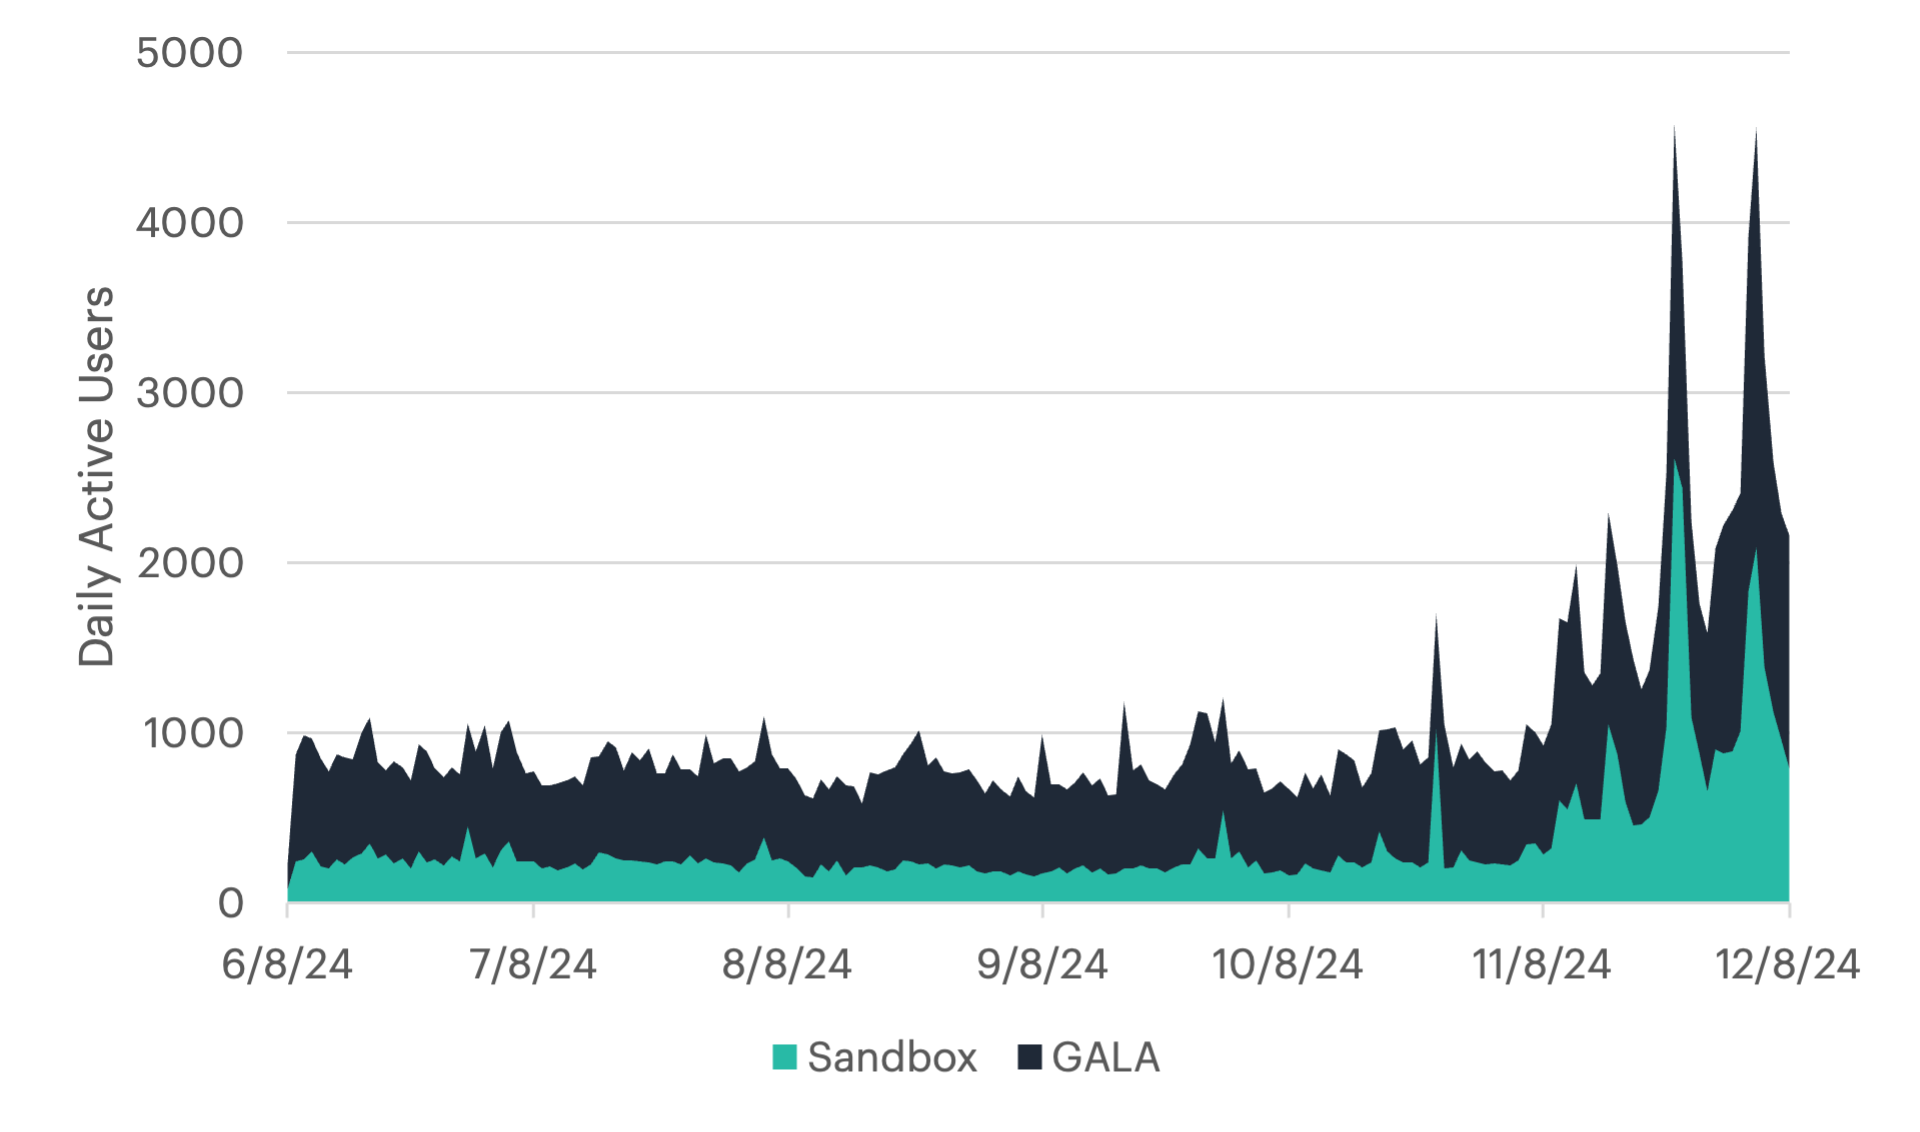
User Engagement Soars 315% Across Digital Culture Platforms
- Rising token prices drive increased user engagement, creating a feedback loop that boosts on-chain activity and encourages broader adoption, particularly in interactive sectors like gaming.
- In Q4, culture-focused tokens, especially gaming-related ones, outperformed other digital asset sectors, sparking significant user interest and activity.
- Gaming platforms such as The Sandbox and Gala reported a 315% average rise in daily active users from summer lows, highlighting the renewed interest and participation in digital culture and gaming ecosystems.
To read the full compilation report or a specific index's report, please click on the respective links below:
- Quarterly Attribution Report (PDF Version)
- CF Broad Cap Index Series
- CF Cryptocurrency Ultra Cap 5 Index
- CF Diversified Large Cap Index
- CF DeFi Composite Index
- CF Web 3.0 Smart Contract Platforms Index
- CF Digital Culture Composite Index
- CF Blockchain Infrastructure Index
Lastly, our Quarterly Attribution Reports are designed to help investors understand the performance of digital assets through a purpose-centric lens called the CF Digital Asset Classification Structure (CF DACS). To learn more about CF DACS, please utilize our interactive CF DACS Token Explorer.
Contact Us
Have a question or would like to chat? If so, please drop us a line to:
The information contained within is for educational and informational purposes ONLY. It is not intended nor should it be considered an invitation or inducement to buy or sell any of the underlying instruments cited including but not limited to cryptoassets, financial instruments or any instruments that reference any index provided by CF Benchmarks Ltd. This communication is not intended to persuade or incite you to buy or sell security or securities noted within. Any commentary provided is the opinion of the author and should not be considered a personalised recommendation. Please contact your financial adviser or professional before making an investment decision.
Note: Some of the underlying instruments cited within this material may be restricted to certain customer categories in certain jurisdictions.
Changes to the Token Market Price Benchmarks Series - Market Prices – 21 July 2026
The Administrator has confirmed changes to the Token Market Price Family for the period 14 July 2026 to 21 July 2026.

CF Benchmarks
Softer CPI Reprices July Hike Risk & Lifts Digital Assets
Digital assets extended their recovery over the past week as cooler US inflation prints repriced Fed expectations; the bid was broad across the large cap indices, growth factor leadership returned, stablecoin funding repriced lower, and stress stayed isolated in names hit by token-specific news.
Mark Pilipczuk
Notice of the Demising of CF Dai-Dollar Settlement Price and Spot Rate
The Administrator announces that it will demise the CF Dai-Dollar Settlement Price (DAIUSD_RR) and CF Dai-Dollar Spot Rate (DAIUSD_RTI) which are members of the CF Digital Asset Index Family.
CF Benchmarks
By clicking Accept, you consent to CF Benchmarks's use of cookies.
Visit Cookie Settings to learn how CF Benchmarks uses cookies and to adjust your preferences.