
Jul 28, 2025
CF Benchmarks Newsletter Issue 87
Ethereal
Over the last several weeks, Ethereum has been having a moment, and analysts suggest it could continue.
The circa 50% advance through July, so far, of CME Ether futures, which settle to CF Benchmarks’ CME CF Ether-Dollar Reference Rate (ETHUSD_RR) is emblematic of a confluence of constructive tailwinds facilitating the network in recent months.
A surge in spot ETH ETF demand in July has been another signal. The funds recorded $2.12 billion of inflows in the week ending July 19th, 2025 - including a daily high of $726.74 million on July 16th - marking their strongest weekly performance to date.
The significance of Ethereum’s ‘moment’ is underlined by the contrasting quality of the network’s recent historical backdrop. That was characterized by a multivalent weakening of sentiment and growth measures, especially relative to rival proof-of-stake layer-1 chains, like Solana. See a rough and ready comparison below.
Ethereum vs. Solana (6–12 month growth)
| Metric | Solana (SOL) | Ethereum (ETH) |
|---|---|---|
| Monthly Active Users | ~100M MAUs (surging) | ~1–3M MAUs (flat/falling) |
| Daily Active Users | ~5M DAUs | ~3M DAUs |
| DEX Volume Share | Doubled in 6 months | Shrinking |
| Unique Active Wallets | ~95M (up ≈40%) | ~1.6M (down ≈11%) |
| Price Growth (approx., 2024) | +120% | +39% |
| Price Growth (approx., 6M) | −30% (recent drag) | +9% |
| Staking Rate (%) | ~81% of supply | ~50%+ of reward yield |
| New dApps or Addresses | Growth outpacing Ethereum | Steady growth |
Sources: crypto.news, coinomist.com, analyticsinsight.net, supra.com
Network roots
While it's not particularly feasible (or even necessary) to pinpoint a single specific initial catalyst of what could be a sustainable broad-based turnaround, it’s worth noting Ethereum's key network upgrades earlier in the year: Dencun in March, and Pectra, in May.
These appeared to be pivotal in advance, and in hindsight, look critical.
Several improvements introduced under the above banners contributed to a strengthening narrative of improved protocol efficiency and network scalability (including transaction speeds and capacity) and, in turn, perceived institutional investability.
Some of the upgrades clearly feeding into the narrative are outlined below. (Note: this isn't an exhaustive list; click the links for greater detail).
Dencun
- Proto-danksharding (EIP‑4844) - lowered layer‑2 rollup fees by up to 90–99%
- SELFDESTRUCT hardening (EIP-4788 and EIP-6780) - better execution-layer security and consistency
- Various measures supporting accelerated layer‑2 growth and scalability, bolstering structural capacity
Pectra
- Combined execution layer (Prague) and consensus layer (Electra) upgrade, delivering the largest set of improvements since The Merge
- Account abstraction (EIP‑7702) – smart contract account control vs. externally owned accounts (utilized chiefly by private key) bringing greater flexibility and, potentially, increased user-friendliness
- Improved validator staking (minimum ramped from 32 ETH to 2,048 ETH) and structure (32 ETH increments abolished)
- Scalability measures, e.g., Verkle trees – ‘stateless clients’ that no longer require storage of the entire blockchain state
In other words, it’s more cogent to assess Ethereum’s equally multivalent ‘rebound’ against the backdrop of recent network improvements, with the macro tailwinds that followed (e.g., deteriorating USD, Fed pivot signals) plus increased regulatory clarity, laying the groundwork for constructive market sentiment, and in turn, bolstered ETH ETF flows.
Q3 2025 Outlook perspective
For an integrated and comprehensive explication of the roots of improving Ethereum sentiment, readers need look no further than the CF Benchmarks research team’s recently published Q3 2025 Outlook report.
It assesses and tentatively forecasts broad expectations for the overall digital asset economy, including its second-largest capitalized asset, Ether.

Recap
Recapping the overall crypto market performance of June, the report writers, Head of Research Gabe Selby, CFA, and Mark Pilipczuk, Research Analyst note:
“Bitcoin steadied around the six-figure mark, while total crypto-fund inflows topped $6.1 billion, led by renewed demand for Ethereum products and record open interest in CME ETH futures. Regulatory clarity also advanced: the GENIUS stablecoin bill cleared the Senate, and the SEC approved filings for a staking-enabled Solana ETF while reviewing multi-token baskets. These developments, together with continued institutional allocations, left digital assets better anchored heading into the third quarter, with regulatory progress helping to offset lingering macro and geopolitical headwinds.”
From Market Outlook Q3'25, page 4, ‘Market Recap’
Outlook
Projecting the further impact of the GENIUS stablecoin bill and of the accelerating crypto corporate treasury trend, the analysts also note:
“Stablecoins are going mainstream, and every on-chain transfer consumes native gas. Visa already lets merchant acquirers settle USDC on Solana, while the bulk of stablecoin activity occurs on Ethereum. Companies that use these rails must hold ETH or SOL in treasury to fund fees, a requirement that will place these assets on more corporate balance sheets. We are also seeing firms raise capital specifically to operate ETH and SOL treasuries. Both assets offer native staking yield and can be used as collateral in DeFi protocols, allowing companies to earn additional yield while enhancing protocol liquidity and security.”
From Market Outlook Q3'25, page 15, ‘A Corporate Balance Sheet Unlock’
The ‘corporate balance sheet unlock’ theme was also spotlighted more recently in a widely circulated commentary called ‘The Ethereum Demand Shock’, by Bitwise’s Chief Investment Officer, Matt Hougan:
... Since May 15, spot Ethereum ETPs have been on a tear, pulling in more than $5 billion. Corporations have also gotten into the game, with multiple firms announcing the creation of new Ethereum treasury strategies...All told, since mid-May, ETPs and public companies have combined to buy 2.83 million ETH—more than $10 billion at today’s prices, and 32x the increase in ETH’s supply over the same time period. No wonder the price of ETH has soared.
From ‘The Ethereum Demand Shock’, July 22nd, 2025
From demand to flows
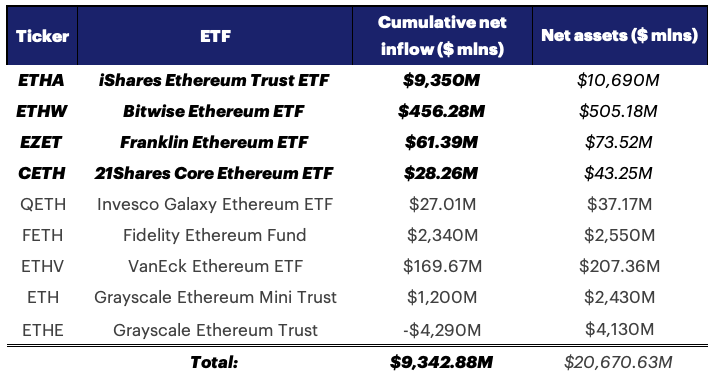
That upsurge of demand has been reflected by a marked acceleration of spot Ether ETF inflows in recent months. In their Q3 Outlook, the CF Benchmarks research team estimated 2025 inflows would be “close to $10 billion”.
That forecast had largely been achieved at the time of writing (nearing the end of July) as seen in the snapshot below. It shows cumulative net inflows into U.S. spot Ether ETFs since their inception in July 2024, together with each fund’s net assets.
U.S. spot ETH ETFs
Cumulative net inflows, net assets, as of July 25th, 2025
ETHUSD_NY emphasis
Note that the upper four entries denote high-profile ETFs for which our regulated CME CF Ether-Dollar Reference Rate – New York Varian (ETHUSD_NY) is deployed for NAV calculation.
Similar to the dominant proportion of total spot BTC ETF assets referencing our Bitcoin benchmark, BRRNY, ETHUSD_NY Assets under Reference (AuR) represent the largest single tranche of U.S. Ether AuR.
Again, just like for BRRNY, it’s cogent to expect increasing efficiency advantages from this concentration of liquidity.
ETH cash & carry opens
Meanwhile, following the general upswing in Ethereum fundamentals and the (largely) consequent positive price reaction, our Head of Research, Gabe Selby has also flagged that a further ETH market twist may be on the cards.
Similar to the emergence of a more persistent Bitcoin basis following the rapid establishment of spot BTC ETFs, Selby notes there are now signs of a clearer basis appearing within Ether’s institutional market.
Again, just like for Bitcoin, a wider Ether basis is making an ETH ‘cash and carry’ trade more attractive, Selby suggests:
“The increase in fund flows into the Ether ETFs just as we see record net short positions into corresponding CME futures contracts indicates that institutions are beginning to deploy the same market-neutral arbitrage strategies used in Bitcoin across other large cap digital assets.”
CF Benchmarks’ Head of Research, Gabe Selby, quoted by Bloomberg here.
(Put crudely, a ‘cash and carry’ trade consists of shorting an asset’s futures while buying the spot, aiming to profit from the difference.)
So long as current relatively calm and liquid market conditions prevail, even a record amount of short CME ETH futures positions doesn’t necessarily augur a disruptive overall Ether market pullback.
It can however, suggest the spot price could be ‘capped’ to some extent while the net short persists.
As such, now Ethereum has ‘come in from the cold’, anticipation of a widening basis, and the more active arb this attracts, could turn out to be another representation of the asset’s increasing maturity and stability.
For a deeper dive into Market Outlook Q3 2025, catch our latest podcast episode by clicking below.

To capture all CF Benchmarks research insights, subscribe here
The information contained within is for educational and informational purposes ONLY. It is not intended nor should it be considered an invitation or inducement to buy or sell any of the underlying instruments cited including but not limited to cryptoassets, financial instruments or any instruments that reference any index provided by CF Benchmarks Ltd. This communication is not intended to persuade or incite you to buy or sell security or securities noted within. Any commentary provided is the opinion of the author and should not be considered a personalised recommendation. Please contact your financial adviser or professional before making an investment decision.
Note: Some of the underlying instruments cited within this material may be restricted to certain customer categories in certain jurisdictions.
Changes to the Token Market Price Benchmarks Series - Market Prices – 21 July 2026
The Administrator has confirmed changes to the Token Market Price Family for the period 14 July 2026 to 21 July 2026.

CF Benchmarks
Softer CPI Reprices July Hike Risk & Lifts Digital Assets
Digital assets extended their recovery over the past week as cooler US inflation prints repriced Fed expectations; the bid was broad across the large cap indices, growth factor leadership returned, stablecoin funding repriced lower, and stress stayed isolated in names hit by token-specific news.
Mark Pilipczuk
Notice of the Demising of CF Dai-Dollar Settlement Price and Spot Rate
The Administrator announces that it will demise the CF Dai-Dollar Settlement Price (DAIUSD_RR) and CF Dai-Dollar Spot Rate (DAIUSD_RTI) which are members of the CF Digital Asset Index Family.
CF Benchmarks
By clicking Accept, you consent to CF Benchmarks's use of cookies.
Visit Cookie Settings to learn how CF Benchmarks uses cookies and to adjust your preferences.