
Jun 02, 2025
CF Benchmarks Newsletter Issue 83
'Suitcoiners'
The irony of Bitcoin volatility, apparently, transitioning to a far less aggressive phase than its widely recognized historical profile, during one of the most tumultuous geopolitical and U.S. political climates seen for several decades, is lost on no one paying attention. It’s a theme we’ve zoomed in on quite a bit around here lately.
Now, further corroboration is emerging in the form of startling data on Bitcoin’s most deeply entrenched foothold in the mainstream marketplace. That foothold is of course BlackRock’s iShares Bitcoin Trust ETF (IBIT), which utilizes our CME CF Bitcoin Reference Rate - New York Variant (BRRNY) as its benchmark.
IBIT is the largest spot Bitcoin ETF by assets in terms of assets under management (AUM). This arguably makes BRRNY the single most ‘systemically significant’ regulated crypto index, based on the volume of assets referencing it.
The volume of those assets stands above $72.4bn at the time of writing, having sprinted through the latest of several remarkable phases of expansion since IBIT was listed among the first brace of U.S. spot crypto ETFs in January 2024. (For a comparison, IBIT is now on a similar footing, in AuM terms, with the Invesco S&P 500® Equal Weight ETF. That holds assets of $73.5bn, having listed in April 2003).
The additional $6.4 billion IBIT amassed in May, another record monthly rate for the fund, places it among the fastest growing ETFs of the month invested in any asset class.
Bitcoin’s most recent apex is one obvious corollary. The BRR variant of CF Benchmarks’ Reference Rate, which supplies Bitcoin’s most trusted institutional price at the traditional London market close, 4 pm, notched the new record high at $110,941.32 on May 22nd. (Note, these regulated reference prices now span several time zones (BRR, BRRNY, BRRAP).
The peak followed an unequivocal updraft commencing April 9th; the date on which the White House announced a 90-day pause on the imposition of reciprocal tariffs.
Trump’s temporary tariff retreat also appears to have been the cue for the latest surge in demand for IBIT, quantifiably from institutional investors, according to a market structural expert quoted by Bloomberg here. The torrent may have received additional impetus late in the month as it emerged in recent days the US Court of International Trade was not inclined to endorse the propriety of ‘Liberation Day’ tariffs, though the ruling was temporarily suspended a day later at Federal court level.
IBIT vol. follows BTC's lower
Either way, this institutionalized FOMO is going hand in hand with cratering IBIT volatility, aligned with tamer variance observed in the underlying over the last few months.
IBIT’s 90-day rolling realized volatility has, like that of Bitcoin, been trending lower since the 90-day ‘pause’, to stand at its lowest ever by Friday night, at 46.48.
As Bloomberg’s Eric Balchunas points out, the tendency is for the relationship between the two metrics to behave like a flywheel under such conditions:
"The lower the volatility gets, the more bigger investors will bite who will help lower volatility even more. The same 'should' happen with correlation too. This is a direct result of the ‘suitcoiners.’”
Senior Bloomberg ETF Analyst, Eric Balchunas, quoted in Coindesk.
The day before, on X / Twitter, Balchunas, suggested these so-called ‘suitcoiners’ are seeking “digital gold, not a tech stock”; i.e., they’re looking for a way to capture the upside and defensive characteristics of the safe haven asset, gold, rather than chasing the other hypothesized guise of Bitcoin, its characterization as an asset analogous to a ‘FANGMA’ stock. (Ironically, of course, not all of those have been consistently more volatile than gold in recent years).
'Two Golds'
Regardless, Balchunas' observations do allude to a potential shift of the demand distribution between funds investing in 'the two golds'.
What’s generating that intrigue is that even with gold over 25% higher so far this year, the last several weeks have seen the typical pattern of gold and bitcoin fund flows – which of course usually favor the precious metal – flip.
As noted by this piece, and illustrated below, more than $2.8bn was drained from U.S. gold ETFs tracked by Bloomberg over the last five weeks. That compares with the $9bn which flowed into U.S. Bitcoin ETFs over the same period.
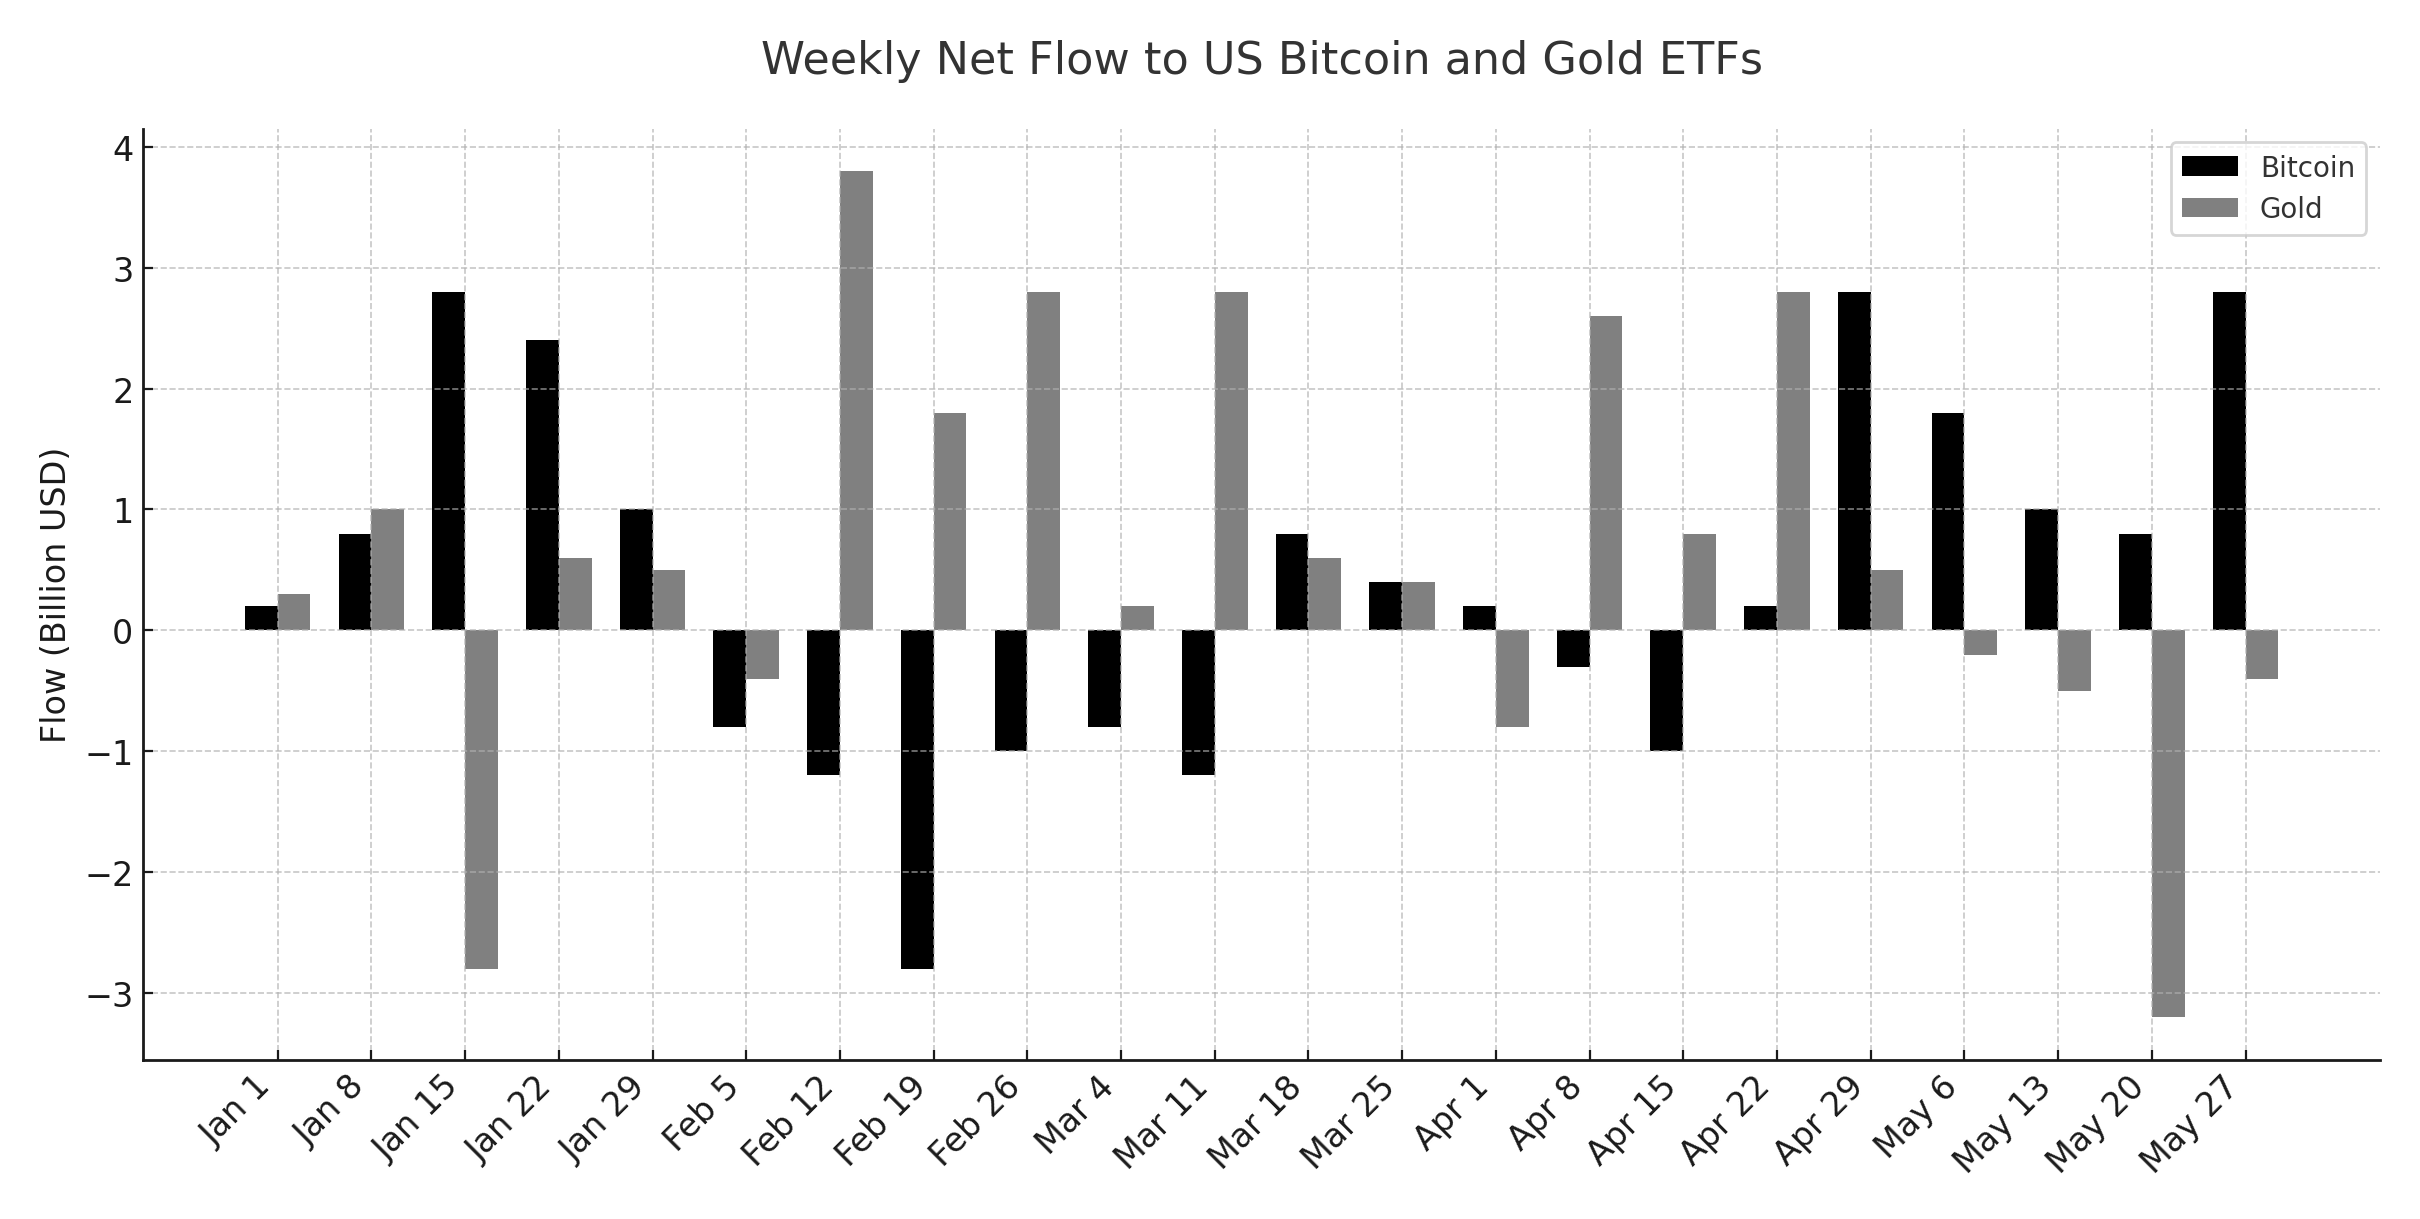
Five weeks of data don’t represent a paradigm shift. However, they do model what the ideological switch in investing perspectives long sought after and speculated by a tranche of Bitcoin proponents might look like, if sustained. We’ll need to check in on this hypothesis again, in more like 5 years, to know for sure.
What’s clearer already though, from readings like the recent gold/bitcoin ETF flows balance, tumbling IBIT volatility, and resurgent IBIT assets, is that institutional appetite for ‘digital gold’ cuts through the cycle in ways which were previously less certain.
There’s now even less doubt the institutional investment sphere has crossed a major Rubicon.
CF Benchmarks expands CF Staking Series with first regulated APT Staking indices
Clarity for APT staking rewards
CF Benchmarks is excited to announce the launch of the CF APT Staking Series as the latest addition to our CF Staking Series, a set of transparent and representative indicators of daily realized rewards associated with digital asset staking protocols.
The CF APT Staking Series is a range of indices within the CF Staking Series, providing measures of rewards for APT staking on its native blockchain, Aptos.
CF APT Reward Rate, Index and Blends
The CF APT Staking Series is comprised of the following key benchmarks:
- CF APT Staking Reward Rate (APT_SRR) – a daily calculation of the annualized percentage reward rate for staking APT
- CF APT Staked Return Index (APTUSD_SRIC) – a daily computation that captures the comprehensive total performance of staked APT, quoted in U.S. dollars
- CF APT Staking Blend Baskets (5 variants) – these represent the portfolio performance of specific ‘blends’ of staked APT assets, and non-staked APT assets. Assets in each variant are of fixed weight, and each blend is rebalanced quarterly
About Aptos: high speed, notable pedigree
Meta roots
Following its mainnet launch in 2022, the Aptos Proof-of-Stake (PoS) blockchain has garnered much attention, partly due to its origins, having been developed by Aptos Labs, a firm founded in 2021 by former Meta engineers who’d worked on the now defunct Diem project.
High speed
The network has also gained renown due to its competitive transaction speeds. The Aptos Foundation reported average 3-day observed peak transactions per second (tx/s) of approximately 6,200 in August 2024.
Potential
Aptos has also exhibited strong growth in terms of total value locked (TVL) which stood at around $1.3bn in late-May 2025, ranking the chain 10th by this measure. Meanwhile, user growth has also been impressive, with monthly active users of 15 million in Q1 2025 (ranking Aptos 4th). Aptos’ still modest free-float market cap, of about $3.3bn at the time of writing, suggests potential for considerable price upside should fundamentals continue to strengthen in the medium term.
The Regulated APT Staking Solution
Cogent choice
With continued growth across many metrics likely on the horizon for Aptos, and the increased institutional participation this will attract, APT is a cogent choice for the next set of CF Benchmarks Staking indices.
Just like for all our regulated benchmarks, CF APT Staking Reward Rate is designed to defray risks related to data reliability, accuracy, representativeness, and potential market manipulation, among other possible concerns.
Institutional assurance
As regulated benchmarks under the UK Benchmarks Regulation (BMR) framework, CF APT Staking indices aim to promote replicability, representativeness and manipulation resistance, assuring financial product providers engaging in non-custodial staking on the Aptos blockchain of the highest standards of market integrity and capital efficiency.
Featured Benchmark: CME CF XRP-Dollar Reference Rate (XRPUSD_RR)
Following the recent launch of CME Group's XRP futures, a step widely recognized as a typical prerequisite before U.S. crypto asset ETPs receive regulatory approval, we take the opportunity to spotlight our research team's introduction to XRP and its ecosystem.
The comprehensive primer produced by Head of Research, Gabe Selby, CFA and Research Analyst Mark Pilipczuk is, as usual, based on their expertise, experience and perspective as accredited institutional investment practitioners.
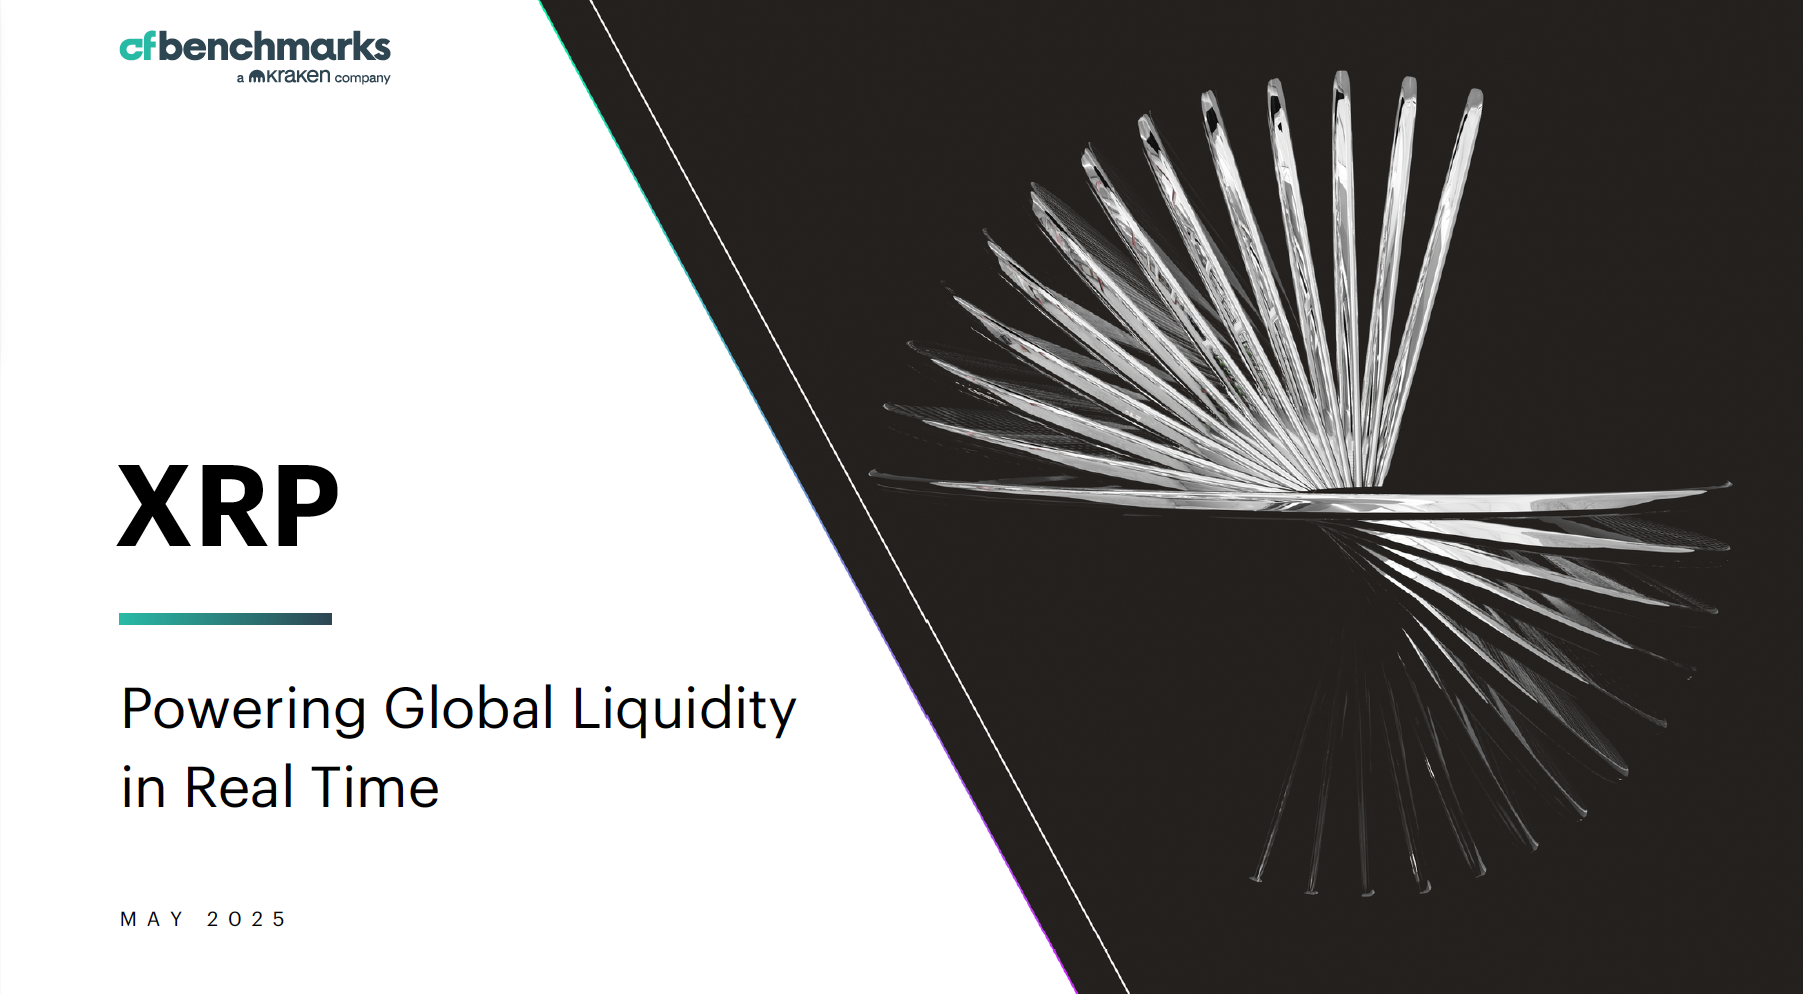
In straightforward terms, and clearly explained terminology, 'XRP: Powering Global Liquidity in Real Time', traverses the history, purpose and architecture of the fourth-largest digital asset by market capitalization.
Read the excerpts below, then click the link that follows to download the complete report.
XRP: Powering Global Liquidity in Real Time
By Gabe Selby, CFA, and Mark Pilipczuk
What is XRP?
XRP Powers Real-Time Settlement at Scale
XRP (XRP) is the native digital asset of the XRP Ledger (XRPL), designed to move value quickly and inexpensively across borders. It enables payment providers, banks and financial technology companies to convert one fiat currency into another without maintaining pre-funded nostro accounts. Transactions settle in 3-5 seconds, network fees are a fraction of a cent, and the ledger's energy requirements are negligible thanks to its lightweight XRP Ledger Consensus Protocol.
Key components of the XRP Ledger
XRP Ledger Consensus Protocol: A federated Byzantine agreement model where independent validators reach super-majority agreement on transaction order and validity every few seconds—finalizing payments quickly without Proof-of-Work or staking.
Validators & Nodes: Anyone can run a node; a smaller set of trusted validators participate in consensus, keeping the network decentralized yet performant.
On-Demand Liquidity (ODL): Ripple's enterprise product that leverages XRP as a bridge asset, eliminating the need for pre-funded accounts and enabling near-instant foreign exchange settlement.
Escrow & Token Burn: A cryptographic escrow releases up to 1 billion XRP per month to Ripple; unused amounts return to escrow, while each transaction permanently destroys a minuscule amount of XRP, making the supply mildly deflationary over time.
XRP's Role in a Digital Asset Portfolio
A Payment Solution with a Growing Market Position
XRP commands a market capitalization of nearly $150 billion, making up about 4.3% of the entire crypto market—a footprint comparable to the weight of a large-cap constituent in a blue-chip equity index. Just as investors hold mega-caps to anchor portfolios to broad market movements, treating XRP as a core digital-asset position can help a crypto allocation mirror overall market beta and minimize tracking error.
The table below represents the top-10 digital assets in the CF Broad Cap Index by free-float market capitalization, as of May 14, 2025.
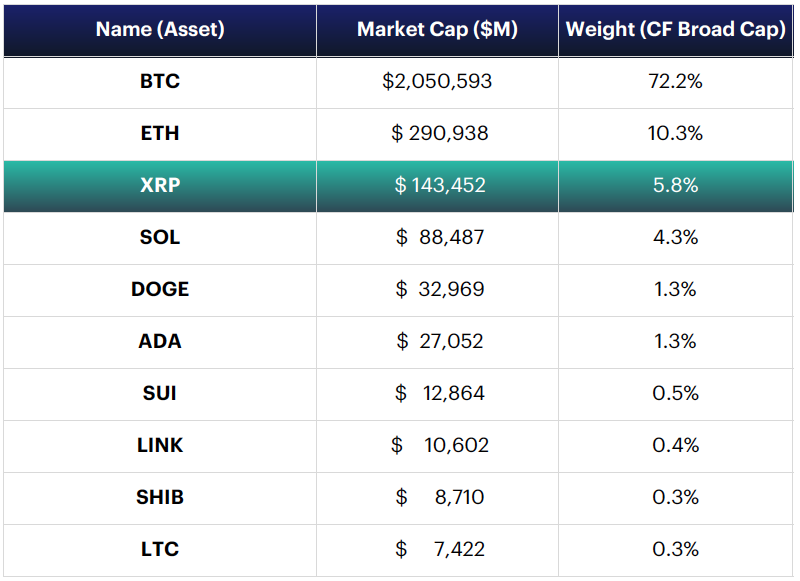
From an indexing standpoint, the logic is straightforward: cap-weighted indices assign importance in proportion to economic significance, and XRP's share of aggregate crypto value is too large to ignore. Allocating to XRP therefore captures a material slice of the market's payment-rail thesis, paralleling the way equity index funds include sector leaders to reflect the investable universe.
Beyond size, XRP benefits from deep liquidity, millisecond-level settlement times, and expanding enterprise adoption via Ripple's On-Demand Liquidity corridors, reinforcing its standing as a foundational asset. Incorporating XRP not only secures exposure to blockchain's utility for cross-border payments but also enhances portfolio representativeness in a manner analogous to owning a key large-cap stock within a diversified equity benchmark.
The information contained within is for educational and informational purposes ONLY. It is not intended nor should it be considered an invitation or inducement to buy or sell any of the underlying instruments cited including but not limited to cryptoassets, financial instruments or any instruments that reference any index provided by CF Benchmarks Ltd. This communication is not intended to persuade or incite you to buy or sell security or securities noted within. Any commentary provided is the opinion of the author and should not be considered a personalised recommendation. Please contact your financial adviser or professional before making an investment decision.
Note: Some of the underlying instruments cited within this material may be restricted to certain customer categories in certain jurisdictions.
Changes to the Token Market Price Benchmarks Series - Market Prices – 21 July 2026
The Administrator has confirmed changes to the Token Market Price Family for the period 14 July 2026 to 21 July 2026.

CF Benchmarks
Softer CPI Reprices July Hike Risk & Lifts Digital Assets
Digital assets extended their recovery over the past week as cooler US inflation prints repriced Fed expectations; the bid was broad across the large cap indices, growth factor leadership returned, stablecoin funding repriced lower, and stress stayed isolated in names hit by token-specific news.
Mark Pilipczuk
Notice of the Demising of CF Dai-Dollar Settlement Price and Spot Rate
The Administrator announces that it will demise the CF Dai-Dollar Settlement Price (DAIUSD_RR) and CF Dai-Dollar Spot Rate (DAIUSD_RTI) which are members of the CF Digital Asset Index Family.
CF Benchmarks
By clicking Accept, you consent to CF Benchmarks's use of cookies.
Visit Cookie Settings to learn how CF Benchmarks uses cookies and to adjust your preferences.