
Sep 18, 2020
An early look at the CF Benchmarks weekly newsletter
Inside
- Explained: our free-float market cap methodology
- Bitcoin’s market value back above $200bn
- bZx hacked yet again
Welcome to our world
The CF Benchmarks offices have been a hive of activity of late. Highlights include the launch of the world’s first authorised cryptocurrency benchmark index, The Ultra Cap 5 and the listing of the first ever euro-denominated Bitcoin benchmark. We also unveiled an index price agreement with BlockFi, the leading provider of crypto loans and interest-earning crypto accounts, plus we unveiled PAX Gold daily settlement and spot rates, pioneering the first 24/7, 365 days a year gold price for the Paxos Trust Company. The rest of autumn looks just as busy for us with more listings and deals in the pipeline and as we further refine our methodologies whilst continuing our ground-breaking research and development. The crypto world isn’t slowing down either. Quite the opposite, with ‘Ethereum 2.0’ increasingly on track for a 2020 launch, and Bitcoin recovering from its recent price swoon to resume its $200bn market cap as mainstream adoption accelerates. As such, we think now is the perfect time to launch our newsletter. Look out for it each week for updates on our indices and other products, plus news and thoughtful views about the markets we list.
bZx Hack No. 3
The decentralised lending and trading protocol bZx has been hacked again. Reports suggest its third–and largest security breach this year netted attackers $8m. That brings the total stolen from the platform, including two exploits in February, to almost $10m. It underscores the still-risky nature of DeFi products even as that industry continues to boom. The news also highlights something we pointed out last month - that serious questions around price integrity in the DeFi space persist, with evidence of gaps in crypto price verification of the kind our regulated benchmark indices address.
Bitcoin worth $200bn again
The original cryptocurrency has retaken a market capitalisation of about $200bn, just weeks after its deepest retracement for months saw it slide off a 2020 peak above $12,000 before bottoming within the nine-thousand-dollar range. There was little risk that BTC would lose its 75% weighting in our free-float capitalisation weighted benchmark, the Ultra Cap 5 Index, anytime soon. Its market-value rebound confirms it.
The Returns
Each week, we highlight a key crypto price return trend with a chart from our index page
Despite Bitcoin’s considerable correction off August’s 2020 highs, CF Benchmark’s Bitcoin Reference Rate, published daily, shows its return trend for the year remains intact. XBT-USD has recouped a year-to-date gain of more than 40% though remains below its best 2020 return of more than 60%. 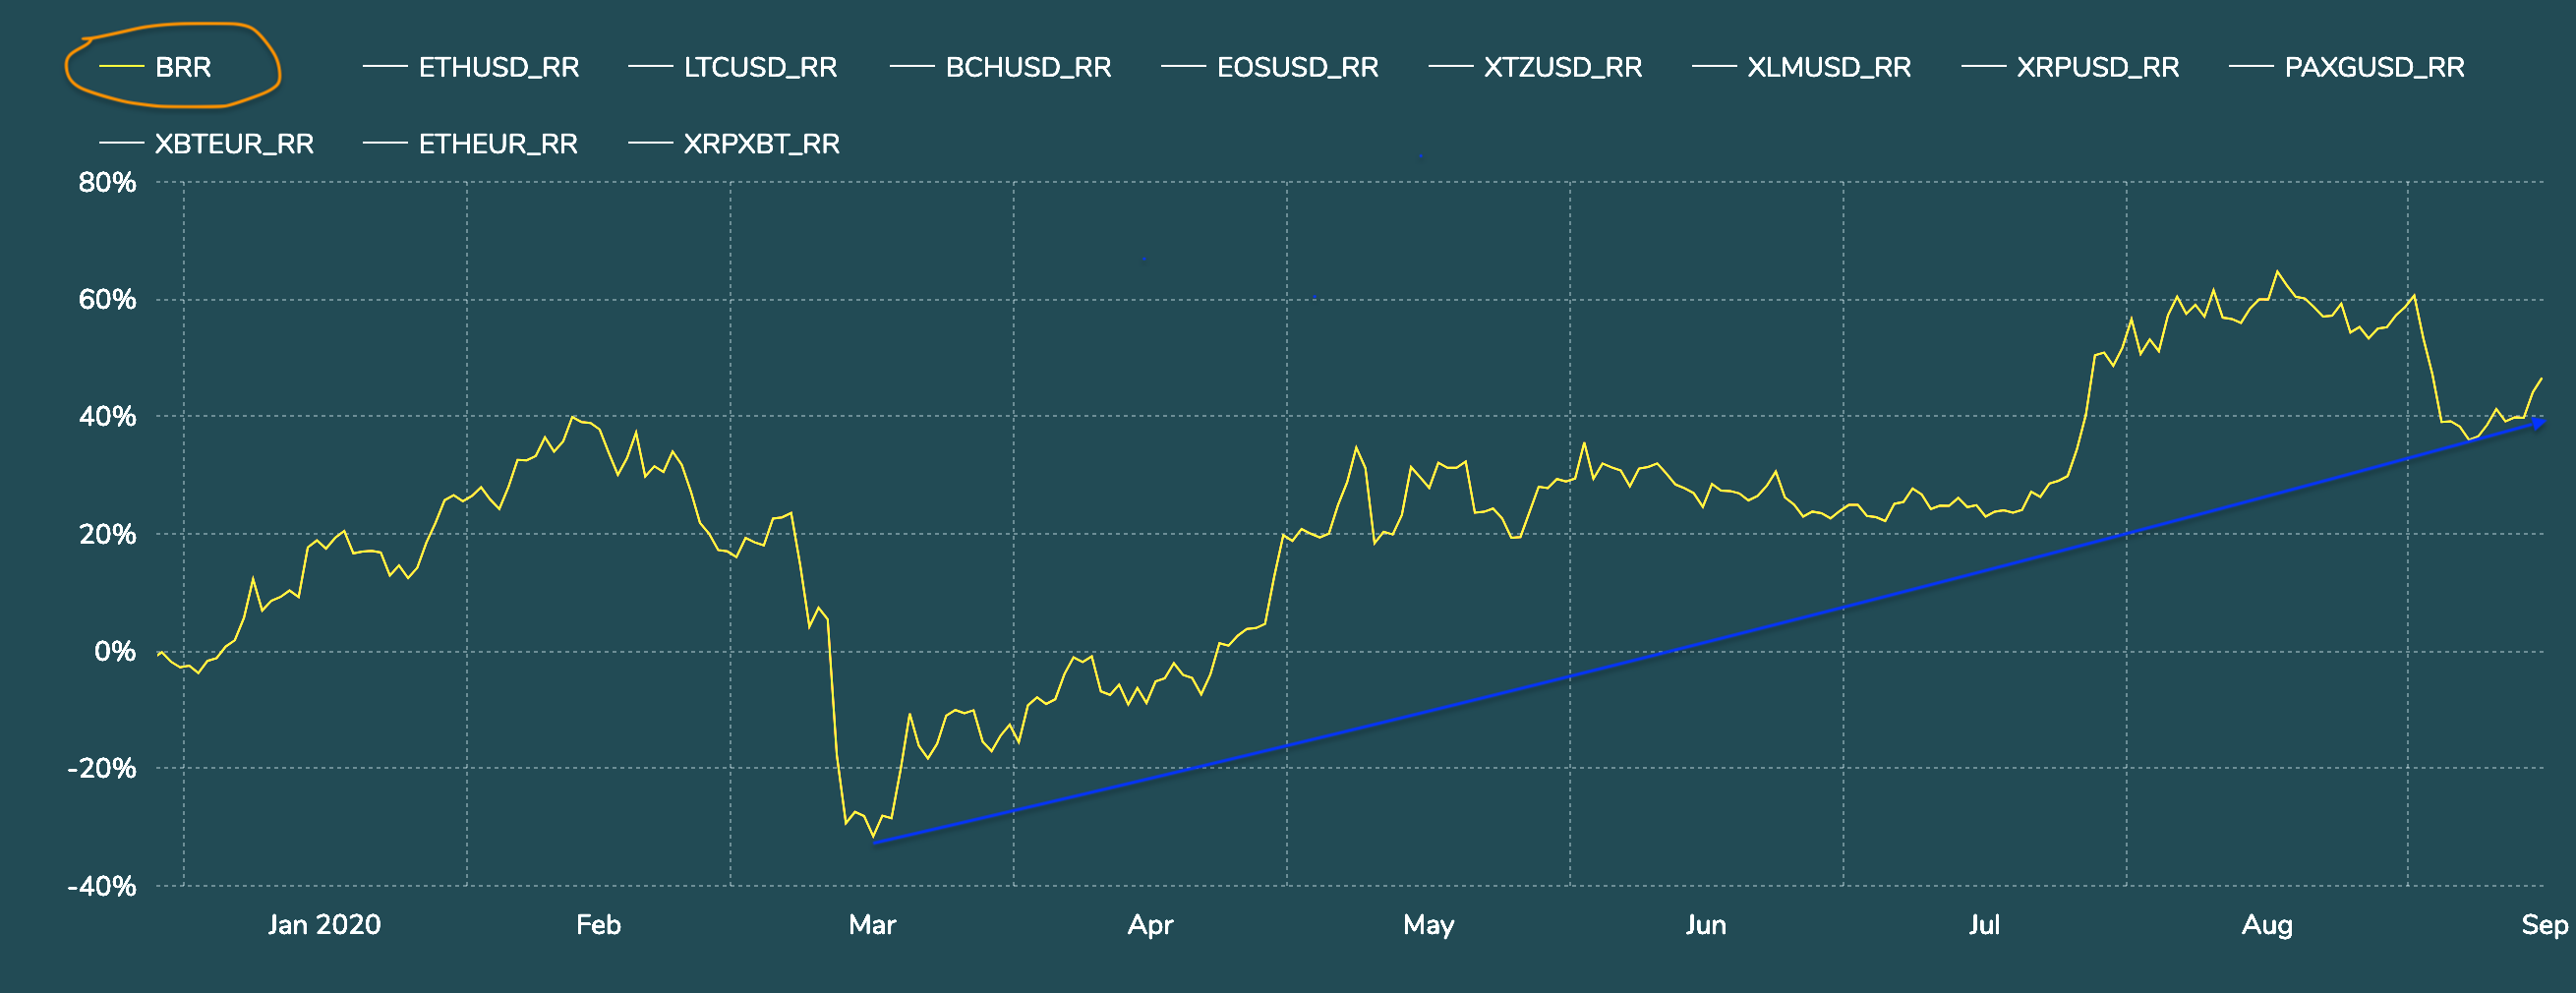 CF Benchmarks’ Bitcoin Reference Rate rebased to January 2020
Featured benchmark: CF Cryptocurrency Ultra Cap 5
Crypto Market-Cap Concerns solved - ‘FUD’ not so much
‘FUD’ is unlikely to dent rising crypto interest - so the time for institutions to address their free-float and fungibility worries is still now
This FUD too, will pass
The crypto world, known for an abundance of slang terms, predictably has one for sentiment accompanying price swoons, like the one seen in recent weeks. FUD, or ‘fear uncertainty and doubt’, speaks for itself, after major coins followed Bitcoin’s week-long trend of rapidly handing back months of significant gains. Even after firmer trading in the last few days, the dominant cryptocurrency continues to flirt with the ‘psychological’ $10,000 level, just weeks after reaching a peak for the year above $12,000. At times, the loss from that top exceeded 20%. 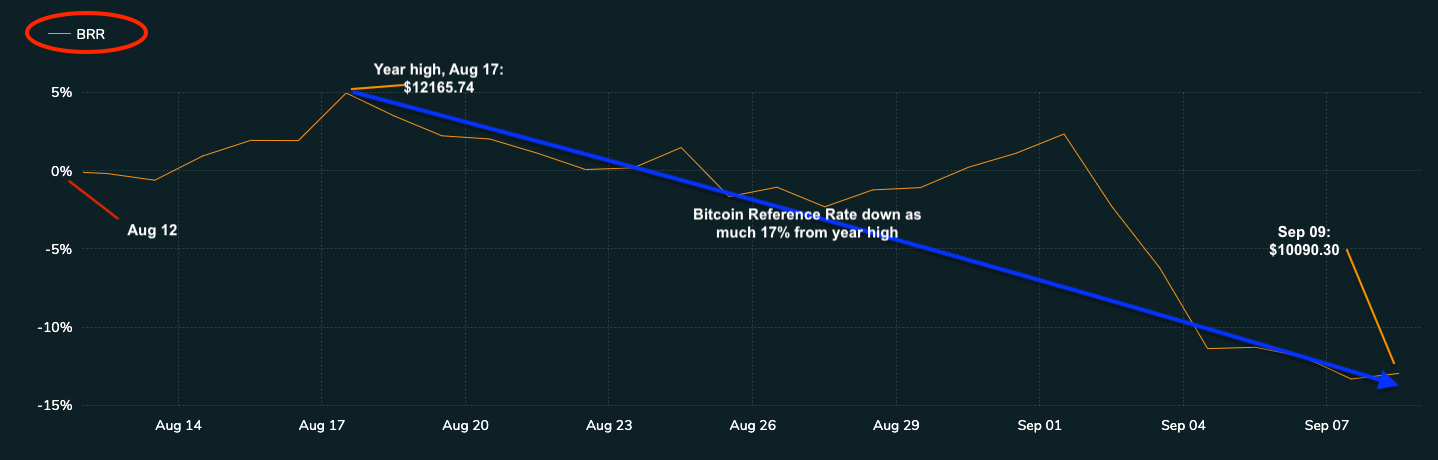 Figure 1. Rebased chart: CME CF Bitcoin Reference Rate – 09-09-2020
That’s the crypto markets for you. Traders focusing on this notoriously volatile asset class face far more angst than their mainstream-market counterparts. And during times of enhanced FUD, the beating of chests and gnashing of teeth that typically overflows from social-media and messenger spheres is not particularly limited to the inexperienced.
Still, it tends to be the full extent of the hand wringing. After all, if there’s one thing that participants in this market get used to quickly—it’s volatility. With cryptos infamously hypersensitive to geopolitical and social events, as well as latterly being in highly correlated with equities, buyers learn the hard way to expect the ‘unexpected’. Or they get out. In other words, logic that says the latest pullback will barely dent underlying bullish longer-term crypto sentiment looks compelling.
So, while some asset managers already invested in digital assets may be considering reduced allocations, many—and their clients—will be undaunted. Some will even see an opportunity to buy at discounts that didn’t exist just days ago. Indeed, there’s little evidence that broader dramas of the year have significantly dampened Wall Street’s and Main Street’s growing interest in the digital asset class. Note that a June Fidelity Digital Assets survey of 800 U.S. and European institutional investors showed 6 out of 10 believed digital assets had a place in their investment portfolios, compared with 36% already invested in them. That came just three months after one of the crypto market’s most cataclysmic-seeming (at the time) collapses, when Bitcoin plunged 50% in just one day. Read the rest of this article on our website
The information contained within is for educational and informational purposes ONLY. It is not intended nor should it be considered an invitation or inducement to buy or sell any of the underlying instruments cited including but not limited to cryptoassets, financial instruments or any instruments that reference any index provided by CF Benchmarks Ltd. This communication is not intended to persuade or incite you to buy or sell security or securities noted within. Any commentary provided is the opinion of the author and should not be considered a personalised recommendation. Please contact your financial adviser or professional before making an investment decision.
Note: Some of the underlying instruments cited within this material may be restricted to certain customer categories in certain jurisdictions.
Factor Friday - July 24, 2026
Beta's four-week grind higher stalled this week as style leadership rotated again: Momentum took the top spot, last week's leader Value fell to the bottom, and Growth stayed July's weakest factor. Size remains the only style factor positive on the year; beta, not style selection, is setting returns.

Mark Pilipczuk
Changes to the Token Market Price Benchmarks Series - Market Prices – 21 July 2026
The Administrator has confirmed changes to the Token Market Price Family for the period 14 July 2026 to 21 July 2026.
CF Benchmarks
Softer CPI Reprices July Hike Risk & Lifts Digital Assets
Digital assets extended their recovery over the past week as cooler US inflation prints repriced Fed expectations; the bid was broad across the large cap indices, growth factor leadership returned, stablecoin funding repriced lower, and stress stayed isolated in names hit by token-specific news.
Mark Pilipczuk
By clicking Accept, you consent to CF Benchmarks's use of cookies.
Visit Cookie Settings to learn how CF Benchmarks uses cookies and to adjust your preferences.