
Dec 18, 2025
Building Bitcoin Capital Market Assumptions
A Practitioner's Framework for Strategic and Tactical Allocations
Bitcoin's institutional evolution requires sophisticated capital market assumption (CMA) frameworks that incorporate quantitative modeling, macroeconomic analysis, and strategic allocation principles. Our comprehensive framework establishes a three-model architecture supporting both strategic (1-10 year) and tactical (sub-1 year) investment horizons through comparative valuation, production economics, and Bitcoin's sensitivity to monetary debasement. Institutional surveys indicate that a large majority of investors believe in the long-term value of blockchain and digital assets, with a significant portion expecting to increase their allocations to digital assets and related products over the next two years. Going forwad, capital market assumption frameworks will be critical for making prudent asset allocation decisions.
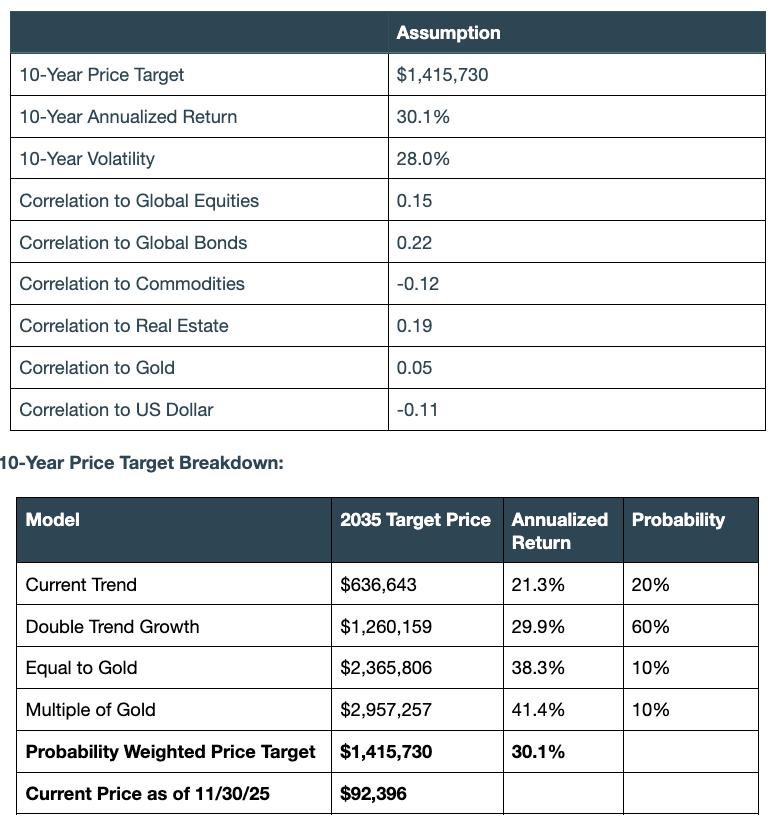
In summary, our modeling framework supports a base-case long-term price target of $1.42 million per Bitcoin by 2035, driven by Bitcoin capturing roughly one-third of the growing global store-of-value market. At the same time, volatility is projected to continue its structural decline, falling toward 28% over the next decade as liquidity deepens, institutional participation expands, and derivatives markets mature. This combination of high expected returns, moderating volatility, and persistently low correlations positions Bitcoin as a compelling addition to a multi-asset portfolio. Even at 2–5% portfolio weights, Bitcoin improves long-term risk-adjusted returns and expands the efficient frontier.
Our 2026 Capital Market Assumptions
I. Return Assumptions Frameworks
Understanding Bitcoin's Return Profile
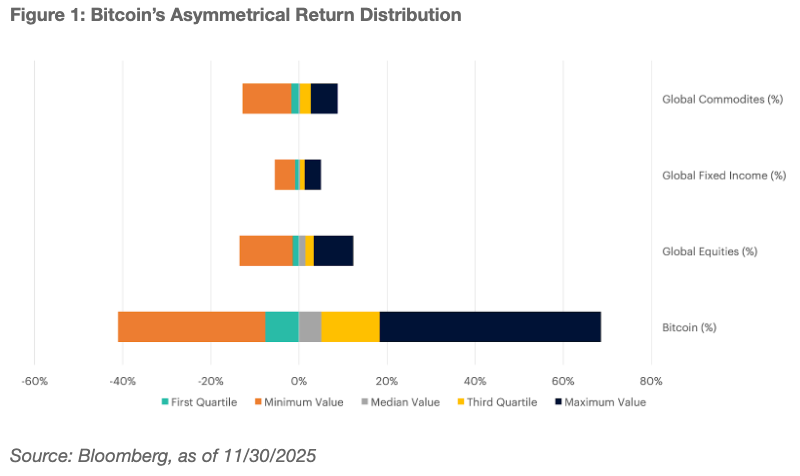
Bitcoin's historical returns are not well described by a simple "average return" narrative. Outcomes have been highly dispersed, with a small number of outsized upside periods driving a meaningful share of long-term performance. That asymmetry matters for investors because it changes how we think about timing, position sizing, and rebalancing: missing a handful of strong months can dramatically reduce long-run results, while the path can include deep drawdowns that challenge governance. In this paper, we translate that reality into a forward-looking framework by anchoring long-horizon assumptions in structural drivers (adoption and monetary conditions) rather than extrapolating short-window performance. The goal is not to predict month-to-month moves, but to build a defensible range of long-term outcomes and connect them to explicit economic assumptions.
What Macroeconomic Variables Influence Bitcoin’s Price
Our framework treats Bitcoin as an asset that is meaningfully exposed to macro liquidity conditions, particularly broad money growth and the risk appetite that tends to accompany it. In practice, that means Bitcoin often behaves differently across regimes: liquidity expansions have historically supported higher beta behavior, while tightening cycles can compress multiples and increase drawdown risk. We incorporate this through a liquidity lens using global money supply as a practical proxy for "available risk capital" and then translate that into expected return ranges rather than point forecasts. Importantly, macro sensitivity is not the whole story: adoption, market structure, and network effects also matter. But adding macro variables improves investor intuition by tying outcomes to observable conditions that investment committees already monitor.
The Comparative Market Capitalization Valuation Framework
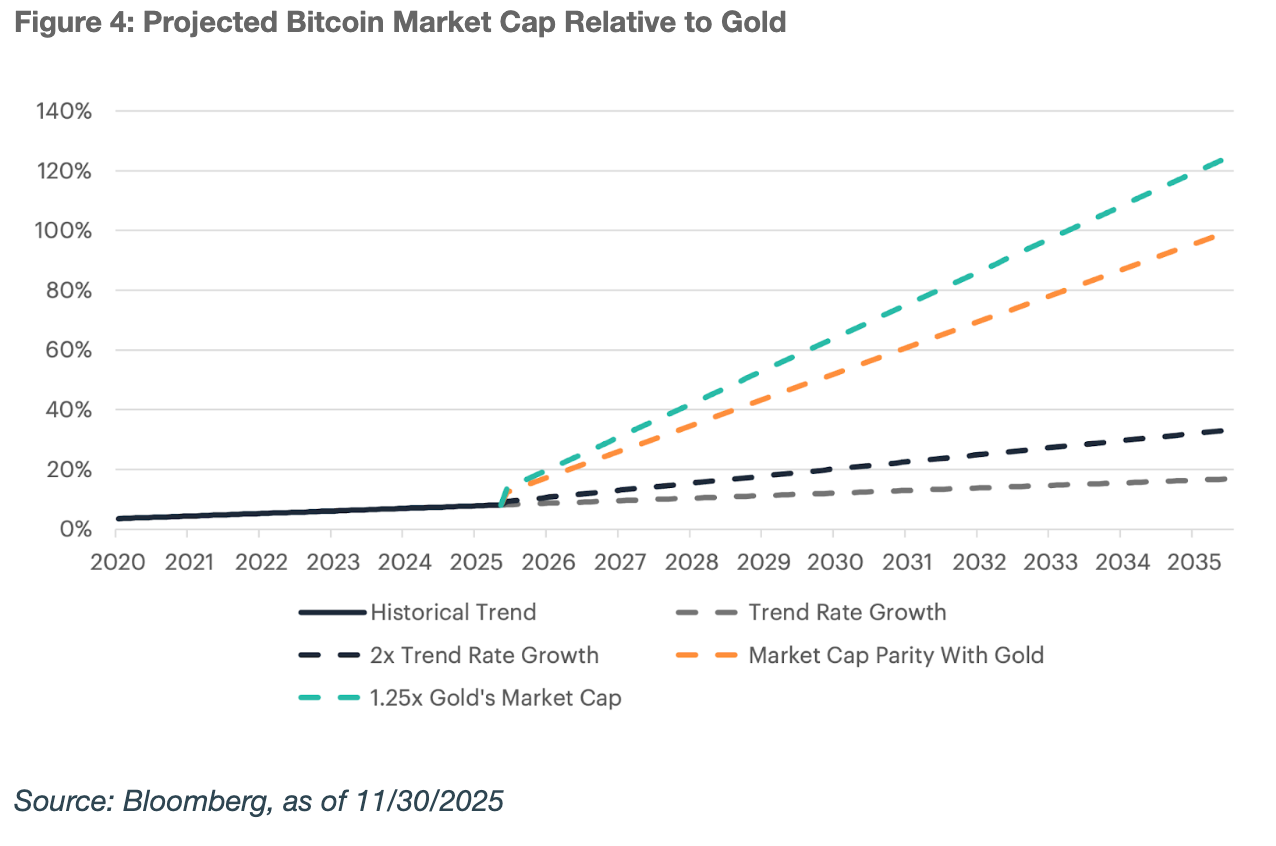
The first return model uses a comparative valuation approach that links Bitcoin's long-term value to its potential share of the global store-of-value market. Conceptually, the question is simple: if Bitcoin continues to monetize as a store of value, what portion of store-of-value wealth (often proxied by gold and related pools) could it reasonably capture over time? We translate adoption paths into market-cap outcomes and then into price targets by explicitly modeling supply. This structure is useful because it connects return expectations to a narrative investors understand (market share) while forcing discipline around key assumptions: the size and growth of the competing store-of-value market, the speed of adoption, and the terminal market share under different scenarios. The output is a scenario range (bear/base/bull) that can be probability-weighted for planning.
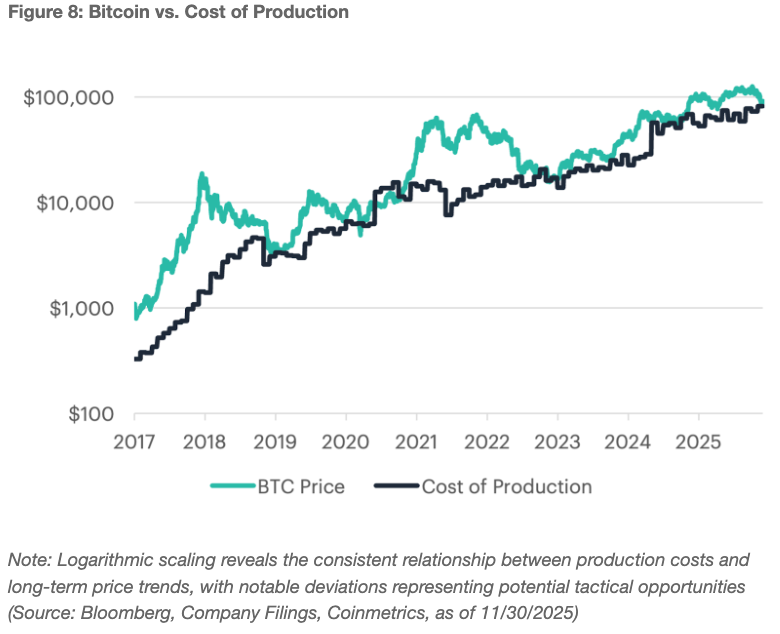
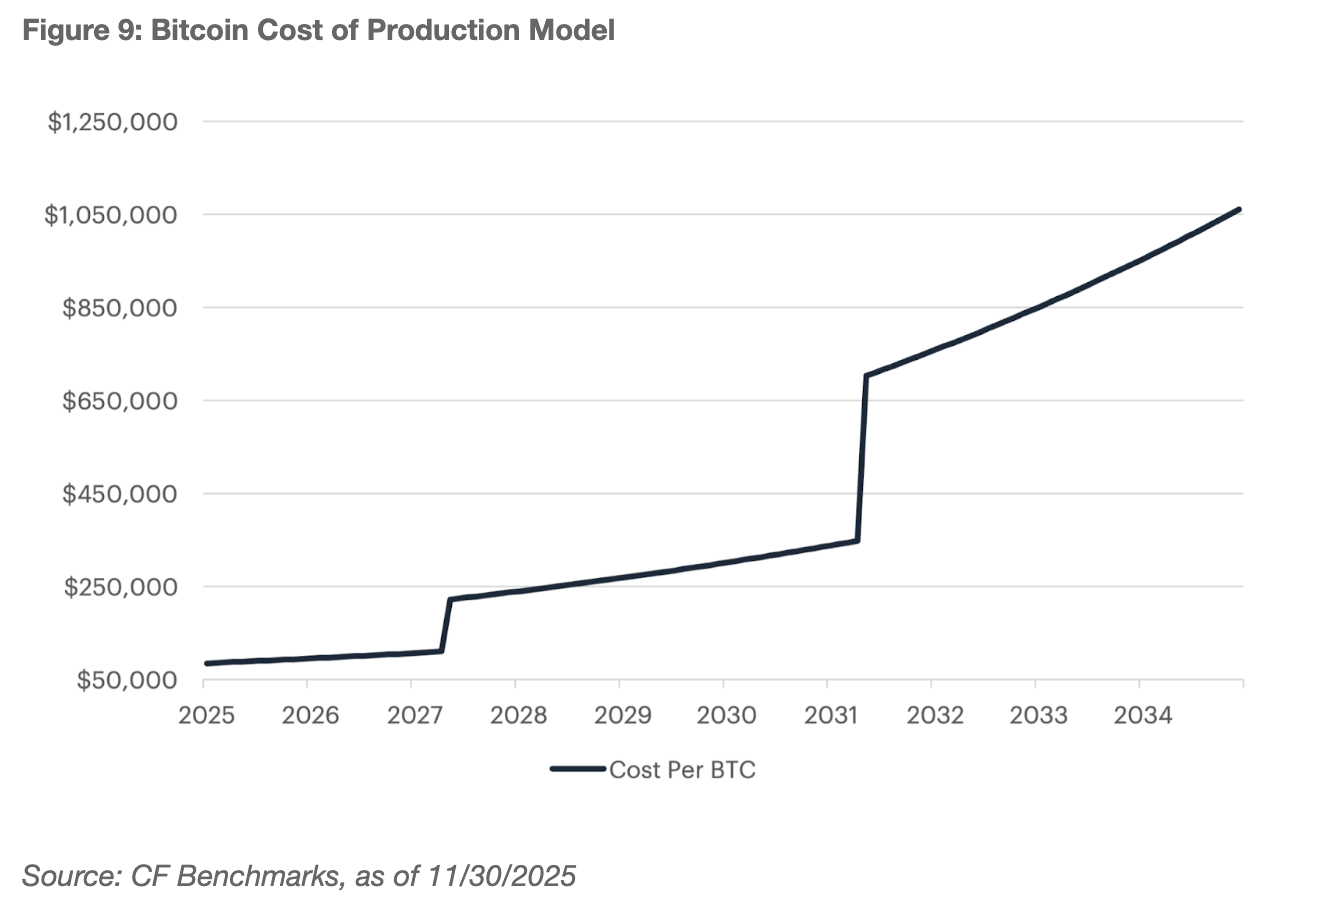
The Cost of Production Valuation Framework
The second model anchors value in production economics, using Bitcoin’s cost of production as a structural reference point. Over full cycles, prices have often interacted with production cost because mining is the mechanism that converts real-world energy and capital into new supply. When prices fall far below aggregate production cost, miners tend to curtail, leverage unwinds, and selling pressure can diminish. When prices rise materially above cost, profitability increases and supply pressure from miners can rise. We model production cost using inputs investors can understand: network hashrate, miner efficiency, electricity cost assumptions, and the scheduled decline in issuance. This framework does not claim cost equals price, but it provides a discipline for identifying regimes where price is structurally cheap or expensive versus underlying network economics—helpful both for long-horizon anchoring and risk management.
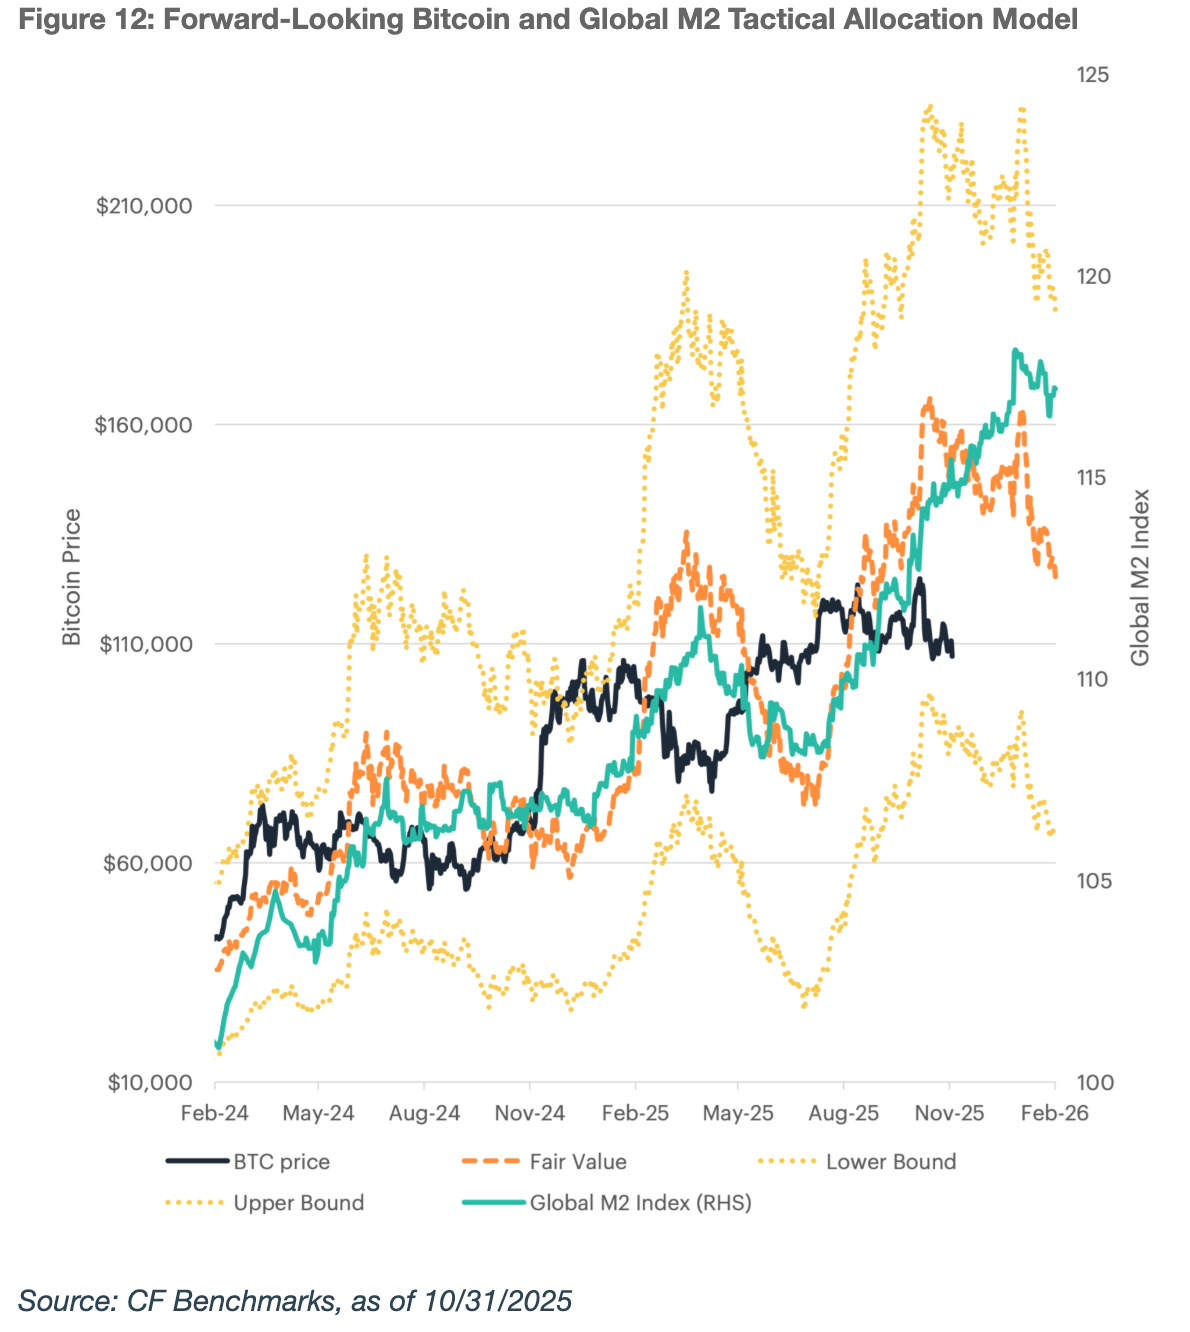
Tactical Model Framework: Macro Relationships and Policy Transmission
In addition to strategic models, we include a tactical overlay that links Bitcoin to global liquidity conditions through a regression-based "fair value" framework. The intuition is that when global money supply expands, financial conditions ease and marginal demand for risk assets rises; when liquidity contracts, the opposite tends to occur. The model estimates a fair value level for Bitcoin based on observed M2 dynamics (often with a lag), and then frames outcomes in bands that reflect uncertainty rather than a single number. We use this as a timing and sizing input, not as a trading signal in isolation. When price is materially above the upper band, prospective returns may be lower and risk higher; when price is below the lower band, forward returns may improve. The value of the tactical model is governance: it converts macro intuition into repeatable decision rules.
II. Risk Framework: Volatility Compression and Correlation Dynamics
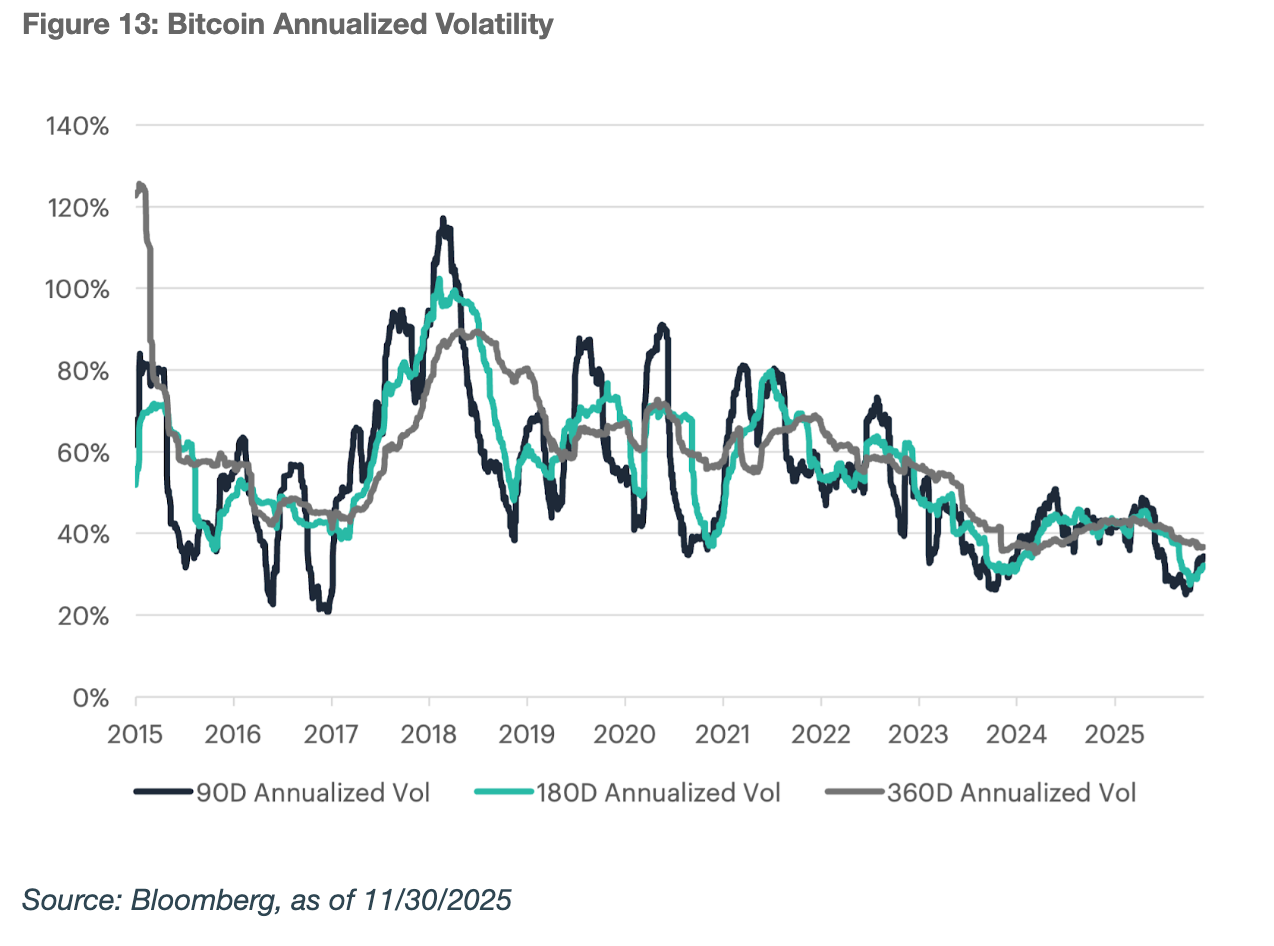
Volatility: history, drivers, and target
Bitcoin's volatility has historically been high, but it has not been static. As market structure has matured (spot and derivatives liquidity deepened, custodial rails improved, and participation broadened), volatility has shown signs of compression over time. This is consistent with how other emerging asset classes evolve: early markets are dominated by leveraged, reflexive flows, while later markets benefit from deeper liquidity, tighter spreads, and more two-sided positioning. In the report, we translate this trend into a forward-looking volatility assumption and a clear target range rather than assuming the past repeats. Key drivers include market depth, institutional adoption, options market development, and reduced reflexivity as the investor base diversifies. Volatility still spikes in liquidity shocks, but the baseline can decline structurally, which is important for portfolio risk budgeting and expected Sharpe ratios.
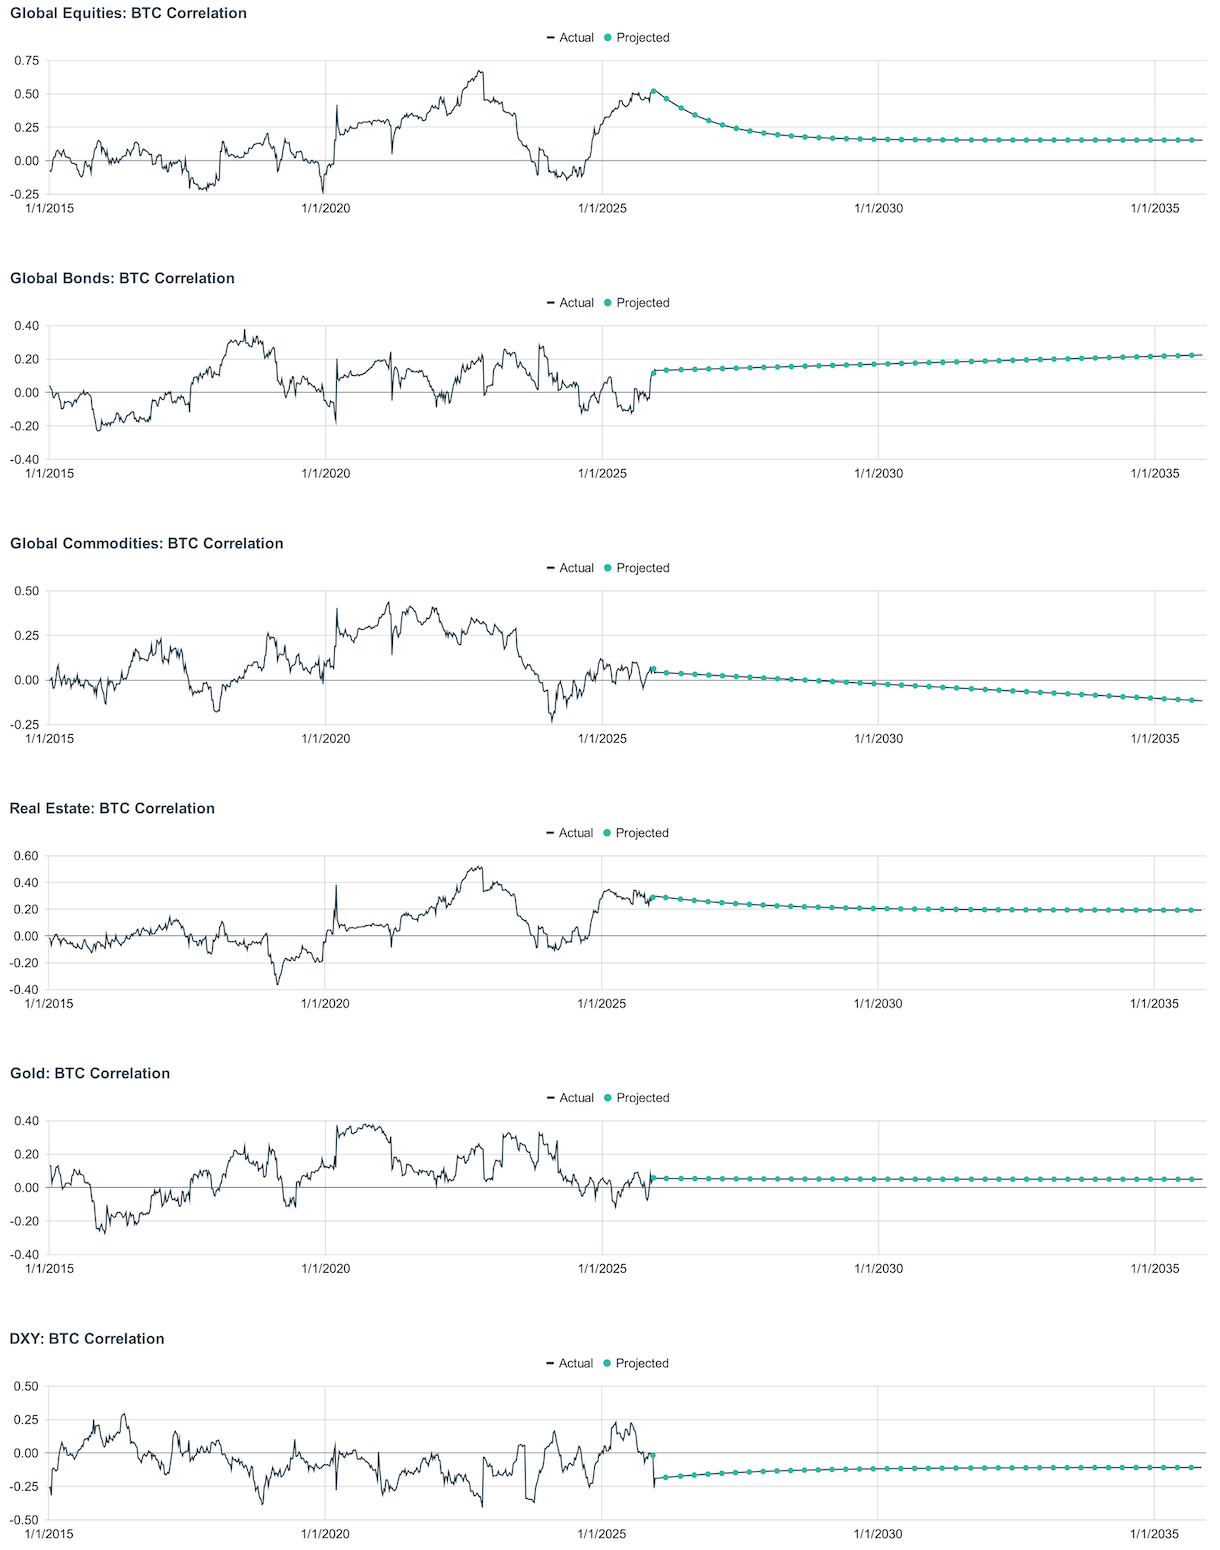
Dynamic Correlation Patterns
Our long-term correlation framework combines current market behavior, Kalman-filter projections, and practitioner judgment. The result is meant to be a flexible baseline rather than a single set of fixed inputs. Bitcoin's correlation with global equities is currently elevated at 0.52, but our 10-year assumption declines to 0.15 as liquidity-driven co-movement moderates and the investor base broadens. Correlation to global bonds is 0.14 today and is projected to rise to 0.22, which implies occasional co-movement in certain macro regimes, but still limited linkage to traditional interest-rate cycles. Bitcoin's correlation to commodities is low at 0.04 and is projected to fall to –0.12, consistent with distinct drivers and no direct physical supply-demand exposure. Real estate correlation declines from 0.30 to 0.19, gold remains near zero at 0.06, and the U.S. dollar stays modestly negative from –0.26 to –0.11. Overall, these assumptions support Bitcoin's diversification role while acknowledging moderate sensitivity to equity risk and liquidity.

III. Implementation Strategy and Portfolio Construction
Portfolio Construction Implications and Sizing Methodology
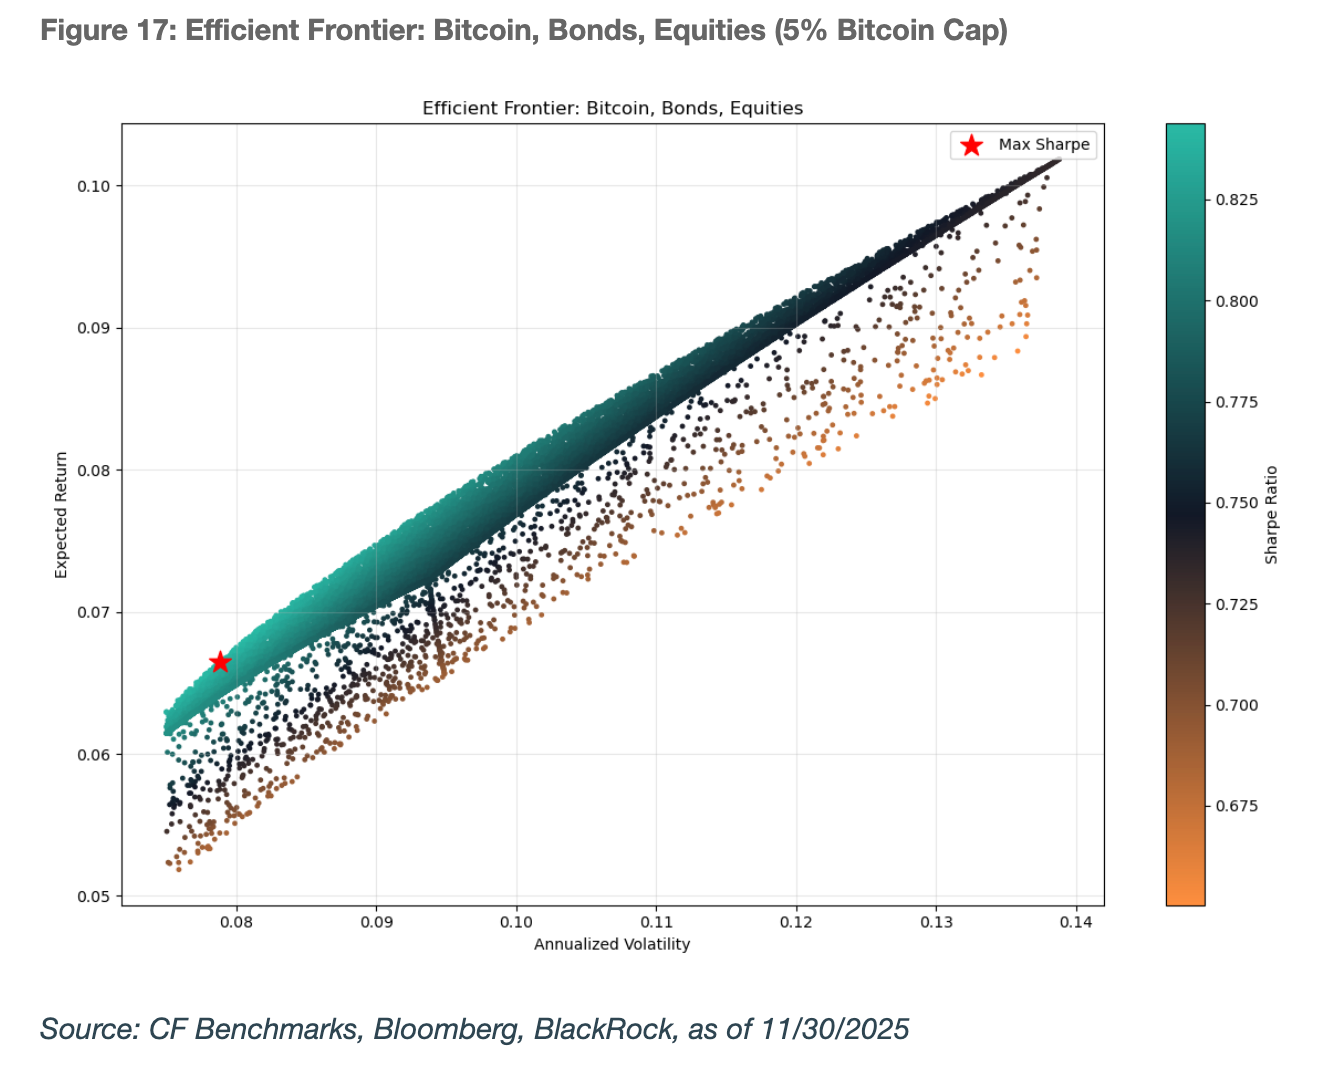
We translate the return and risk framework into an asset allocation case study: a diversified portfolio that includes a 5% Bitcoin sleeve. The objective is not to "bet the farm," but to test whether a modest allocation can improve long-run risk-adjusted outcomes under reasonable assumptions. At 5%, Bitcoin is large enough to matter in strong upside regimes, but small enough that drawdowns remain governable within a multi-asset framework, especially with disciplined rebalancing. We discuss how this allocation affects expected return, volatility, and correlation-driven diversification, and we frame implementation as an institutional workflow: define strategic weights, set risk limits, choose vehicles (spot holdings, ETFs, or fund structures), and establish rebalancing and governance rules. The takeaway is pragmatic: position sizing and process matter as much as the return forecast.
IV. Conclusion: The Strategic Allocation Imperative
Practitioners can apply a multi-model framework for capital market assumptions that integrates comparative valuation, production economics, and monetary-liquidity dynamics. Together, these approaches suggest that Bitcoin's long-term value is supported by its growing share of the global store-of-value market, the structural linkage between market price and production cost, and its sensitivity to global money-supply trends. As institutional participation deepens, volatility is likely to continue compressing, while Bitcoin's exposure to monetary debasement supports persistently low correlations to most major asset classes, enhancing portfolio diversification.
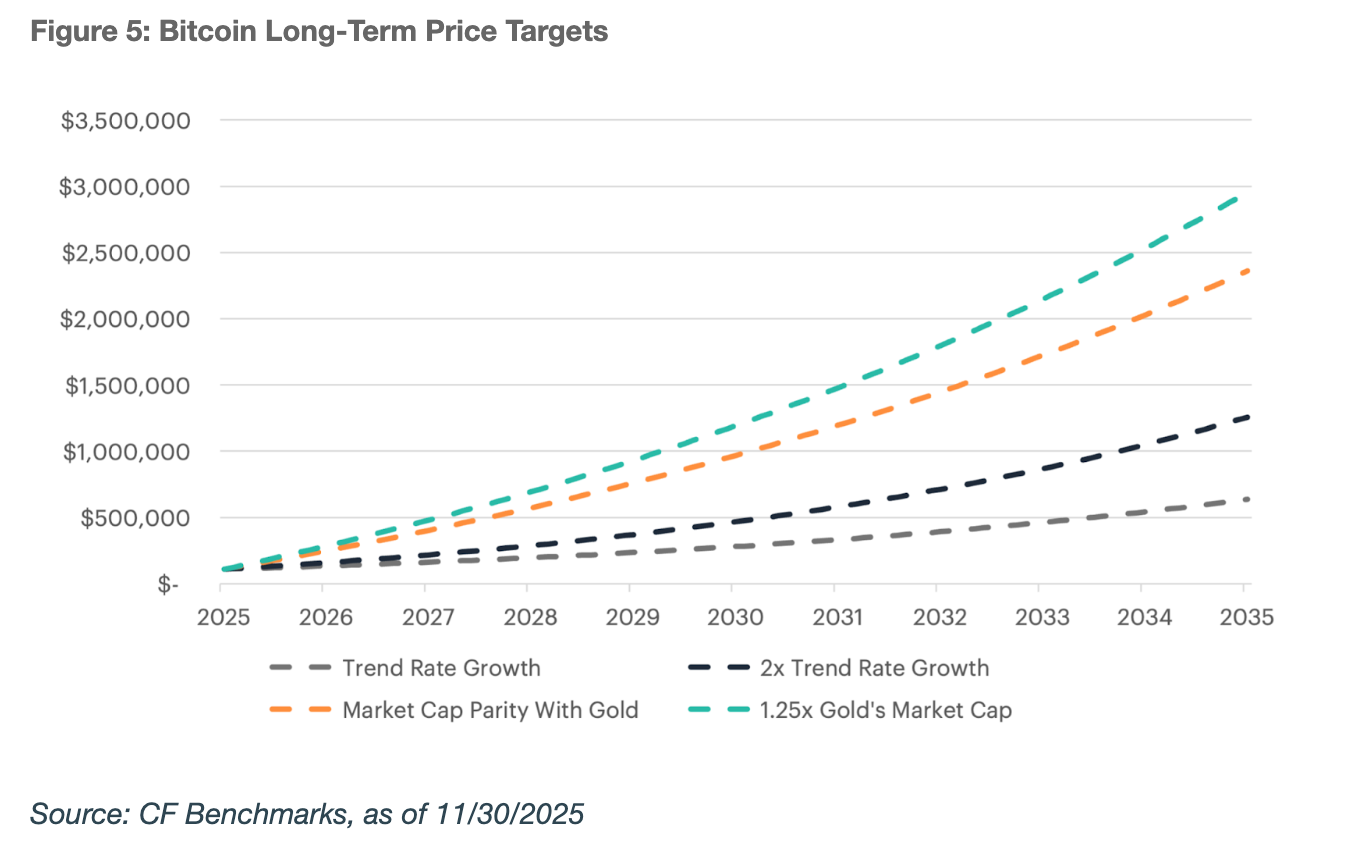
Improving regulatory clarity, rising institutional acceptance, and deepening spot and derivatives liquidity continue to strengthen Bitcoin's investability. Applying the valuation frameworks outlined above, we derive the following long-term price outcomes for Bitcoin by 2035, reflecting differing adoption paths within the store-of-value market.
- Base Case: $1.42 million by 2035 (Probability-Weighted) – The base case reflects a probability-weighted blend of adoption scenarios, assigning a 60% probability to double-trend growth, 20% to trend continuation, and 10% each to parity with gold and outperformance. This framework implies Bitcoin captures approximately 33% of gold's market capitalization, producing a price target of $1.42 million and an expected annualized return of 30.1%.
- Bear Case: $637,000 by 2035 – Bitcoin captures store-of-value market share at its historical trend rate, reaching approximately 16% of gold's market capitalization amid slower but sustained adoption.
- Bull Case: $2.95 million by 2035 – Bitcoin becomes the dominant global store of value, absorbing investment flows from gold and reaching roughly 125% of its market capitalization, driven by accelerated institutional and sovereign adoption.
Across scenarios, a strategic allocation of 2-5% improves portfolio efficiency meaningfully. In our simulations, Bitcoin's high expected returns, declining volatility, and low correlations with equities and bonds expanded the efficient frontier, enabling higher return targets at comparable or lower levels of risk. Institutions that develop robust capital market assumptions for Bitcoin will be better positioned to size, rebalance, and manage exposure as the asset class continues to mature.
To read the full report , please click on the respective link below:
Building Bitcoin Capital Market Assumptions Report (PDF Version)
The information contained within is for educational and informational purposes ONLY. It is not intended nor should it be considered an invitation or inducement to buy or sell any of the underlying instruments cited including but not limited to cryptoassets, financial instruments or any instruments that reference any index provided by CF Benchmarks Ltd. This communication is not intended to persuade or incite you to buy or sell security or securities noted within. Any commentary provided is the opinion of the author and should not be considered a personalised recommendation. Please contact your financial adviser or professional before making an investment decision.
Note: Some of the underlying instruments cited within this material may be restricted to certain customer categories in certain jurisdictions.
Factor Friday - July 31, 2026
July's rally has stalled, with the Market factor flat at +0.02% and its four-week gain down to +0.48% from +7.13%. Momentum led a second straight week at +1.96%, its first back-to-back run since late May, while Growth reversed to +1.74% and Value fell to the bottom at -1.93%.

Mark Pilipczuk
Changes to the Token Market Price Benchmarks Series - Market Prices – 28 July 2026
Changes to the Token Market Price Benchmarks Series - Market Prices – 28 July 2026
CF Benchmarks
Digital Assets Absorb Hawkish Repricing Ahead of the FOMC
Digital assets traded through a hawkish macro surprise this week but closed mostly higher, with breadth holding across major names and indices. Sector leadership traced to a single regulatory catalyst, not a broad rotation, and implied volatility stayed firmer than realized into the weekend.
Mark Pilipczuk
By clicking Accept, you consent to CF Benchmarks's use of cookies.
Visit Cookie Settings to learn how CF Benchmarks uses cookies and to adjust your preferences.