
Sep 14, 2026
BTC Gives Back Gains After CPI Print
Weekly Index Highlights, September 7-13, 2026
A hotter-than-expected core Consumer Price Index (CPI) print released last Friday repriced Federal Reserve rate-hike odds for the September 15-16 meeting from near 60% to above 80%. Bitcoin (BTC) initially spiked toward $79,837 on an in-line headline CPI figure before reversing below $77,000 as the market absorbed the hotter core inflation print. The reversal erased the prior week’s gains and coincided with more than $732 million in crypto liquidations and the largest weekly spot Bitcoin ETF outflow in ten weeks.
Digital assets gave back ground across the broad market, with diversified-weight indices losing more than their free-float counterparts and Infrastructure recording the weakest DACS sub-category average. Ether held close to flat while other major assets declined, with the prior week’s DeFi leadership also reversing. BTC funding rates fell much further than USDT rates, even as realized volatility rose faster than implied volatility, showing that weaker spot performance and cheaper funding coexisted with the repricing of Fed rate expectations.
Market Performance Update
Single-asset trading this week centered on Friday's data release. A hotter-than-expected core Consumer Price Index (CPI) reading on the morning of September 11 repriced Federal Reserve rate-hike odds for the September 15-16 meeting from near 60% to above 80%. Bitcoin (BTC) initially spiked toward $79,837 on the in-line headline CPI figure before reversing below $77,000 as the core inflation and sentiment misses set in, a round trip that coincided with more than $732 million in liquidations.
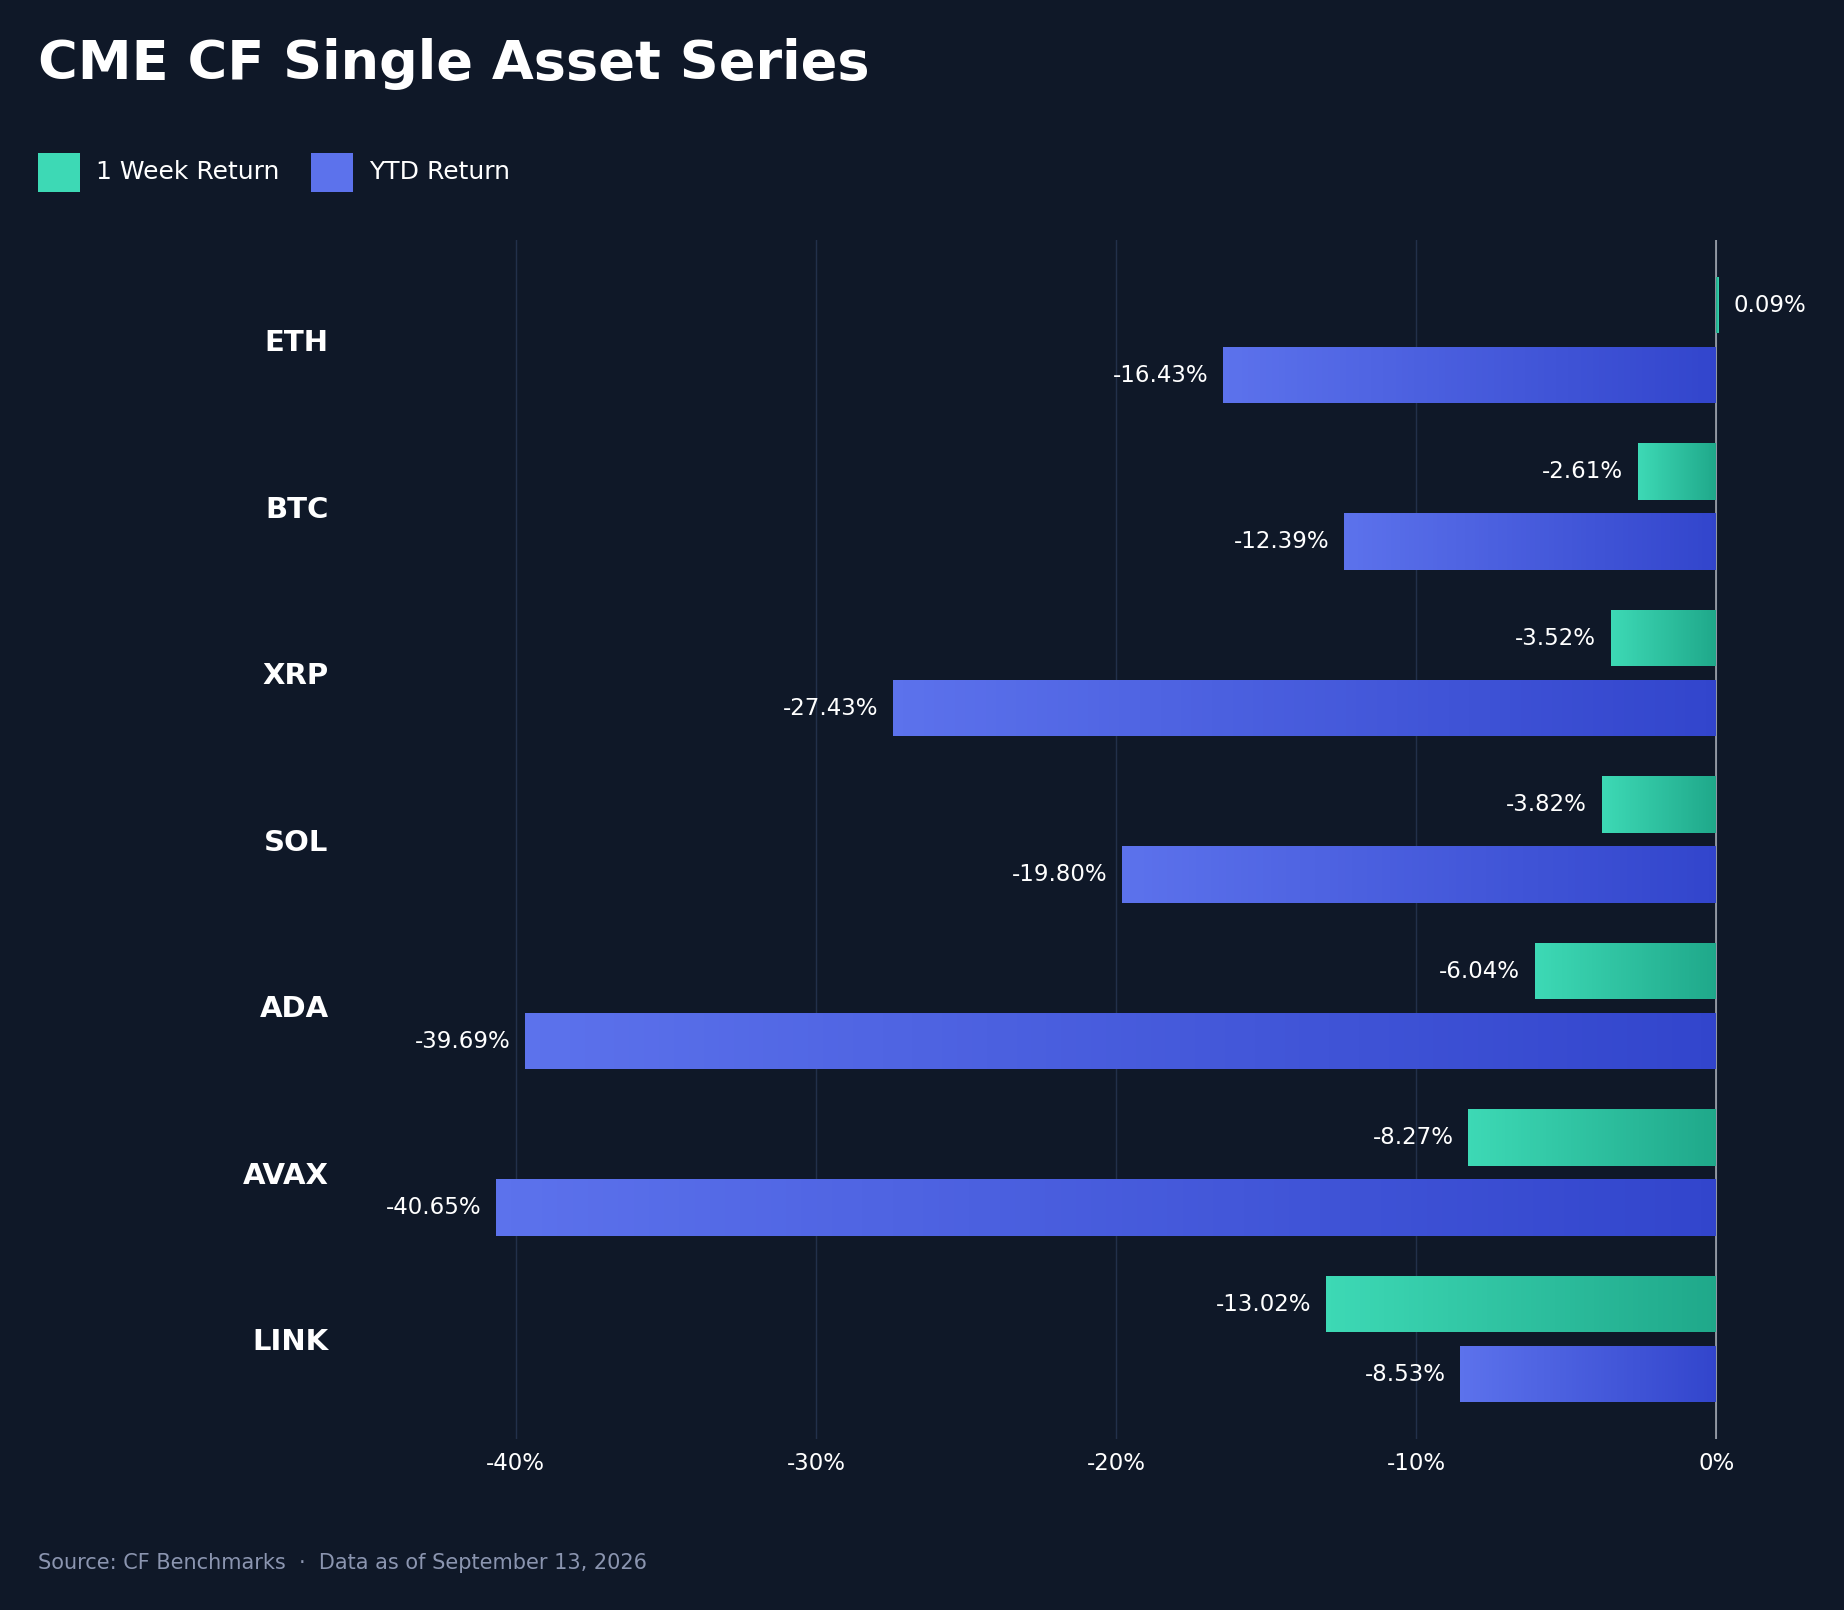
The CF Single Asset Series moved from an all-positive prior week to six declines across the seven-name set from September 7 to September 13. Ether (ETH) was the sole exception at +0.09% week-on-week (w/w), leaving its year-to-date (YTD) return at -16.43%. BTC fell 2.61% (YTD -12.39%), followed by XRP at -3.52% (YTD -27.43%), Solana (SOL) at -3.82% (YTD -19.80%), Cardano (ADA) at -6.04% (YTD -39.69%), Avalanche (AVAX) at -8.27% (YTD -40.65%), and Chainlink (LINK) at -13.02% (YTD -8.53%).
The range between ETH and LINK widened to 13.11 percentage points (pp), from 10.26 pp a week earlier. LINK also registered the largest deterioration in weekly performance, with a 21.99 pp swing from its prior +8.98%, while ADA moved from first place a week earlier to the lower half of the ranking. ETH's resilience limited weakness at the largest end of the market, but losses extended across the rest of the series. Every asset remained negative YTD, with AVAX and ADA carrying the deepest cumulative declines.
Volatility Analysis
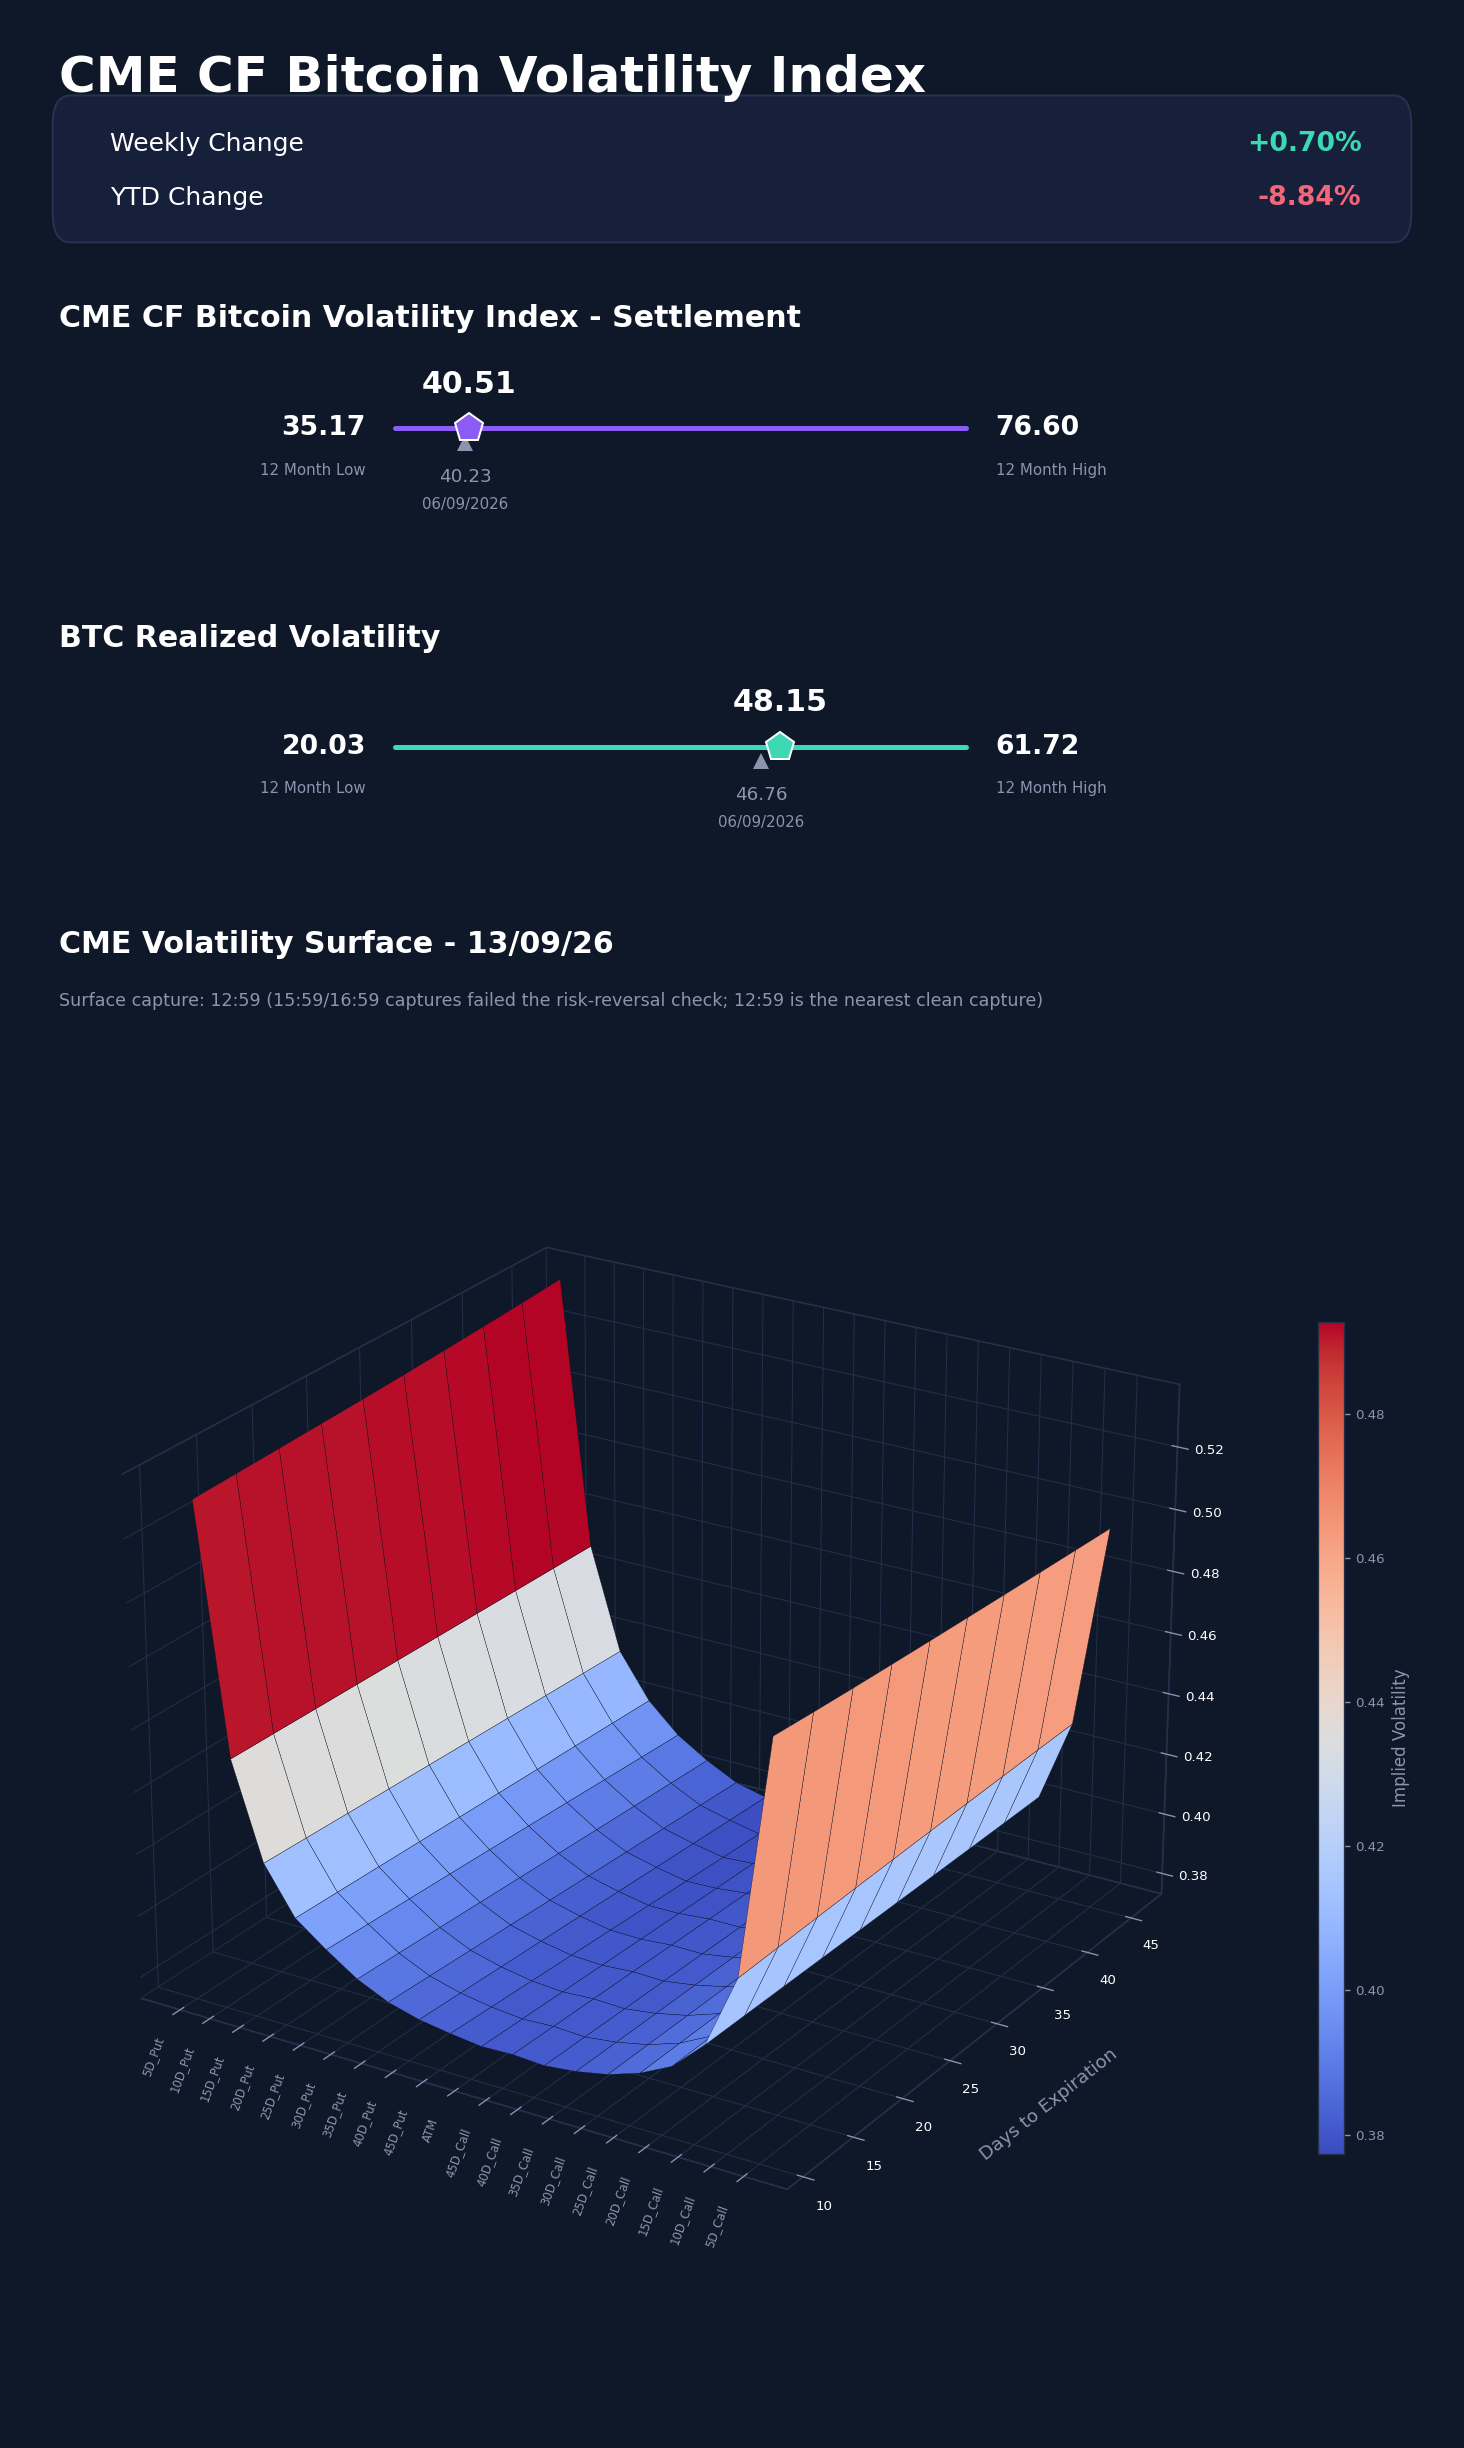
The CME CF Bitcoin Volatility Index Settlement (BVXS) finished September 13 at 40.51, up from 40.23 a week earlier, a 0.70% Sunday-to-Sunday increase. Thirty-day realized volatility rose to 48.15 from 46.76, widening the realized-over-implied gap and taking the implied-minus-realized spread to -7.64 vol. points from -6.53. During the business week, BVXS reached 41.57 on Wednesday before finishing Friday at 39.81, while realized volatility closed Friday at 47.95.
The Sunday settlement remained 5.34 vol. points above its trailing 12-month low of 35.17, within a 35.17-to-76.60 range, and 8.84% below its 44.44 start-of-year reference. Realized volatility occupied a higher part of its own 20.03-to-61.72 range. At the shortest available surface tenor, 11 days versus 18 days in the prior snapshot, at-the-money implied volatility rose 0.35 points to 38.12, while the 5-delta put rose 5.71 points to 53.03. The 25-delta put premium over at-the-money widened from 0.16 to 1.69 points, indicating firmer demand for downside protection at the front of the curve. These comparisons are between snapshot endpoints rather than matched maturities.
The standard September 13 15:59 and 16:59 captures failed the standing risk-reversal ordering check across multiple tenor rows. The exhibit therefore uses the 12:59 capture, the nearest snapshot that passed cleanly and covered the full 11.0-to-46.0-day grid. Overall, the modest weekly increase in implied volatility was outpaced by a larger rise in realized price variability, while the front of the options surface showed a relative firming in downside protection.
Market Cap Index Performance
All eight CF Capitalization Series indices declined, reversing the previous week's uniformly positive performance, as spot Bitcoin exchange-traded funds (ETFs) recorded $462.7 million in net outflows over the week. This marked the largest weekly redemption in ten weeks, with outflows concentrated in the September 9 and 10 sessions ahead of Friday's Consumer Price Index (CPI) print.
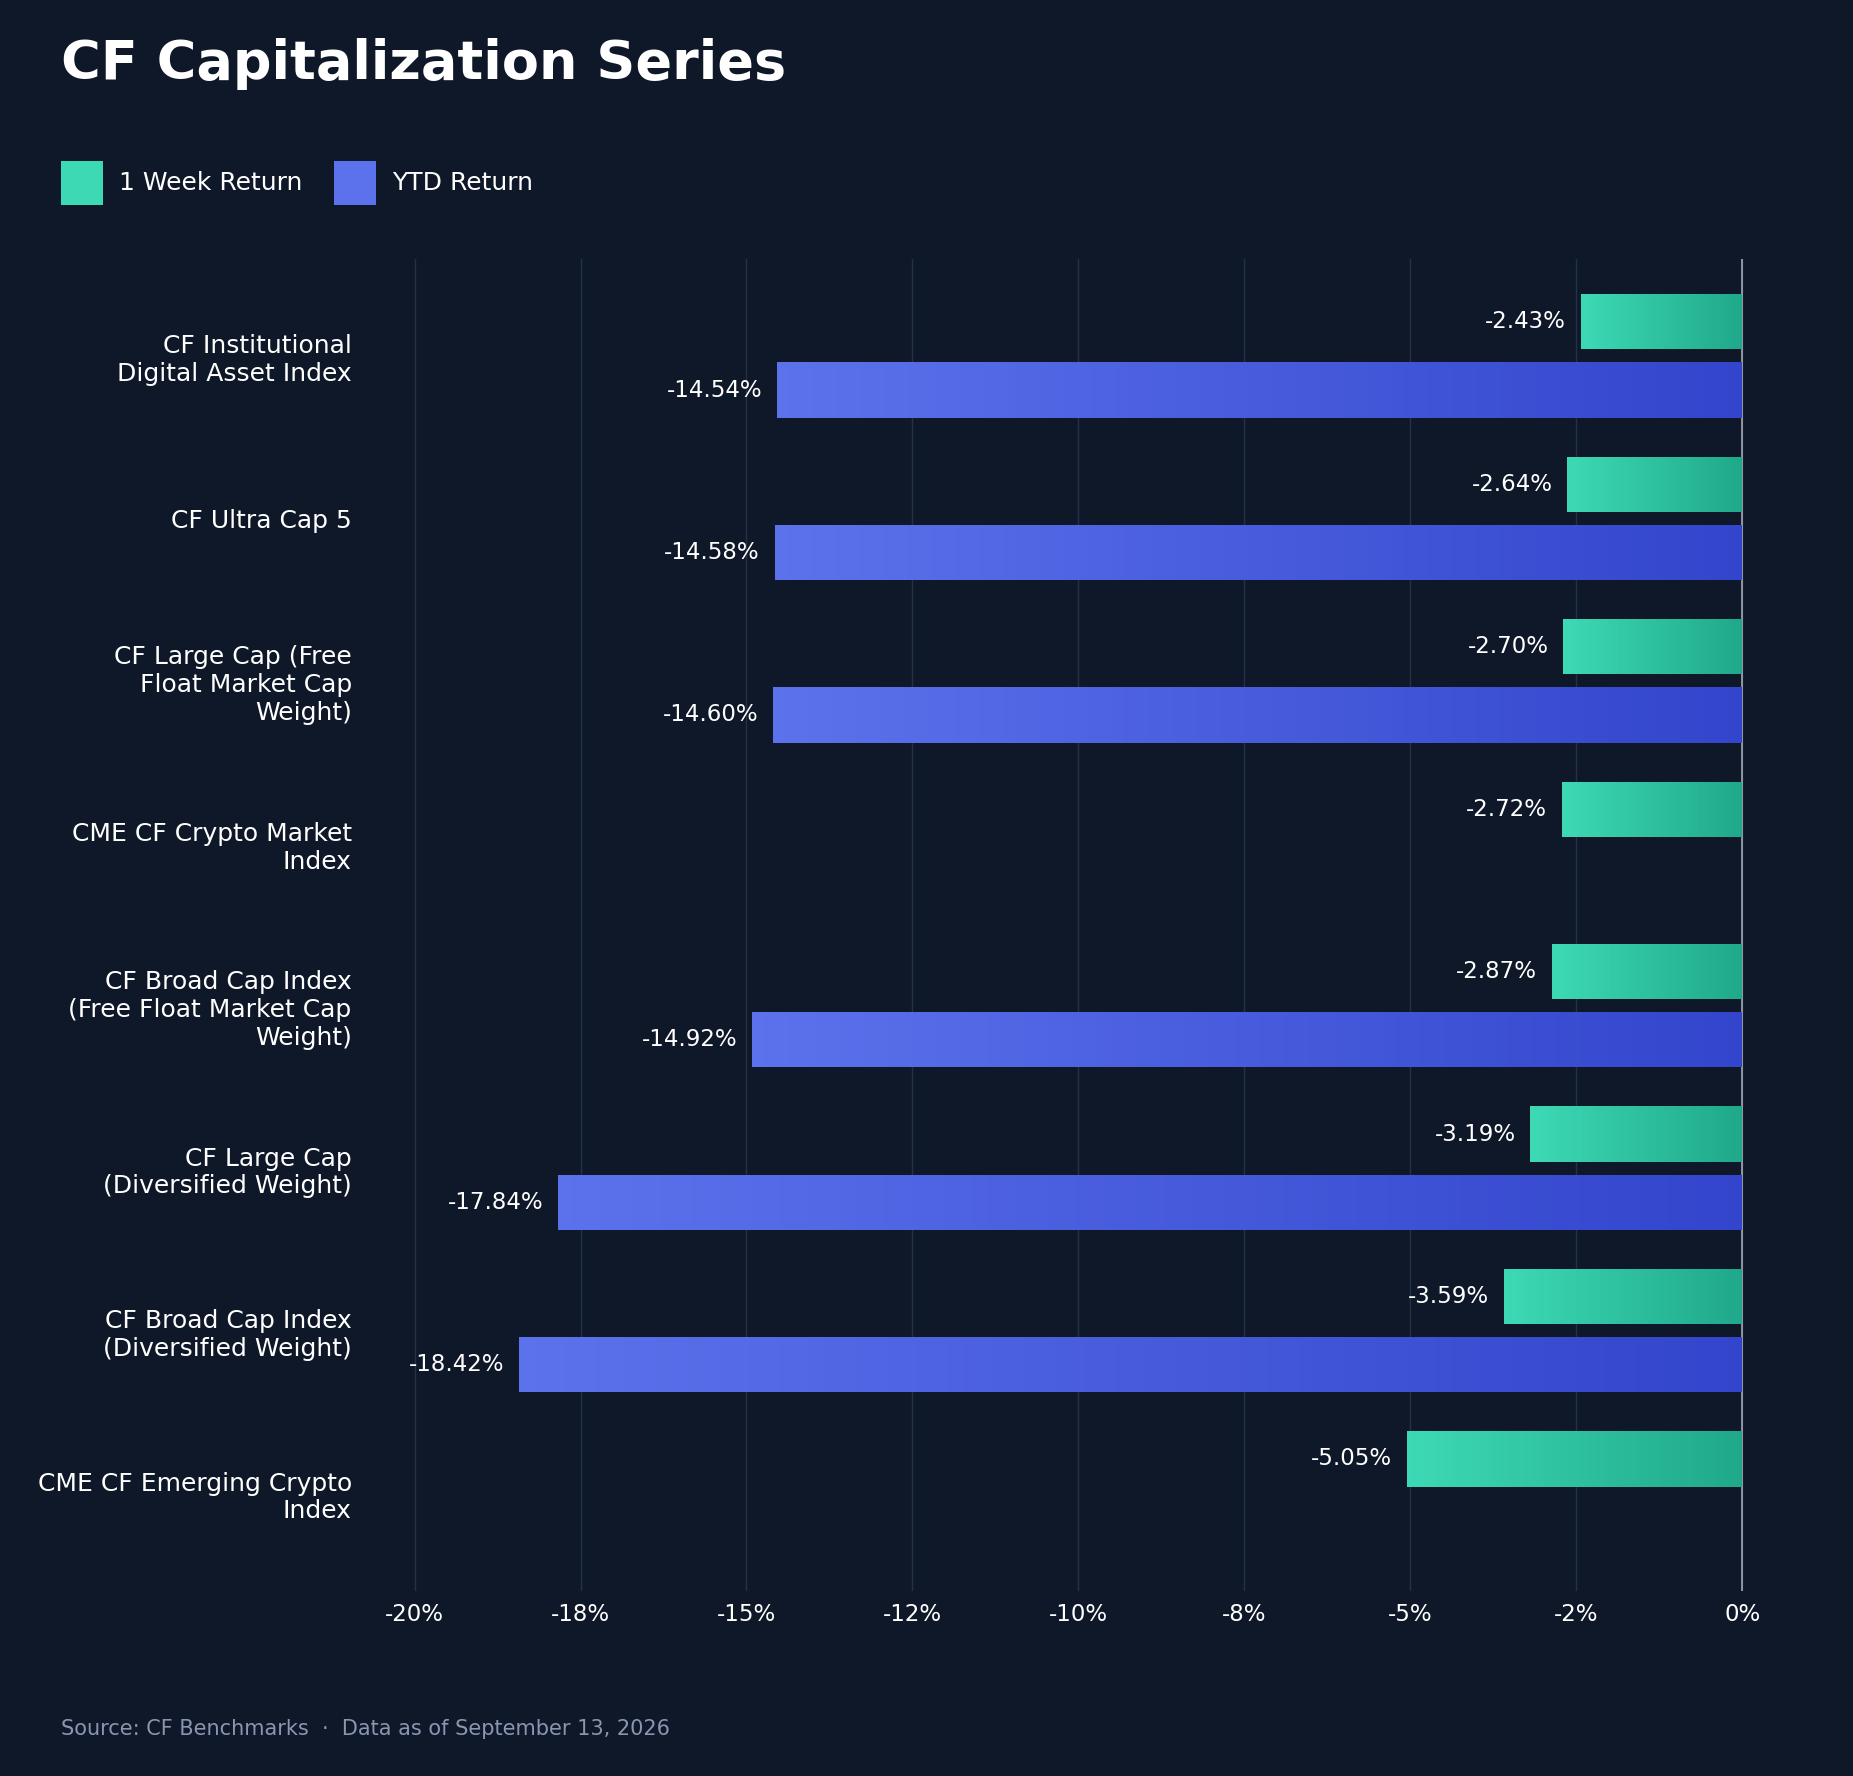
The CF Institutional Digital Asset Index was the most resilient at -2.43% w/w (YTD -14.54%), followed by CF Ultra Cap 5 at -2.64% (YTD -14.58%), CF Large Cap (Free Float Market Cap Weight) at -2.70% (YTD -14.60%), the CME CF Crypto Market Index at -2.72%, and CF Broad Cap Index (Free Float Market Cap Weight) at -2.87% (YTD -14.92%). Losses were larger in CF Large Cap (Diversified Weight) at -3.19% (YTD -17.84%), CF Broad Cap Index (Diversified Weight) at -3.59% (YTD -18.42%), and the CME CF Emerging Crypto Index at -5.05%.
The 2.62 percentage point (pp) range between the best- and worst-performing indices points to a deeper drawdown beyond the largest assets. Large Cap Diversified lagged its free-float counterpart by 0.50 pp, while Broad Cap Diversified lagged by 0.73 pp, reversing prior-week premiums of 0.74 pp and 1.05 pp, respectively. This weighting comparison provides the clearest evidence of weaker market breadth: reducing concentration in the largest assets increased the week's losses, indicating that weakness extended across the broader market rather than remaining concentrated in Bitcoin and other large-cap assets. YTD values for the CME CF Crypto Market Index and CME CF Emerging Crypto Index remain unavailable because their start-of-year fixes are missing.
Factors Analysis
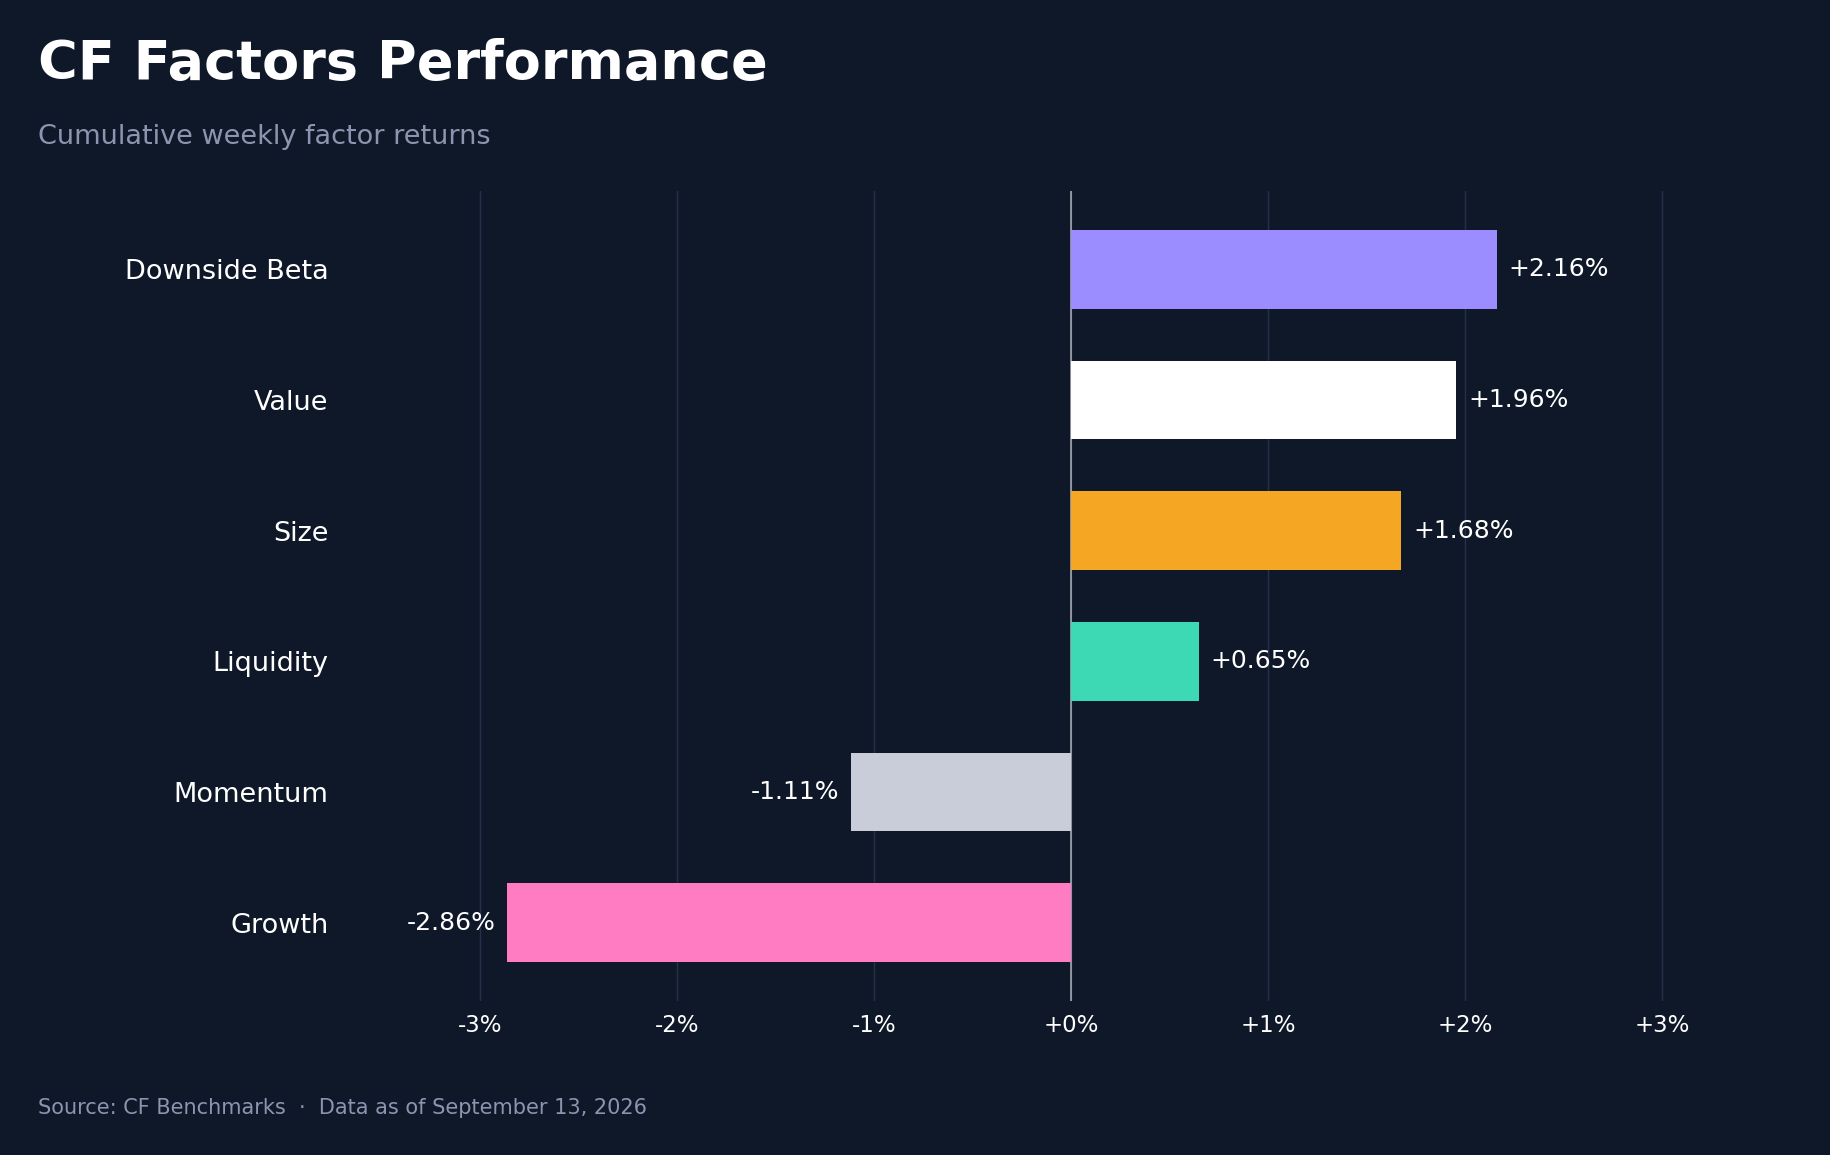
Downside Beta took the lead among the six CF factors at +2.16% cumulative for the week, ahead of Value at +1.96%, Size at +1.68% and Liquidity at +0.65%. Momentum remained negative at -1.11%, while Growth fell 2.86%, leaving a 5.02 pp range compared with 5.19 pp in the prior week. The change in leadership was narrow: Value had led previously at +2.27%, and its return slipped only 0.31 pp, while Downside Beta improved 0.48 pp. Momentum recorded the largest improvement, 1.81 pp from -2.92%, just ahead of Liquidity's 1.80 pp improvement from -1.15%; Size strengthened 1.66 pp from a nearly flat prior reading. Growth moved in the opposite direction, deteriorating 1.36 pp from -1.50%. The combination separates factor performance from the direction of the overall market: four factor portfolios gained during a broadly negative spot week. Momentum's smaller loss shows an easing of its prior underperformance, while continued weakness in Growth and a positive Value result kept the distinction between those styles visible.
Read our latest weekly crypto factors report: Factor Friday - September 11, 2026
Classification Series Analysis
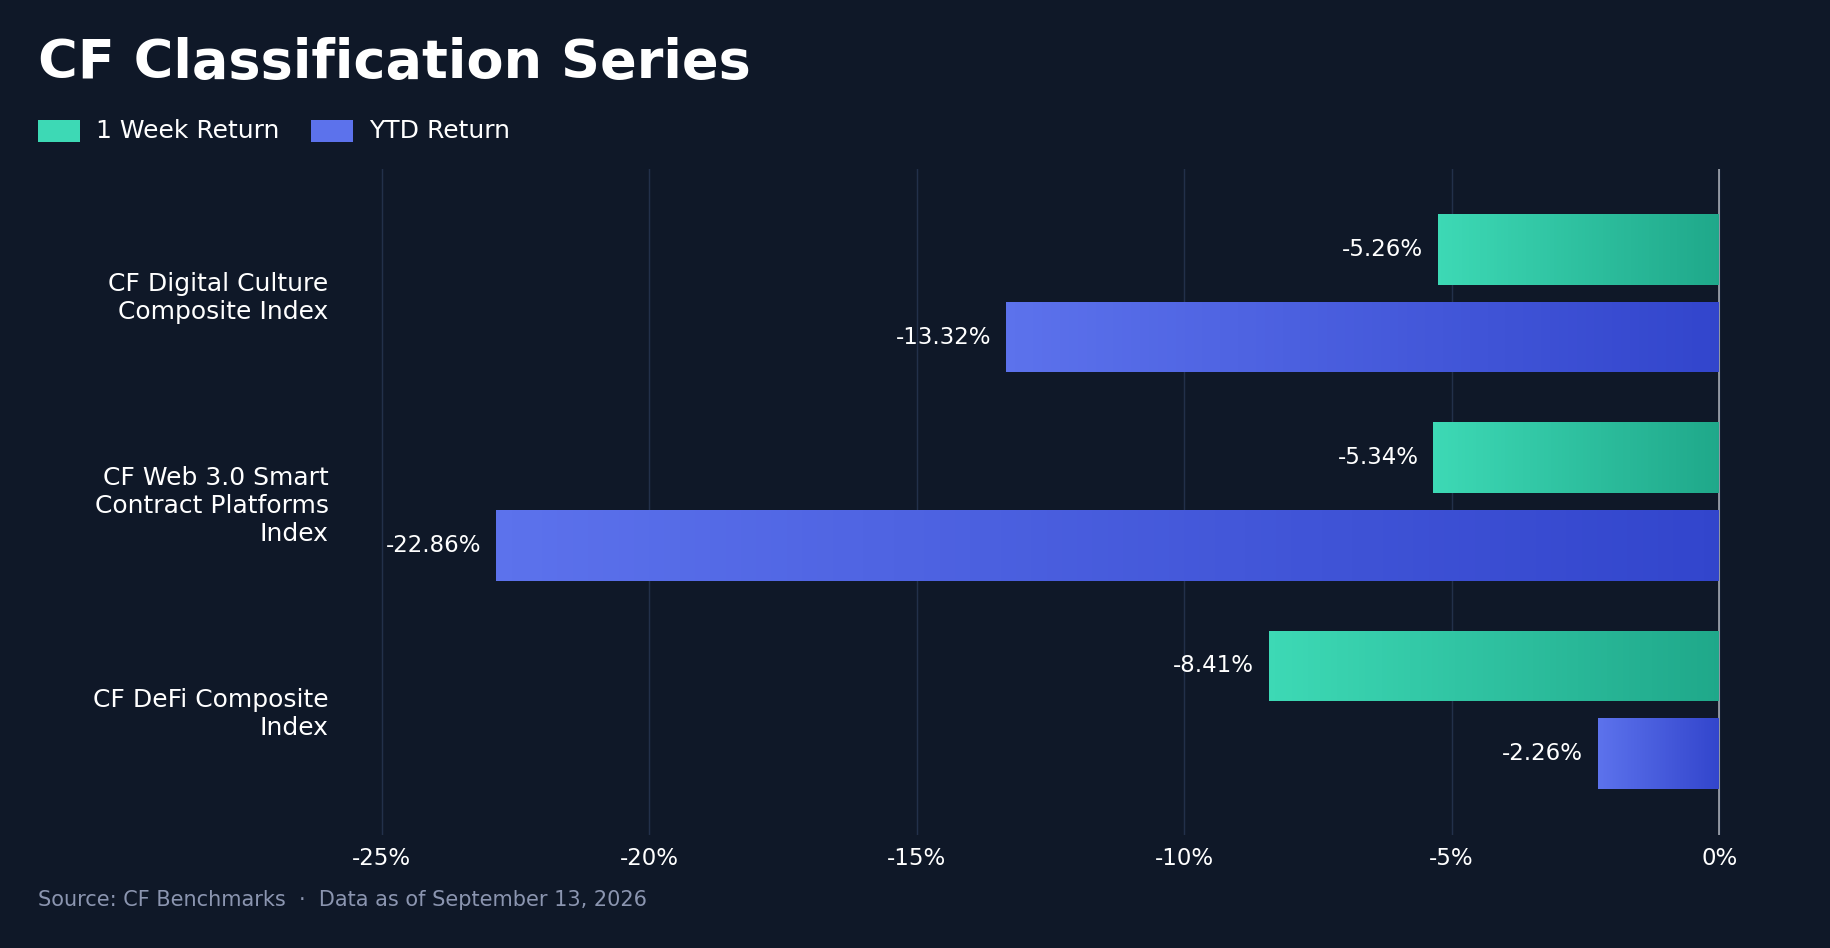
The CF Classification Series reversed its prior advance, with the CF DeFi Composite Index moving from the strongest to the weakest of the three composites. DeFi fell 8.41% w/w after gaining 14.08% in the previous week, a 22.49 pp change in weekly performance, and its YTD return moved back below zero to -2.26%. The CF Web 3.0 Smart Contract Platforms Index declined 5.34% (YTD -22.86%), while the CF Digital Culture Composite Index fell 5.26% (YTD -13.32%). Digital Culture's lead over Smart Contract Platforms was only 0.08 pp, so their ordering carries less information than the larger DeFi drawdown. Across the three composites, the weekly return range narrowed to 3.15 pp from 10.32 pp despite the shift from gains to losses. DeFi retained the least negative YTD result, but that cumulative resilience did not protect it during the week. The broader message is a reversal of the preceding thematic rally, with a concentrated setback in DeFi rather than equal-sized losses across all three classifications.
Sector Analysis
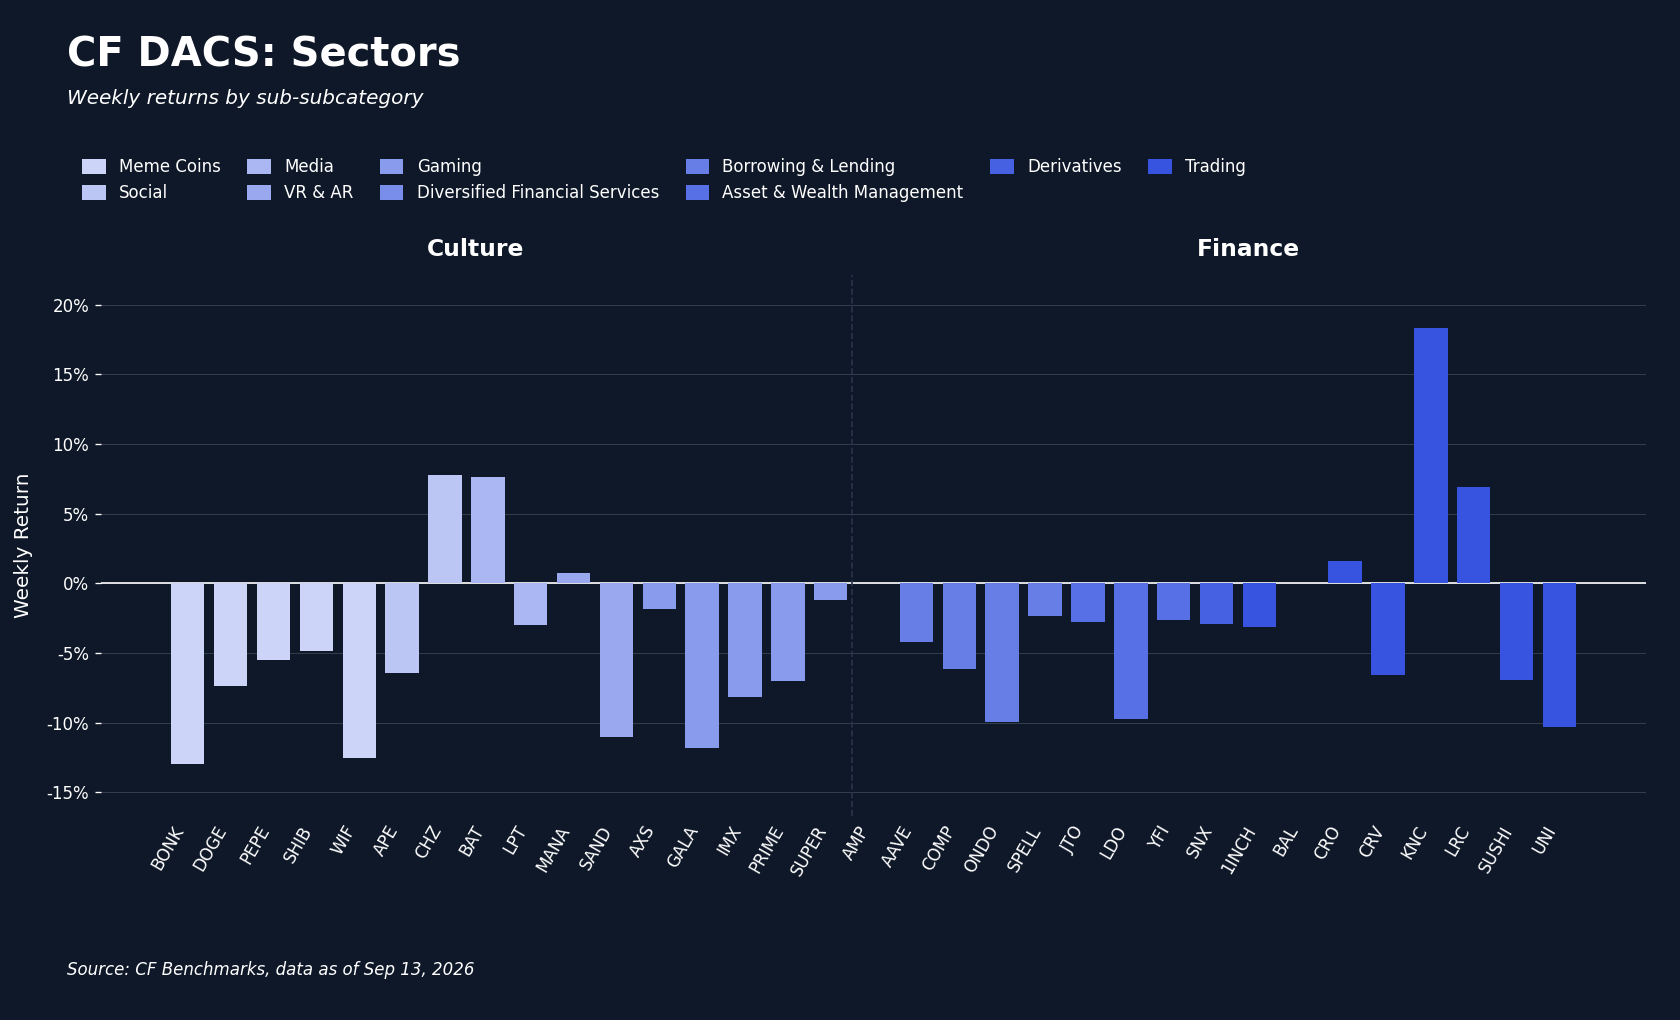
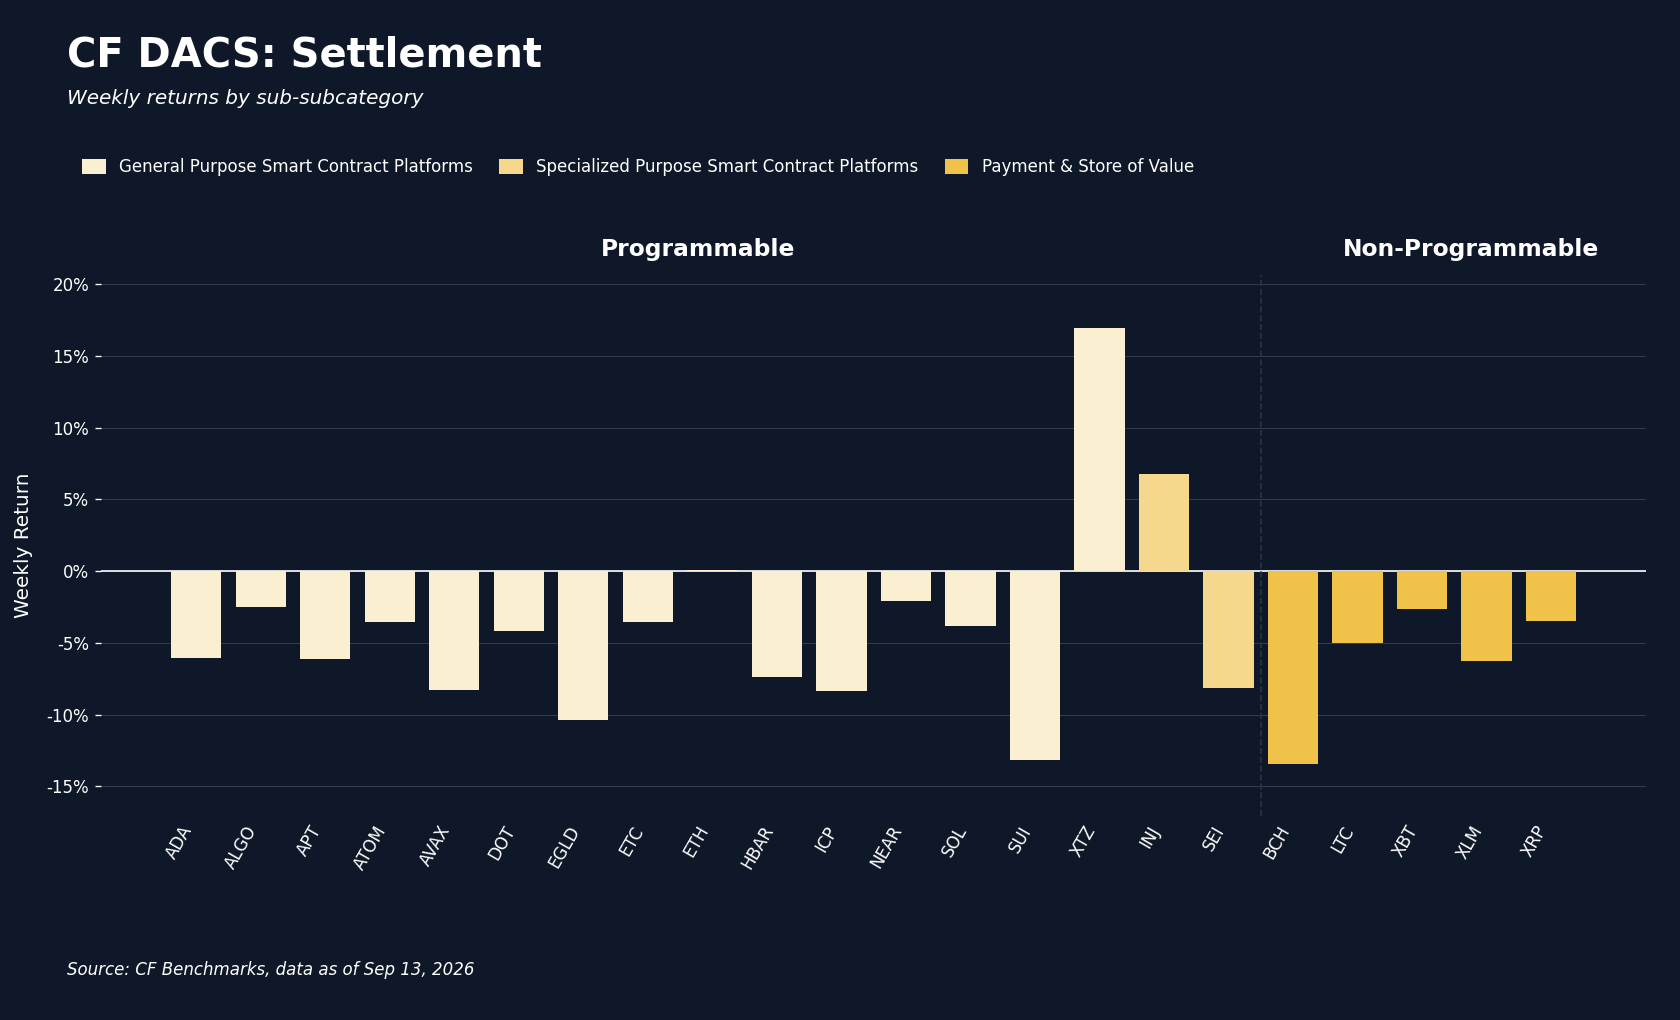
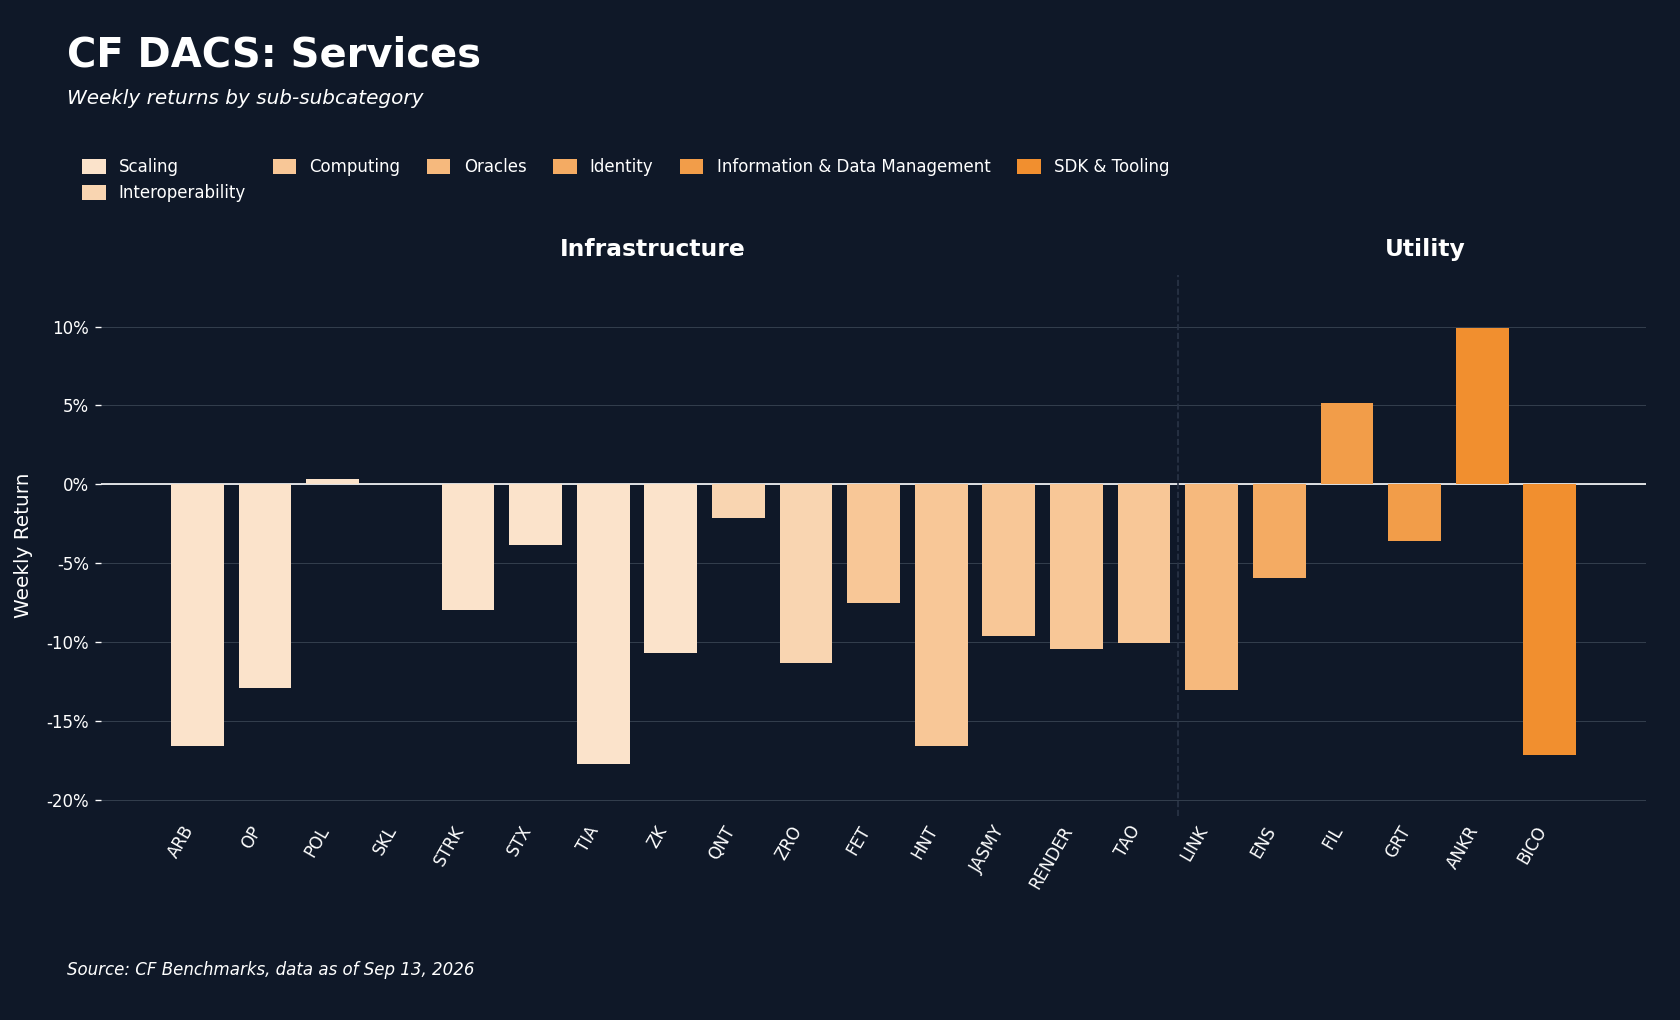
Every CF DACS sub-category recorded a negative average, led lower by Infrastructure at -9.14%, followed by Non-Programmable at -6.18%, Culture at -4.84%, Utility at -4.10%, Programmable at -3.75% and Finance at -2.40%. The 6.73 pp gap between Infrastructure and Finance shows that the loss was uneven, although it reached all six groups. Infrastructure's weakness was spread across constituents: Celestia (TIA) fell 17.71%, Helium (HNT) fell 16.57% and Arbitrum (ARB) fell 16.56%, while Polygon (POL) was its strongest constituent at just +0.31%. Finance contained the week's strongest individual result, Kyber Network (KNC) at +18.34%, alongside a -10.32% decline in Uniswap (UNI). Tezos (XTZ) gained 16.95% in Programmable, where Sui (SUI) lost 13.16%. Within Culture, Chiliz (CHZ) added 7.80% while Bonk (BONK) fell 12.93%; Utility ranged from Ankr (ANKR) at +9.93% to Biconomy (BICO) at -17.16%. Bitcoin Cash (BCH) was the weakest Non-Programmable constituent at -13.43%. Across the 76 constituents with valid weekly returns, KNC and TIA defined a 36.05 pp spread. Rarible (RARI) remained unscored because its weekly return was unavailable. Isolated gains therefore coexisted with broadly negative sub-category averages, rather than overturning the decline visible in the headline indices.
CF Staking Series
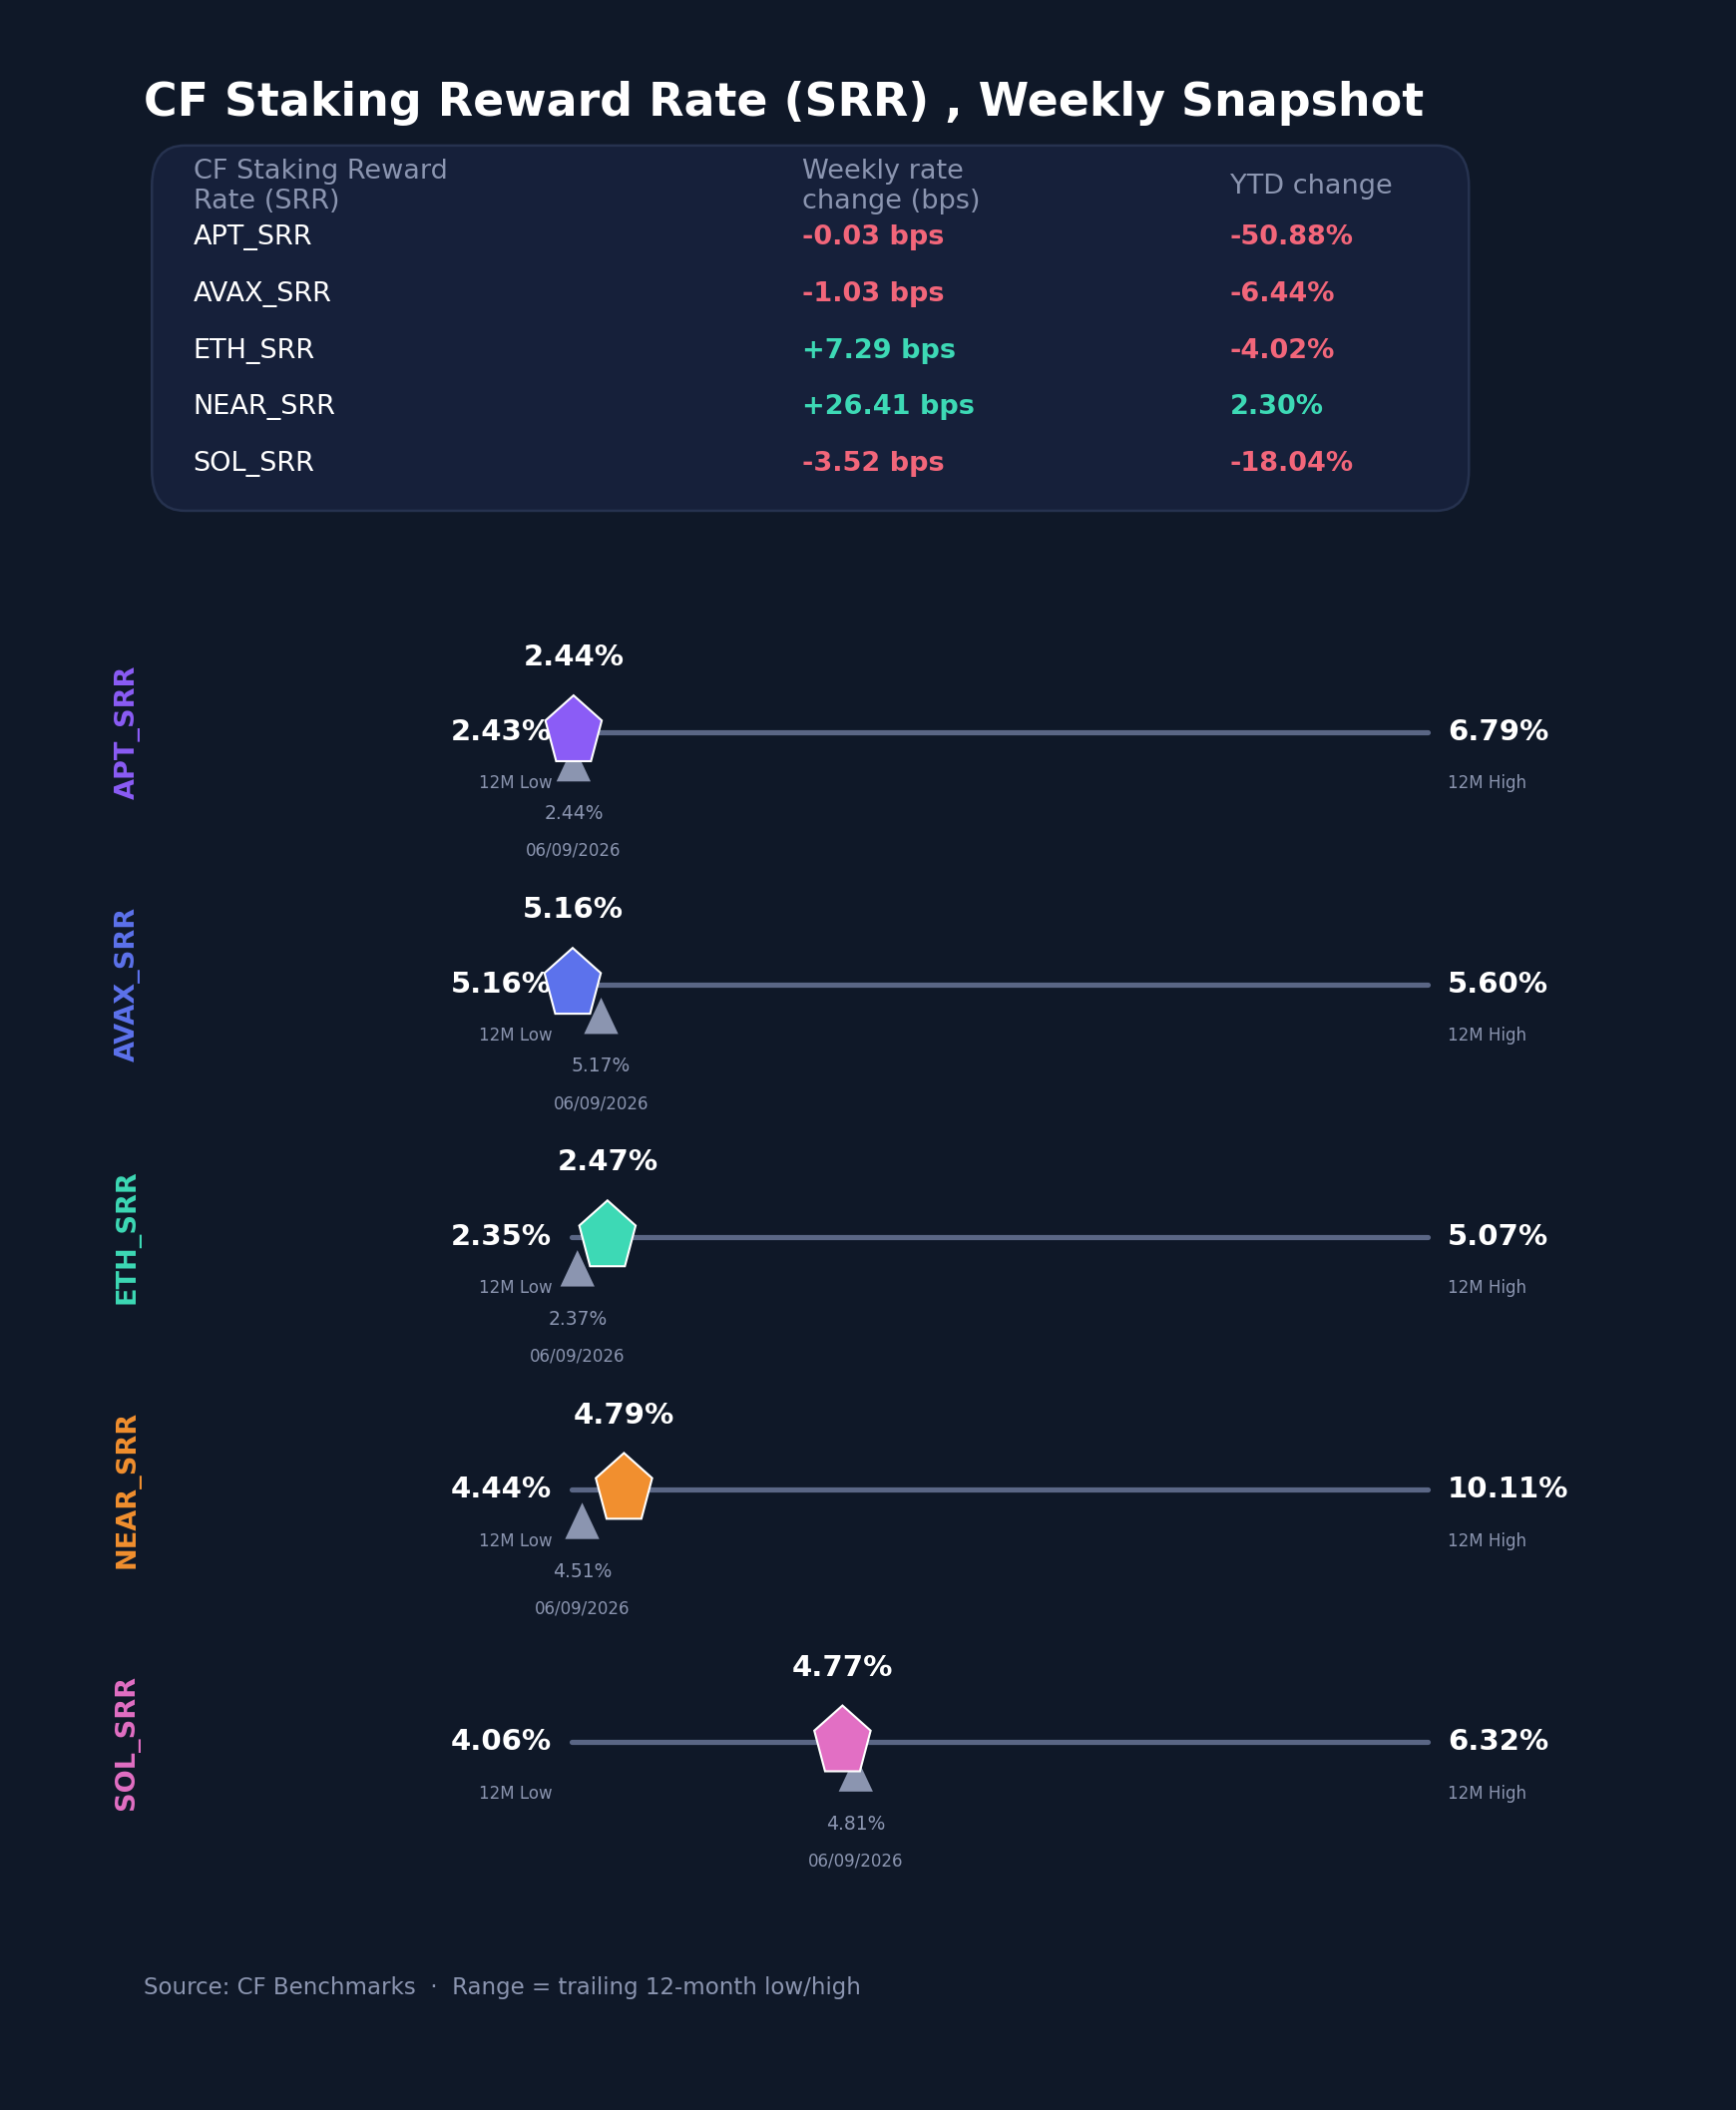
The CF Staking Series showed a different ordering from the spot market. Near Protocol (NEAR) led the relative rate-index returns at +5.84% w/w, followed by Ether (ETH) at +3.05%, while Aptos (APT) was nearly unchanged at -0.01%, Avalanche (AVAX) declined 0.20% and Solana (SOL) fell 0.73%. These are relative changes in the series, not staking income earned during the week. Within-week reward-rate changes were +26.4 bps for NEAR, +7.3 bps for ETH, -1.0 bps for AVAX and -3.5 bps for SOL; APT's movement rounded to 0.0 bps. Comparing the reference levels with the prior Sunday, NEAR increased to 4.7893% from 4.5127%, ETH to 2.4653% from 2.3701%, AVAX eased to 5.1575% from 5.1722%, SOL to 4.7738% from 4.8090%, and APT held at 2.4380%. The within-week changes use the Monday reference, so they need not equal the Sunday-to-Sunday differences. Current reward rates spanned 2.72 pp, with APT now the lowest and AVAX still the highest. NEAR's increase also moved its rate above SOL's, a change in the relative reward-rate ordering despite both remaining below AVAX.
Interest Rate Analysis
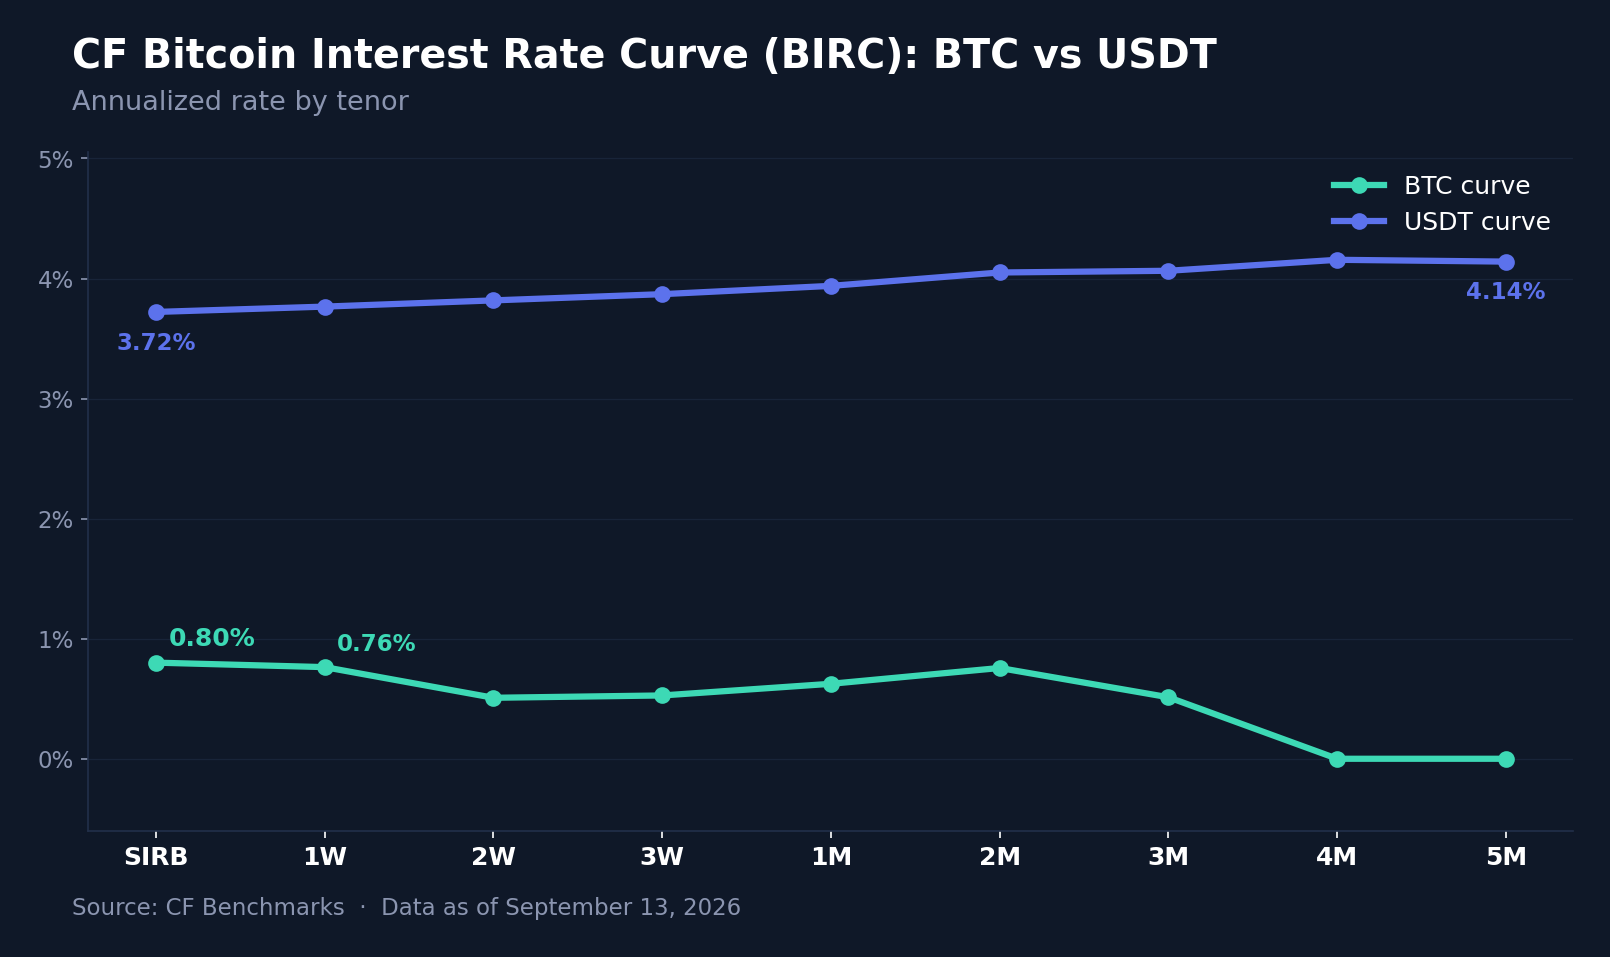
The CF Bitcoin Interest Rate Curve (BIRC) showed a much larger decline in BTC funding than in USDT funding. On the weekly-average basis, BTC's Short-term Interest Rate Benchmark (SIRB) fell 275.1 bps to 0.8006% from 3.5514%, and the 1-week (1W) rate declined 136.9 bps to 0.7633%. The 2-week (2W) tenor fell 120.0 bps to 0.5079%; rates then stepped up through 3-week (3W), 0.5273% (-81.9 bps), 1-month (1M), 0.6245% (-95.4 bps), and 2-month (2M), 0.7561% (-53.4 bps), before easing to 0.5123% at 3-month (3M), down 35.6 bps. The reported BTC 4-month and 5-month rates remained at 0.0000%. USDT rates fell across all tenors by between 3.8 and 14.9 bps, with SIRB at 3.7217%, 1W at 3.7662% and 3M at 4.0646%. Its curve remained generally upward-sloping, reaching 4.1560% at 4M before a small dip to 4.1410% at 5M. USDT's premium over BTC at SIRB widened to 292.1 bps from 32.0 bps. Across both curves, changes ranged from -275.1 bps to 0.0 bps. The much larger BTC adjustment identifies a currency-specific repricing rather than an equally sized fall in both funding curves.
Closing Synthesis
The week's defining catalyst sat outside the index data: a hotter-than-expected core CPI print and a sharply weaker University of Michigan sentiment reading, both released September 11th, repriced Fed rate-hike odds for the September 15-16 meeting from near 60% to above 80% and coincided with BTC's round trip from an intraday spike near $79,837 to below $77,000. The index evidence that followed points to weaker breadth: diversified capitalization portfolios lost more than their free-float counterparts, all three classification composites declined, and negative DACS averages extended across every populated sub-category. Infrastructure's losses were spread across several names, while Ether's resilience and isolated constituent gains limited the uniformity of the retreat. Factor returns and staking reward rates retained their own cross-sectional patterns. Alongside that spot weakness, a wider implied-realized volatility gap and a sharper fall in BTC funding than USDT funding, evident in the same window as the rate repricing, show why the market cannot be described by a single stress measure. The defining combination was a macro-driven risk-off reversal that left broad price weakness alongside distinct adjustments in style returns, reward rates and funding.
The information contained within is for educational and informational purposes ONLY. It is not intended nor should it be considered an invitation or inducement to buy or sell any of the underlying instruments cited including but not limited to cryptoassets, financial instruments or any instruments that reference any index provided by CF Benchmarks Ltd. This communication is not intended to persuade or incite you to buy or sell security or securities noted within. Any commentary provided is the opinion of the author and should not be considered a personalised recommendation. Please contact your financial adviser or professional before making an investment decision.
Note: Some of the underlying instruments cited within this material may be restricted to certain customer categories in certain jurisdictions.
Factor Friday - Oct 23, 2026
Size led CF Benchmarks' factor table for a fourth week at 0.75% as the Market fell 1.88% and only 4 of 35 Broad Cap tokens closed higher. Liquidity turned negative at -1.03% as more liquid assets held up better, and Size's year-to-date lead extended to 23.74%.

Mark Pilipczuk
Changes to the Token Market Price Benchmarks Series - Market Prices – 20 October 2026
The Administrator has confirmed changes to the Token Market Price Family for the period 13 October 2026 to 20 October 2026
CF Benchmarks
Altcoins Lag as Bitcoin Tests The 50-Day Moving Average
Digital assets fell broadly over the past week as Bitcoin slipped to a moving average, with inflation prints and an equity sell-off in the background. Losses grew with distance from Bitcoin, hitting diversified and smaller-cap exposure hardest, while implied volatility rose.
Mark Pilipczuk
By clicking Accept, you consent to CF Benchmarks's use of cookies.
Visit Cookie Settings to learn how CF Benchmarks uses cookies and to adjust your preferences.