
Oct 12, 2026
Bitcoin Tests Its 50-Day Moving Average
Weekly Index Highlights, October 12, 2026
This was a technical retracement led by Bitcoin (BTC), not necessarily a macro event. BTC fell 2.52% week-on-week (w/w) and pulled back to its 50-day moving average: its intraweek low of $80,427 on Thursday dipped just through the average, which stood near $80,500 at that day's London fix, and BTC closed the week 3.25% above it. The broader market followed BTC down, with Ether (ETH) off 7.17%, every CF Capitalization Series index lower and the diversified indices trailing their free-float counterparts by 1.57 percentage points (pp), as US spot Bitcoin and Ether exchange-traded funds (ETFs) redeemed about $1.2 billion and a Tuesday leverage flush forced out long positions. The decline showed no consistent link to rates: hawkish Federal Reserve minutes and a 10-year Treasury yield near 5.35% arrived mid-decline, but the selling began before the minutes and the S&P 500 rose 1.2% on the same backdrop. The one material single-name catalyst was Starknet (STRK), which nearly doubled after the network said it was considering becoming a layer-1, carrying Infrastructure to the only positive CF Digital Asset Classification Structure (DACS) sub-category average.`
Market Performance Update
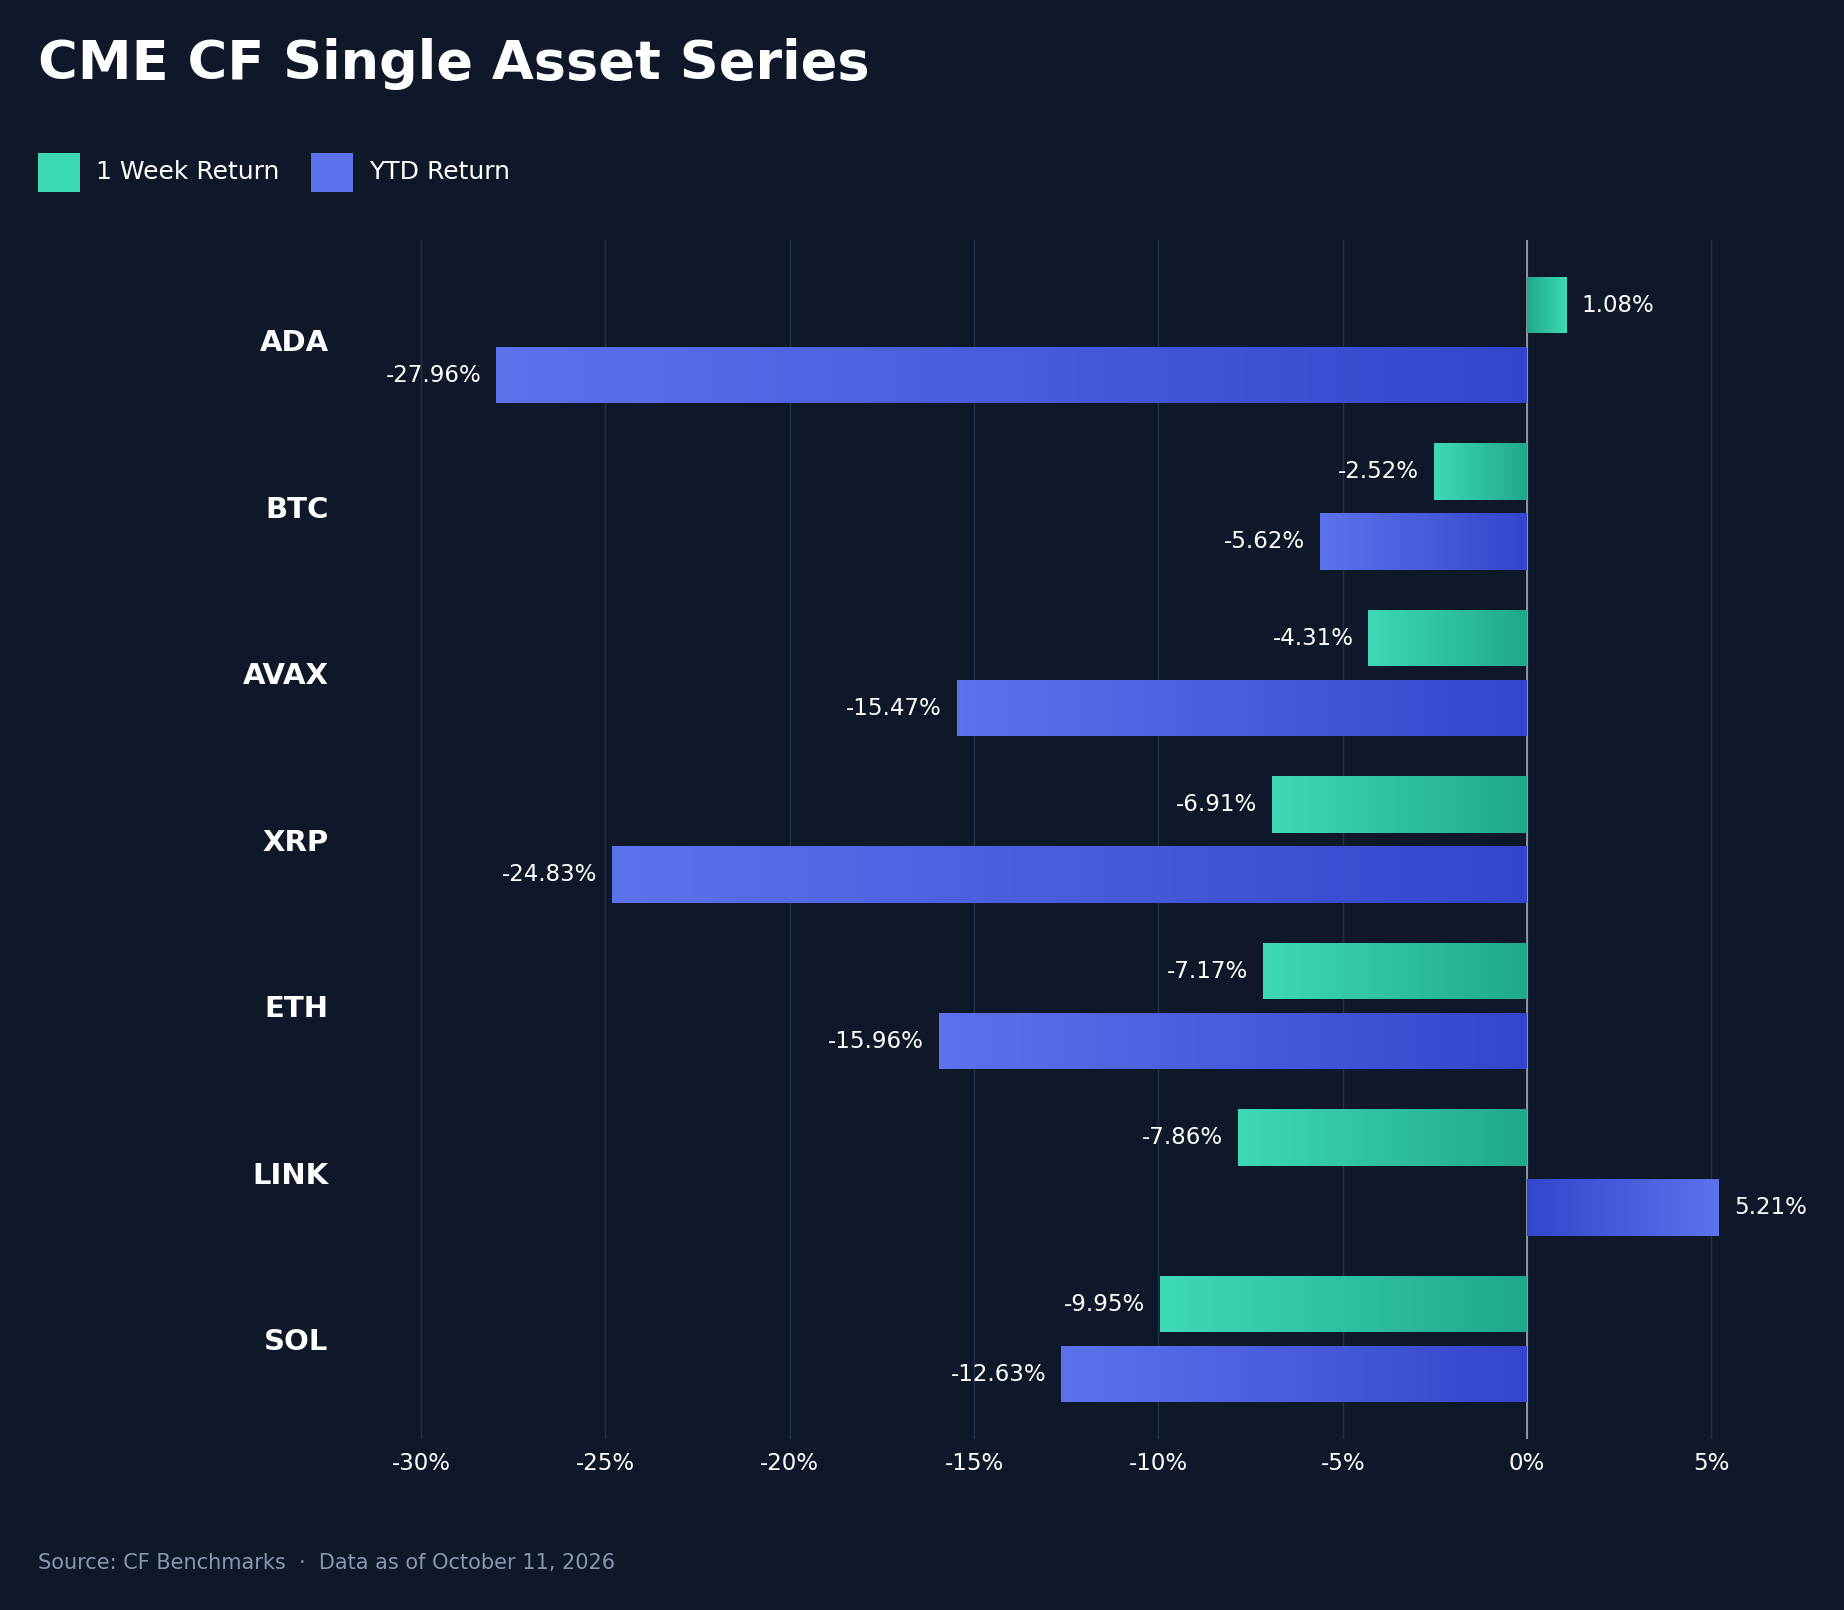
The CF Single Asset Series fell in six of seven names, and the w/w range widened to 11.03 pp from 4.44 pp a week earlier. Cardano (ADA) was the only gainer at +1.08%, leaving it 27.96% lower year-to-date (YTD) and recovering part of the prior week's 3.78% decline, while BTC held up best among the decliners at -2.52% (YTD -5.62%). Avalanche (AVAX) fell 4.31% (YTD -15.47%), XRP 6.91% (YTD -24.83%), ETH 7.17% (YTD -15.96%) and Chainlink (LINK) 7.86%, cutting its YTD gain to +5.21% from +14.18%, and Solana (SOL) was weakest at -9.95% (YTD -12.63%). BTC slipped from about $85,500 to near $83,800 in roughly 15 minutes on Tuesday, a flush that liquidated about $400 million of longs within an hour with no macro trigger sourced. It extended lower after Wednesday's release of the September Federal Open Market Committee (FOMC) minutes, in which most officials saw another hike as likely appropriate by year-end, and Governor Waller's Thursday remark that he anticipates additional hikes, reaching its weekly low on Thursday at the 50-day average, while the 10-year yield traded at its highest since 2002. US spot Bitcoin ETFs redeemed a net $678.9 million over five sessions, including $484.9 million on Wednesday, the largest single day since June 25th, while Ether ETFs redeemed $542.2 million and extended their outflow streak to nine sessions, consistent with ETH trailing BTC by 4.65 pp. Among the decliners BTC held up best and SOL fell most, a pattern consistent with long-led deleveraging.
Volatility Analysis
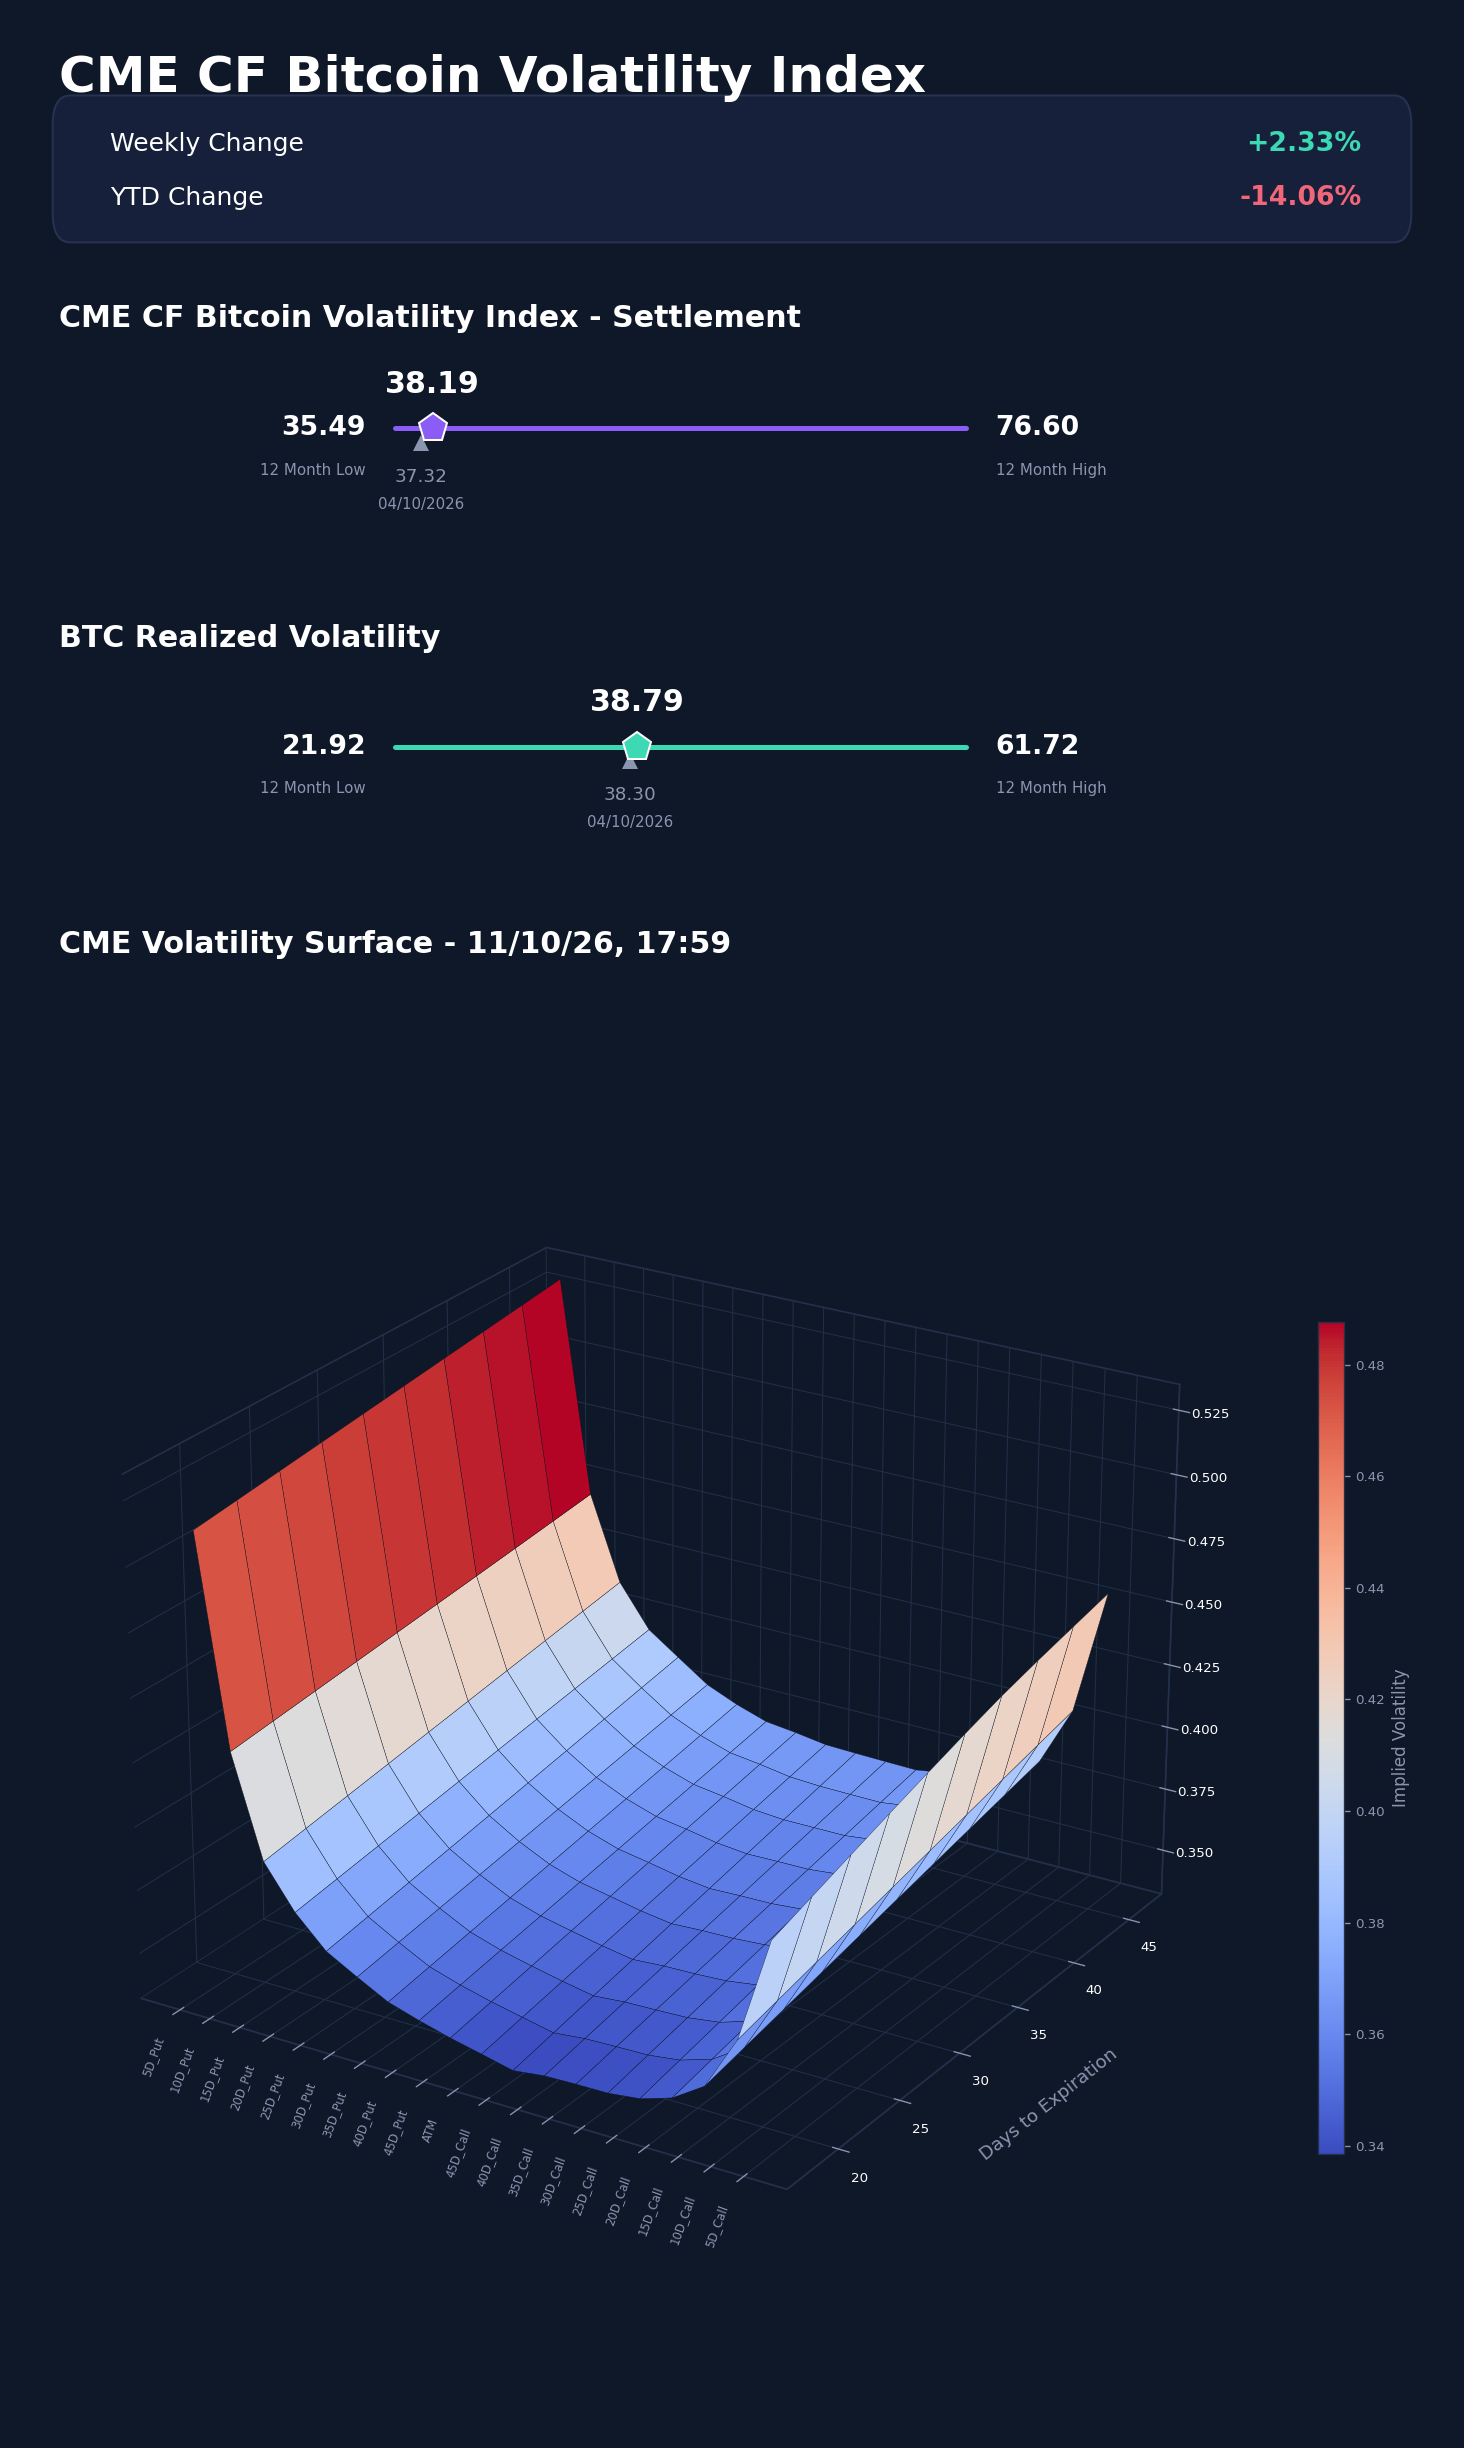
The CME CF Bitcoin Volatility Index Settlement (BVXS) rose 2.33% w/w to 38.19 on October 11th from 37.32, a 0.87 vol. point increase that was small against the drawdown in spot. Across the business week BVXS traded a 1.71 vol. point band, from 37.47 on Tuesday, the day of the leverage flush, to 39.18 on Thursday, the day BTC set its weekly low, before easing to 38.10 on Friday. Thirty-day realized volatility rose to 38.79 from 38.30 after peaking at 40.66 on Wednesday, and the implied-minus-realized spread narrowed to -0.60 vol. points from -0.98, so options still priced slightly below realized movement. BVXS sat 2.70 vol. points above its trailing 12-month low of 35.49, within a 35.49-to-76.60 range, and 14.06% below its 44.44 start-of-year reference. The surface carried more of the week's stress than the index level. Comparing this week's 24-day row with the prior snapshot's 25-day row, at-the-money implied volatility fell to 34.52 from 36.13, while the 5-delta put premium over at-the-money rose to 17.08 vol. points from 14.17 and the 5-delta call premium fell to 7.97 from 13.07; the 25-delta put premium widened to 2.24 from 1.33. Demand moved out of the upside tail and into downside protection, consistent with hedging against further long liquidation rather than a broad repricing of volatility. The exhibit uses the 17:59 Sunday capture, the nearest to the fix that passes the standing skew checks, on an 18-to-46-day tenor grid.
Market Cap Index Performance
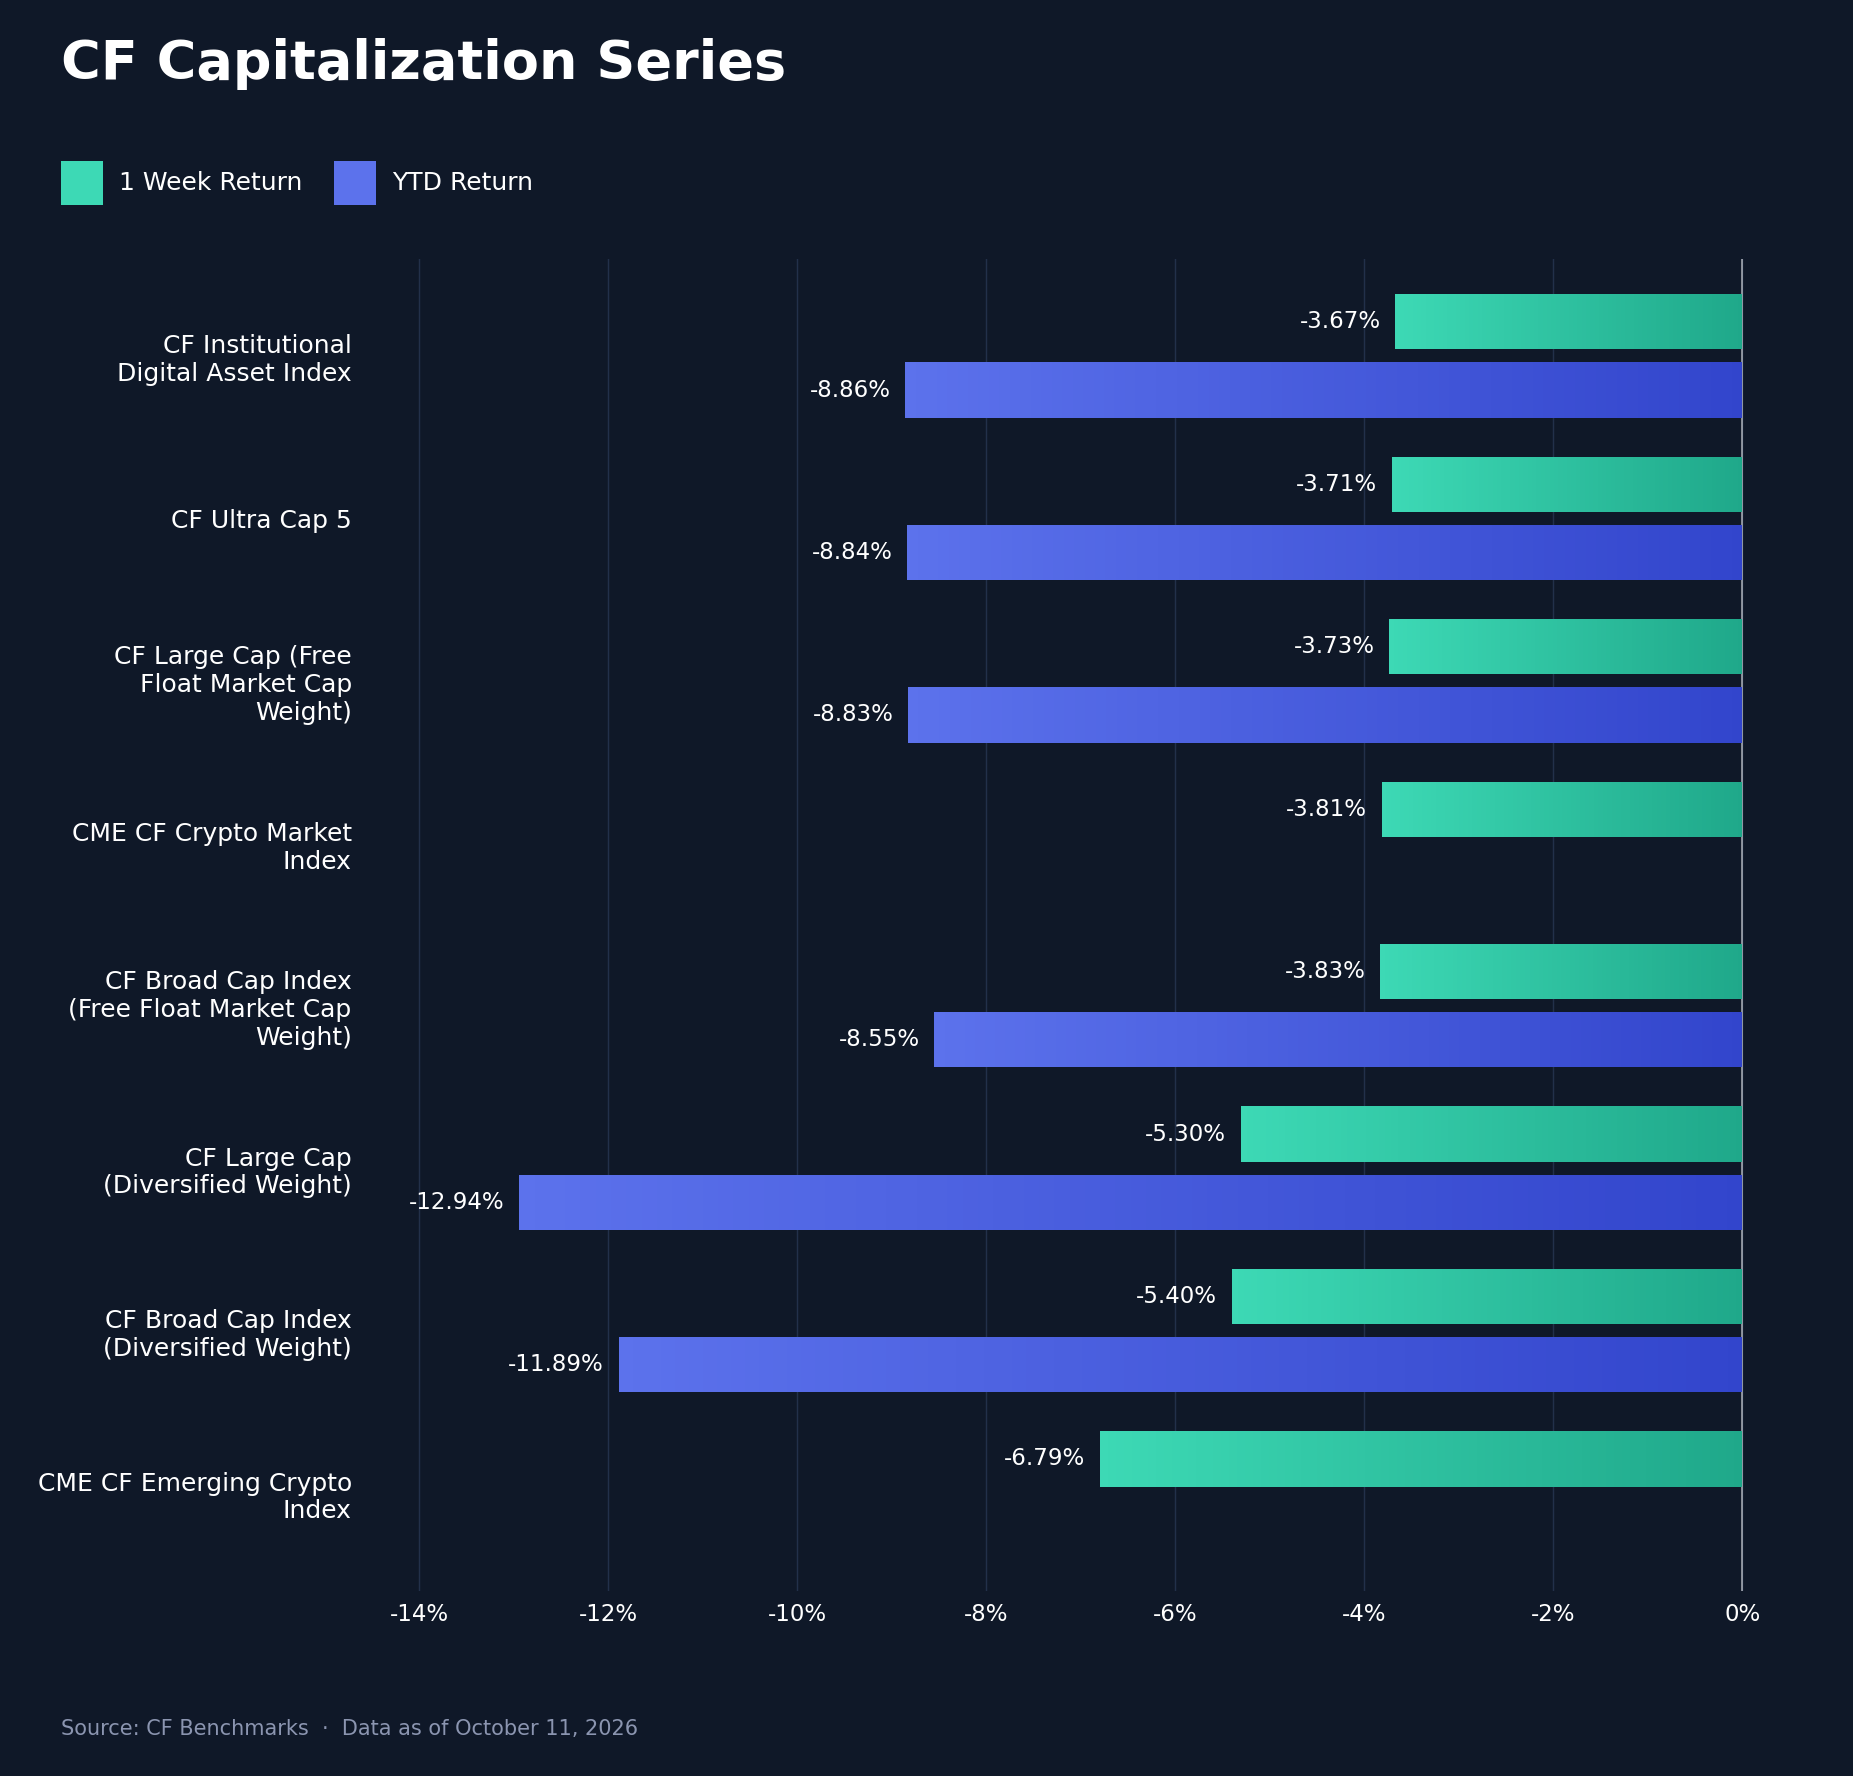
All eight CF Capitalization Series indices fell, and the range widened to 3.12 pp from 0.85 pp as losses deepened with distance from BTC. The BTC-heavy indices clustered within 0.16 pp: the CF Institutional Digital Asset Index fell 3.67% (YTD -8.86%), CF Ultra Cap 5 3.71% (YTD -8.84%), CF Large Cap (Free Float Market Cap Weight) 3.73% (YTD -8.83%), the CME CF Crypto Market Index 3.81% and CF Broad Cap Index (Free Float Market Cap Weight) 3.83% (YTD -8.55%). CF Large Cap (Diversified Weight) fell 5.30% (YTD -12.94%), CF Broad Cap Index (Diversified Weight) 5.40% (YTD -11.89%), and the CME CF Emerging Crypto Index was weakest at -6.79%. Both diversified indices trailed their free-float counterparts by 1.57 pp, roughly three times the prior week's gaps of 0.50 pp and 0.54 pp. The macro impulse reached digital assets as a rates and flows shock that large-cap equities absorbed, and the forced selling was broad: about $1.08 billion of positions were liquidated in the 24 hours to October 9th, about 85% of them longs, with ETH longs ($351 million) larger than BTC longs ($304 million). The wider loss in the diversified indices is consistent with diversified weighting's larger exposure to assets beyond BTC. The data themselves were second order: an Institute for Supply Management (ISM) services miss with prices paid at their highest since July 2022, jobless claims below 200,000 for a fourth week and softer University of Michigan sentiment left priced odds of an October hold near 80%.
Factors Analysis
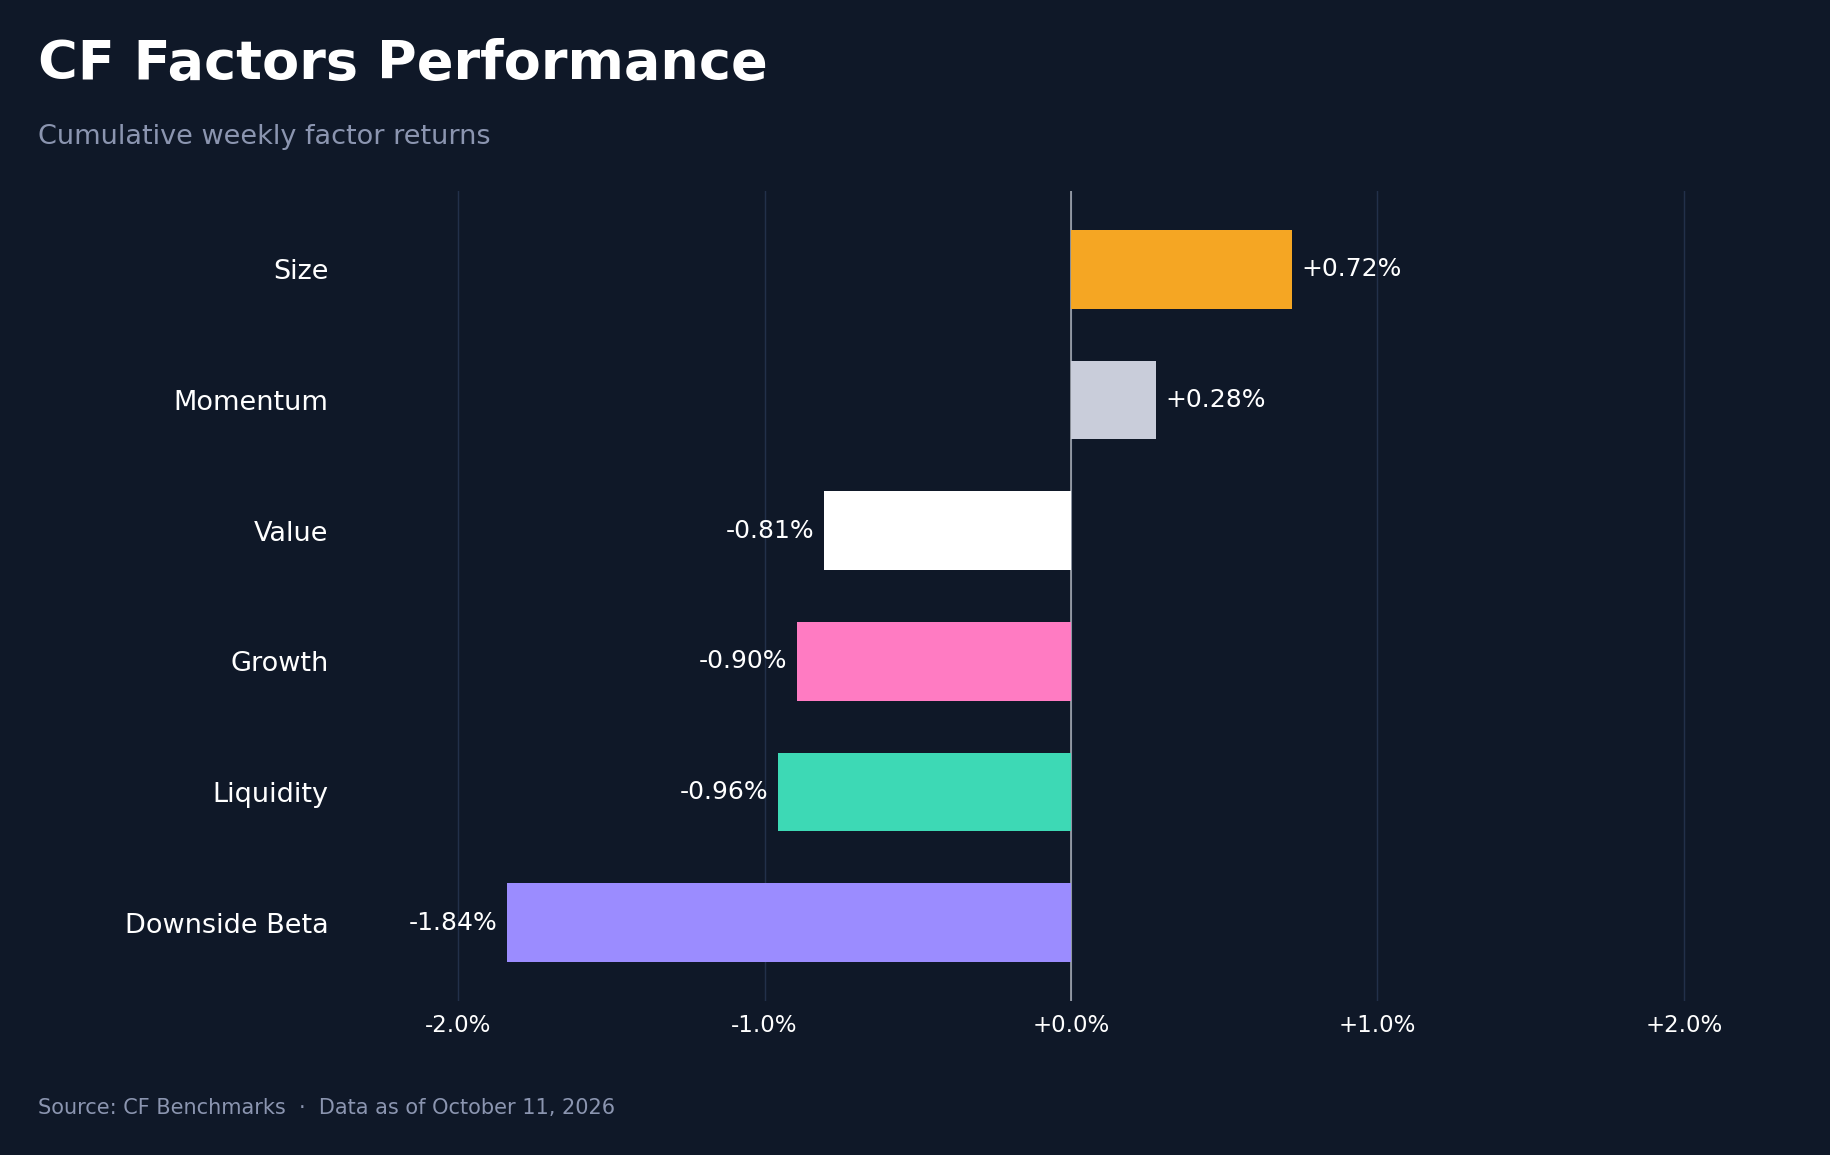
Size led the six CF factors for a third consecutive week, but only at +0.72% cumulative, followed by Momentum at +0.28%, while Value returned -0.81%, Growth -0.90%, Liquidity -0.96% and Downside Beta -1.84%. The range compressed to 2.56 pp from 8.04 pp. Downside Beta recorded the largest reversal, falling 5.85 pp from +4.01%, with 1.16% of the loss on Saturday alone; Size gave back 4.66 pp from +5.38%, Growth 3.57 pp and Liquidity 3.46 pp, while Momentum improved 2.93 pp from -2.66% to finish positive after two negative weeks. Size was negative at -0.15% cumulative through Friday and earned its lead over the weekend, while Growth's weakest session was Friday at -1.20%. With every capitalization index down between 3.67% and 6.79% and no factor moving more than 1.84% in either direction, the week's returns came from market direction rather than from the cross-section, the reverse of the prior week.
Read our latest weekly crypto factors report: Factor Friday - October 9, 2026
Classification Series Analysis
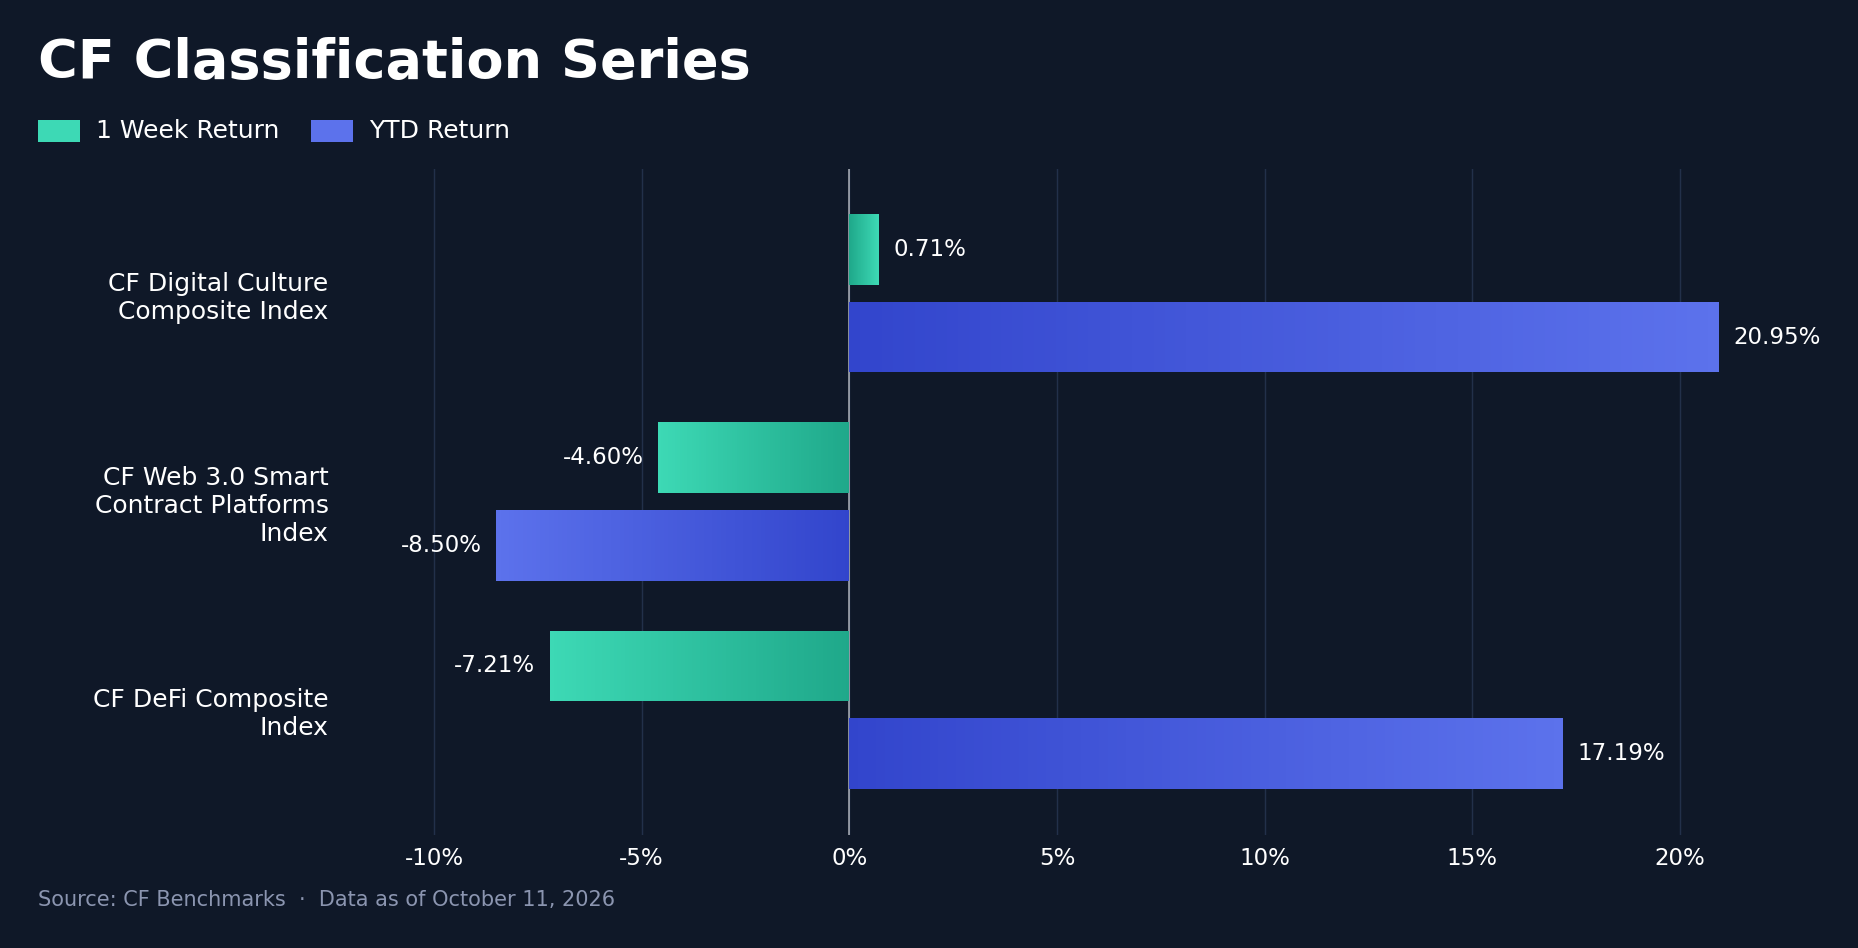
The CF Digital Culture Composite Index was the only CF Classification Series index to rise, gaining 0.71% w/w for a third consecutive week of leadership, while the CF Web 3.0 Smart Contract Platforms Index fell 4.60% (YTD -8.50%) and the CF DeFi Composite Index 7.21%. The range narrowed to 7.92 pp from 15.06 pp. DeFi's decline cut its YTD return to +17.19% from +26.29% and handed the YTD lead to Digital Culture, now at +20.95% and 3.76 pp ahead, a week after DeFi led by 6.19 pp. Digital Culture's gain did not rest on breadth, since 13 of the 16 CF DACS Culture constituents with weekly returns fell. DeFi's decline coincided with the week's leverage unwind and was heaviest among trading names, detailed below, while the smart contract platforms fell with ETH and SOL.
Sector Analysis
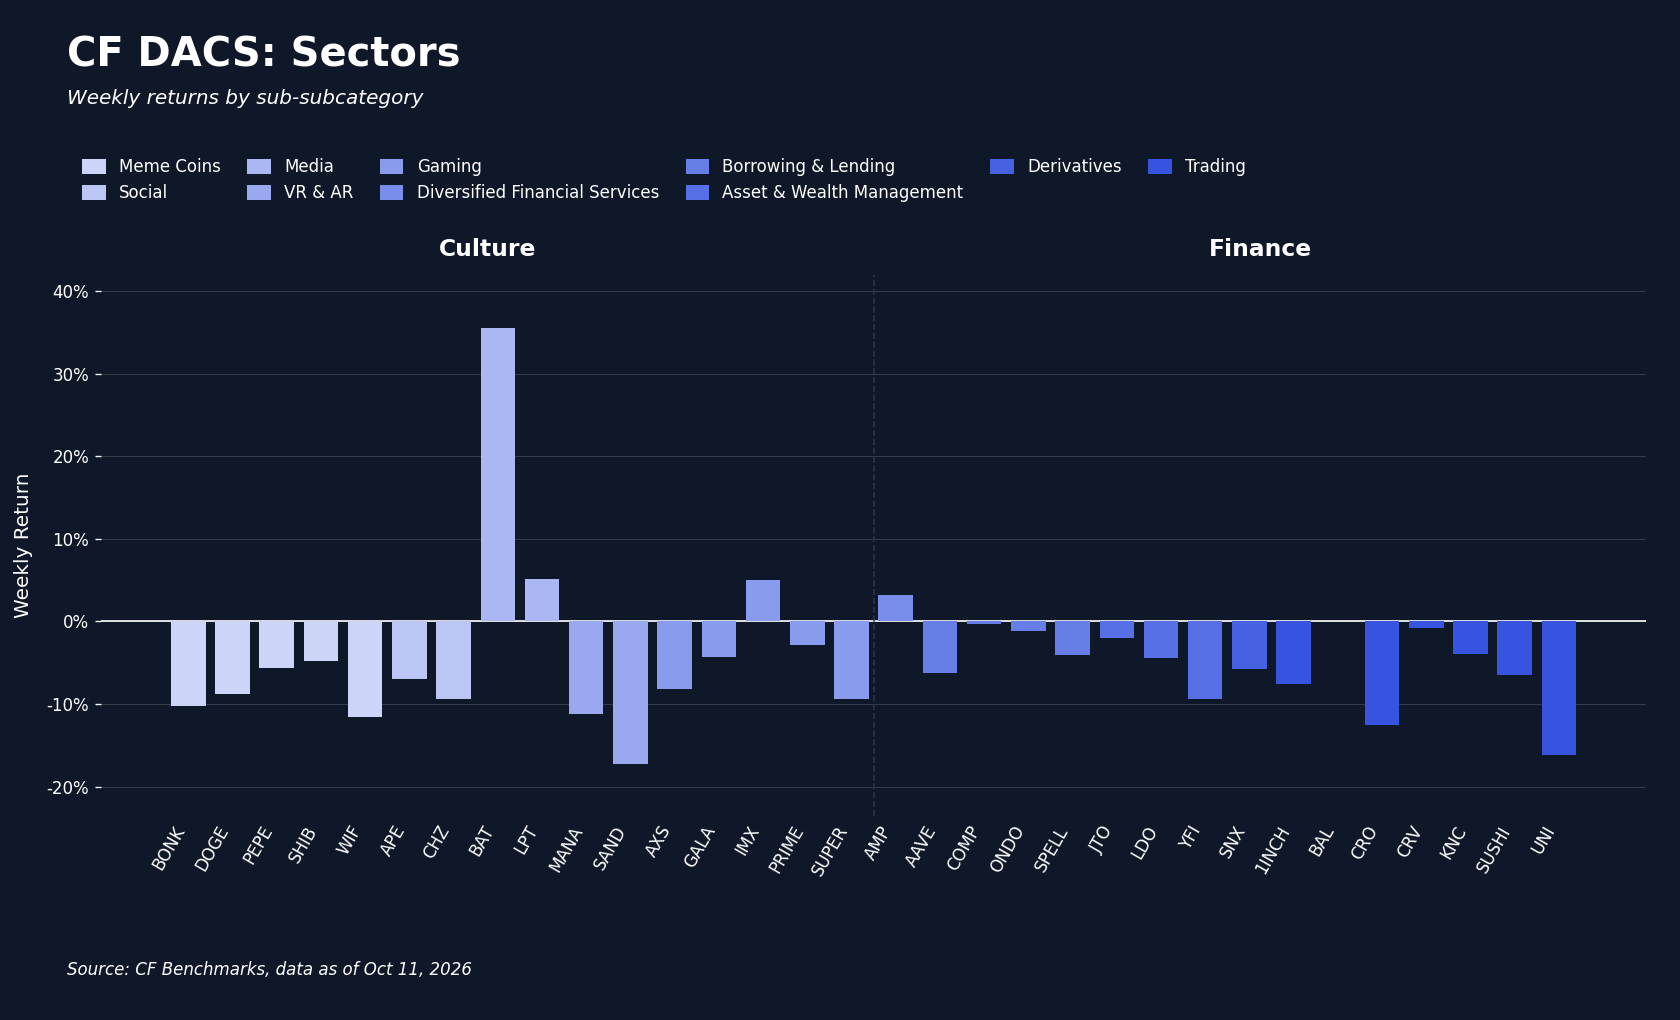
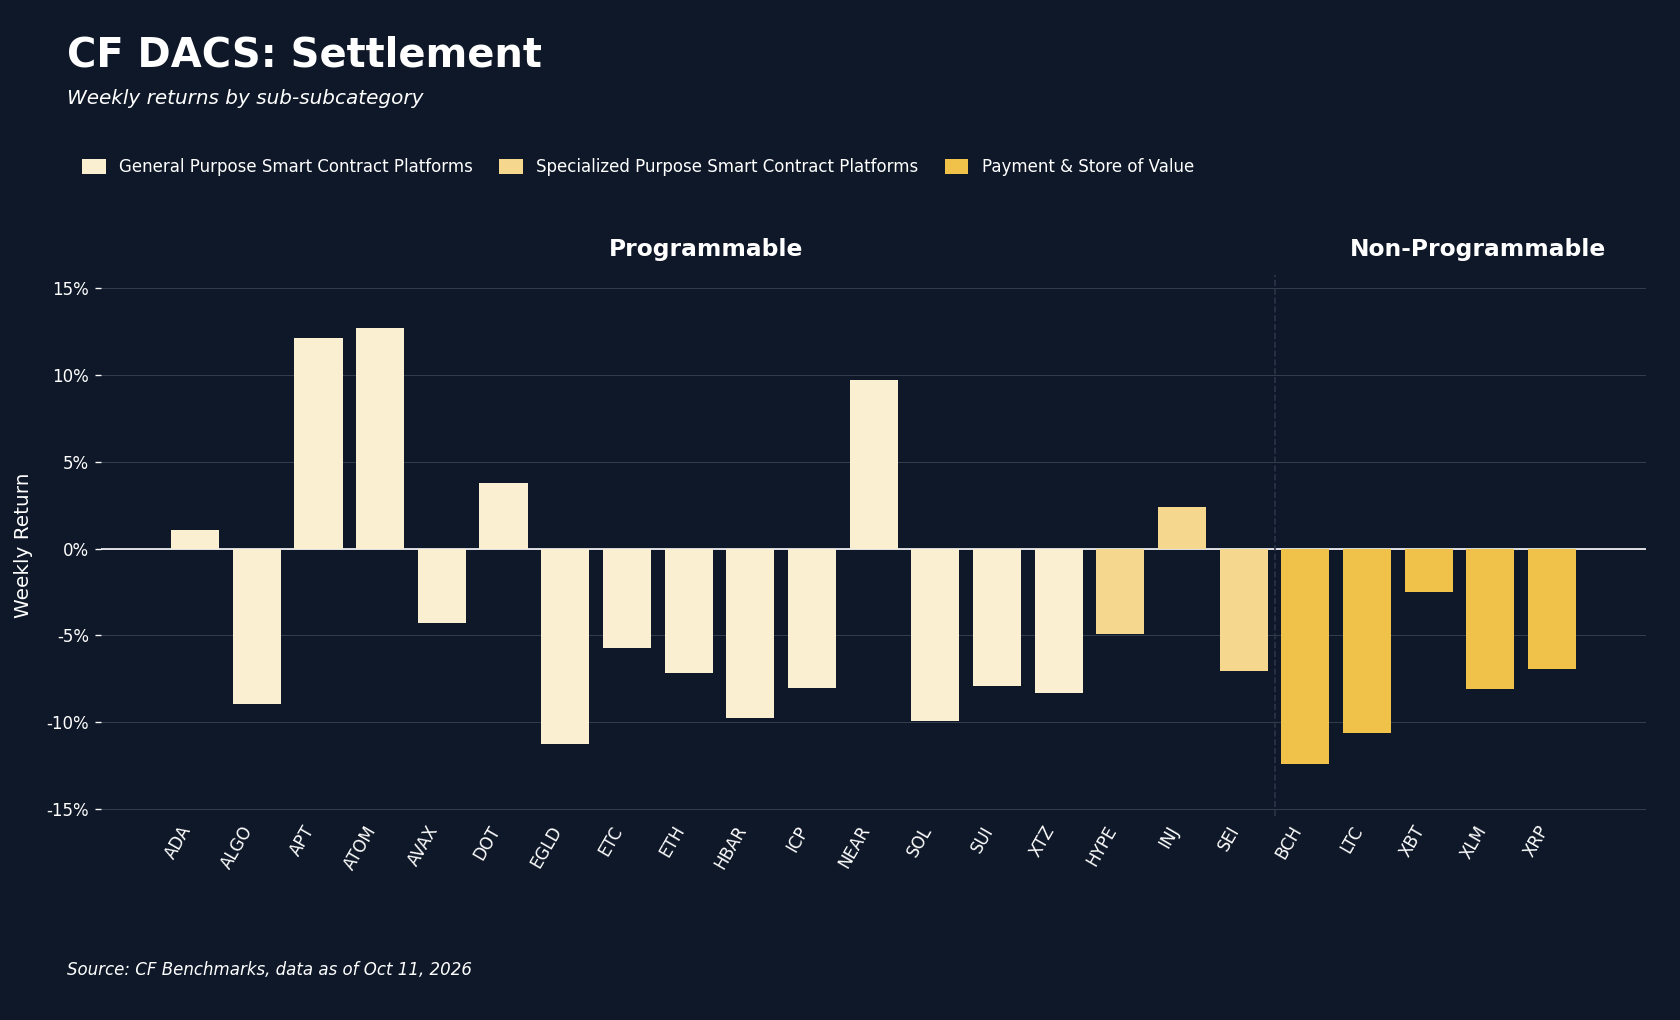
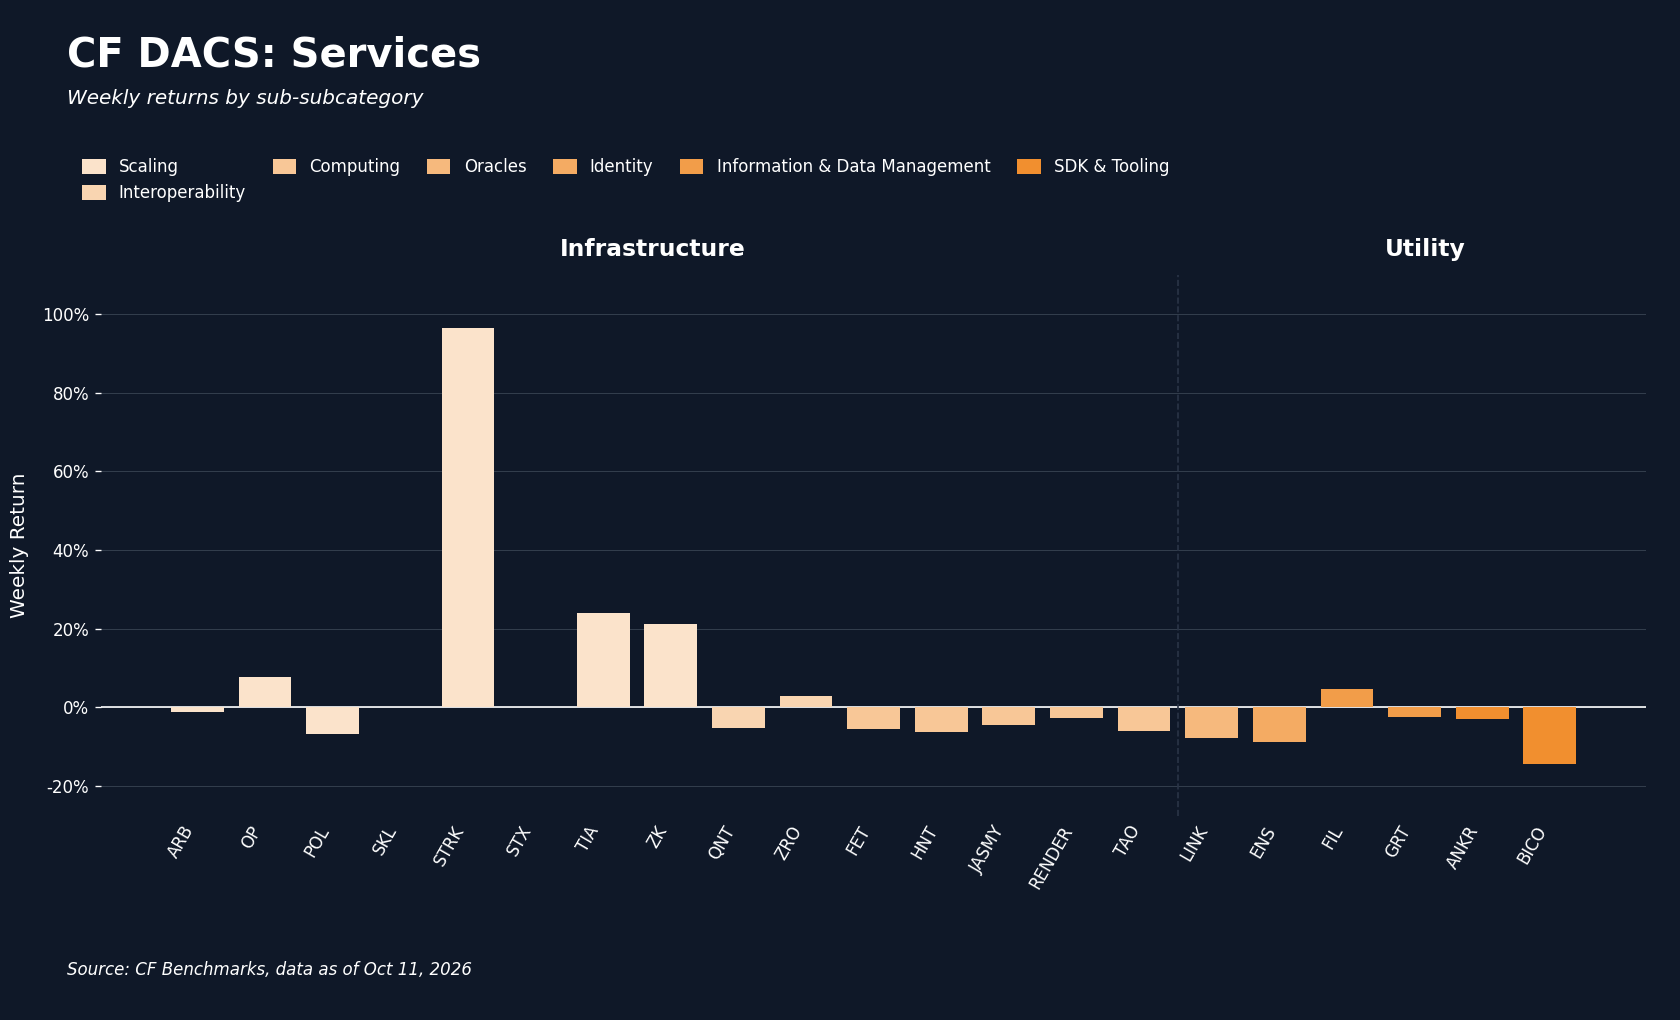
Infrastructure was the only CF DACS sub-category to finish higher, averaging 7.64%, while Programmable averaged -2.86%, Culture -4.05%, Finance -4.86%, Utility -5.27% and Non-Programmable -8.12%, a 15.75 pp gap from first to last. STRK rose 96.54%, the largest gain among DACS constituents, after StarkWare's chief executive floated, and Starknet then said it was actively considering, a move from Ethereum layer-2 to a standalone layer-1 network with a goal of full quantum resistance by 2027; there is no formal proposal or vote. A layer-1 would let Starknet run its own security upgrades rather than settle to Ethereum, and the rally extended on October 11th, before the fix, after a further post on quantum risk. Excluding STRK lowers the Infrastructure average to 1.29%, still first. Other scaling names also rose, with Celestia (TIA) up 24.11% and ZKsync (ZK) 21.33%, although no token-specific catalyst was found and we treat them as co-movement; without STRK, TIA and ZK, Infrastructure would have averaged -2.29%. Basic Attention Token (BAT) rose 35.55% in Culture with no confirmed catalyst, while The Sandbox (SAND) gave back 17.22% a week after its 77.13% gain, the weakest constituent. Finance trading names took the deleveraging hardest, with Uniswap (UNI) down 16.15% and Cronos (CRO) 12.50%, and Non-Programmable fell furthest as Bitcoin Cash (BCH) lost 12.39% and Litecoin (LTC) 10.65%. Of 76 constituents with valid weekly returns, 17 rose, 57 fell and two were unchanged, and STRK and SAND defined a 113.75 pp spread. Outside a handful of scaling tokens, the selling reached almost every part of the DACS universe.
CF Staking Series
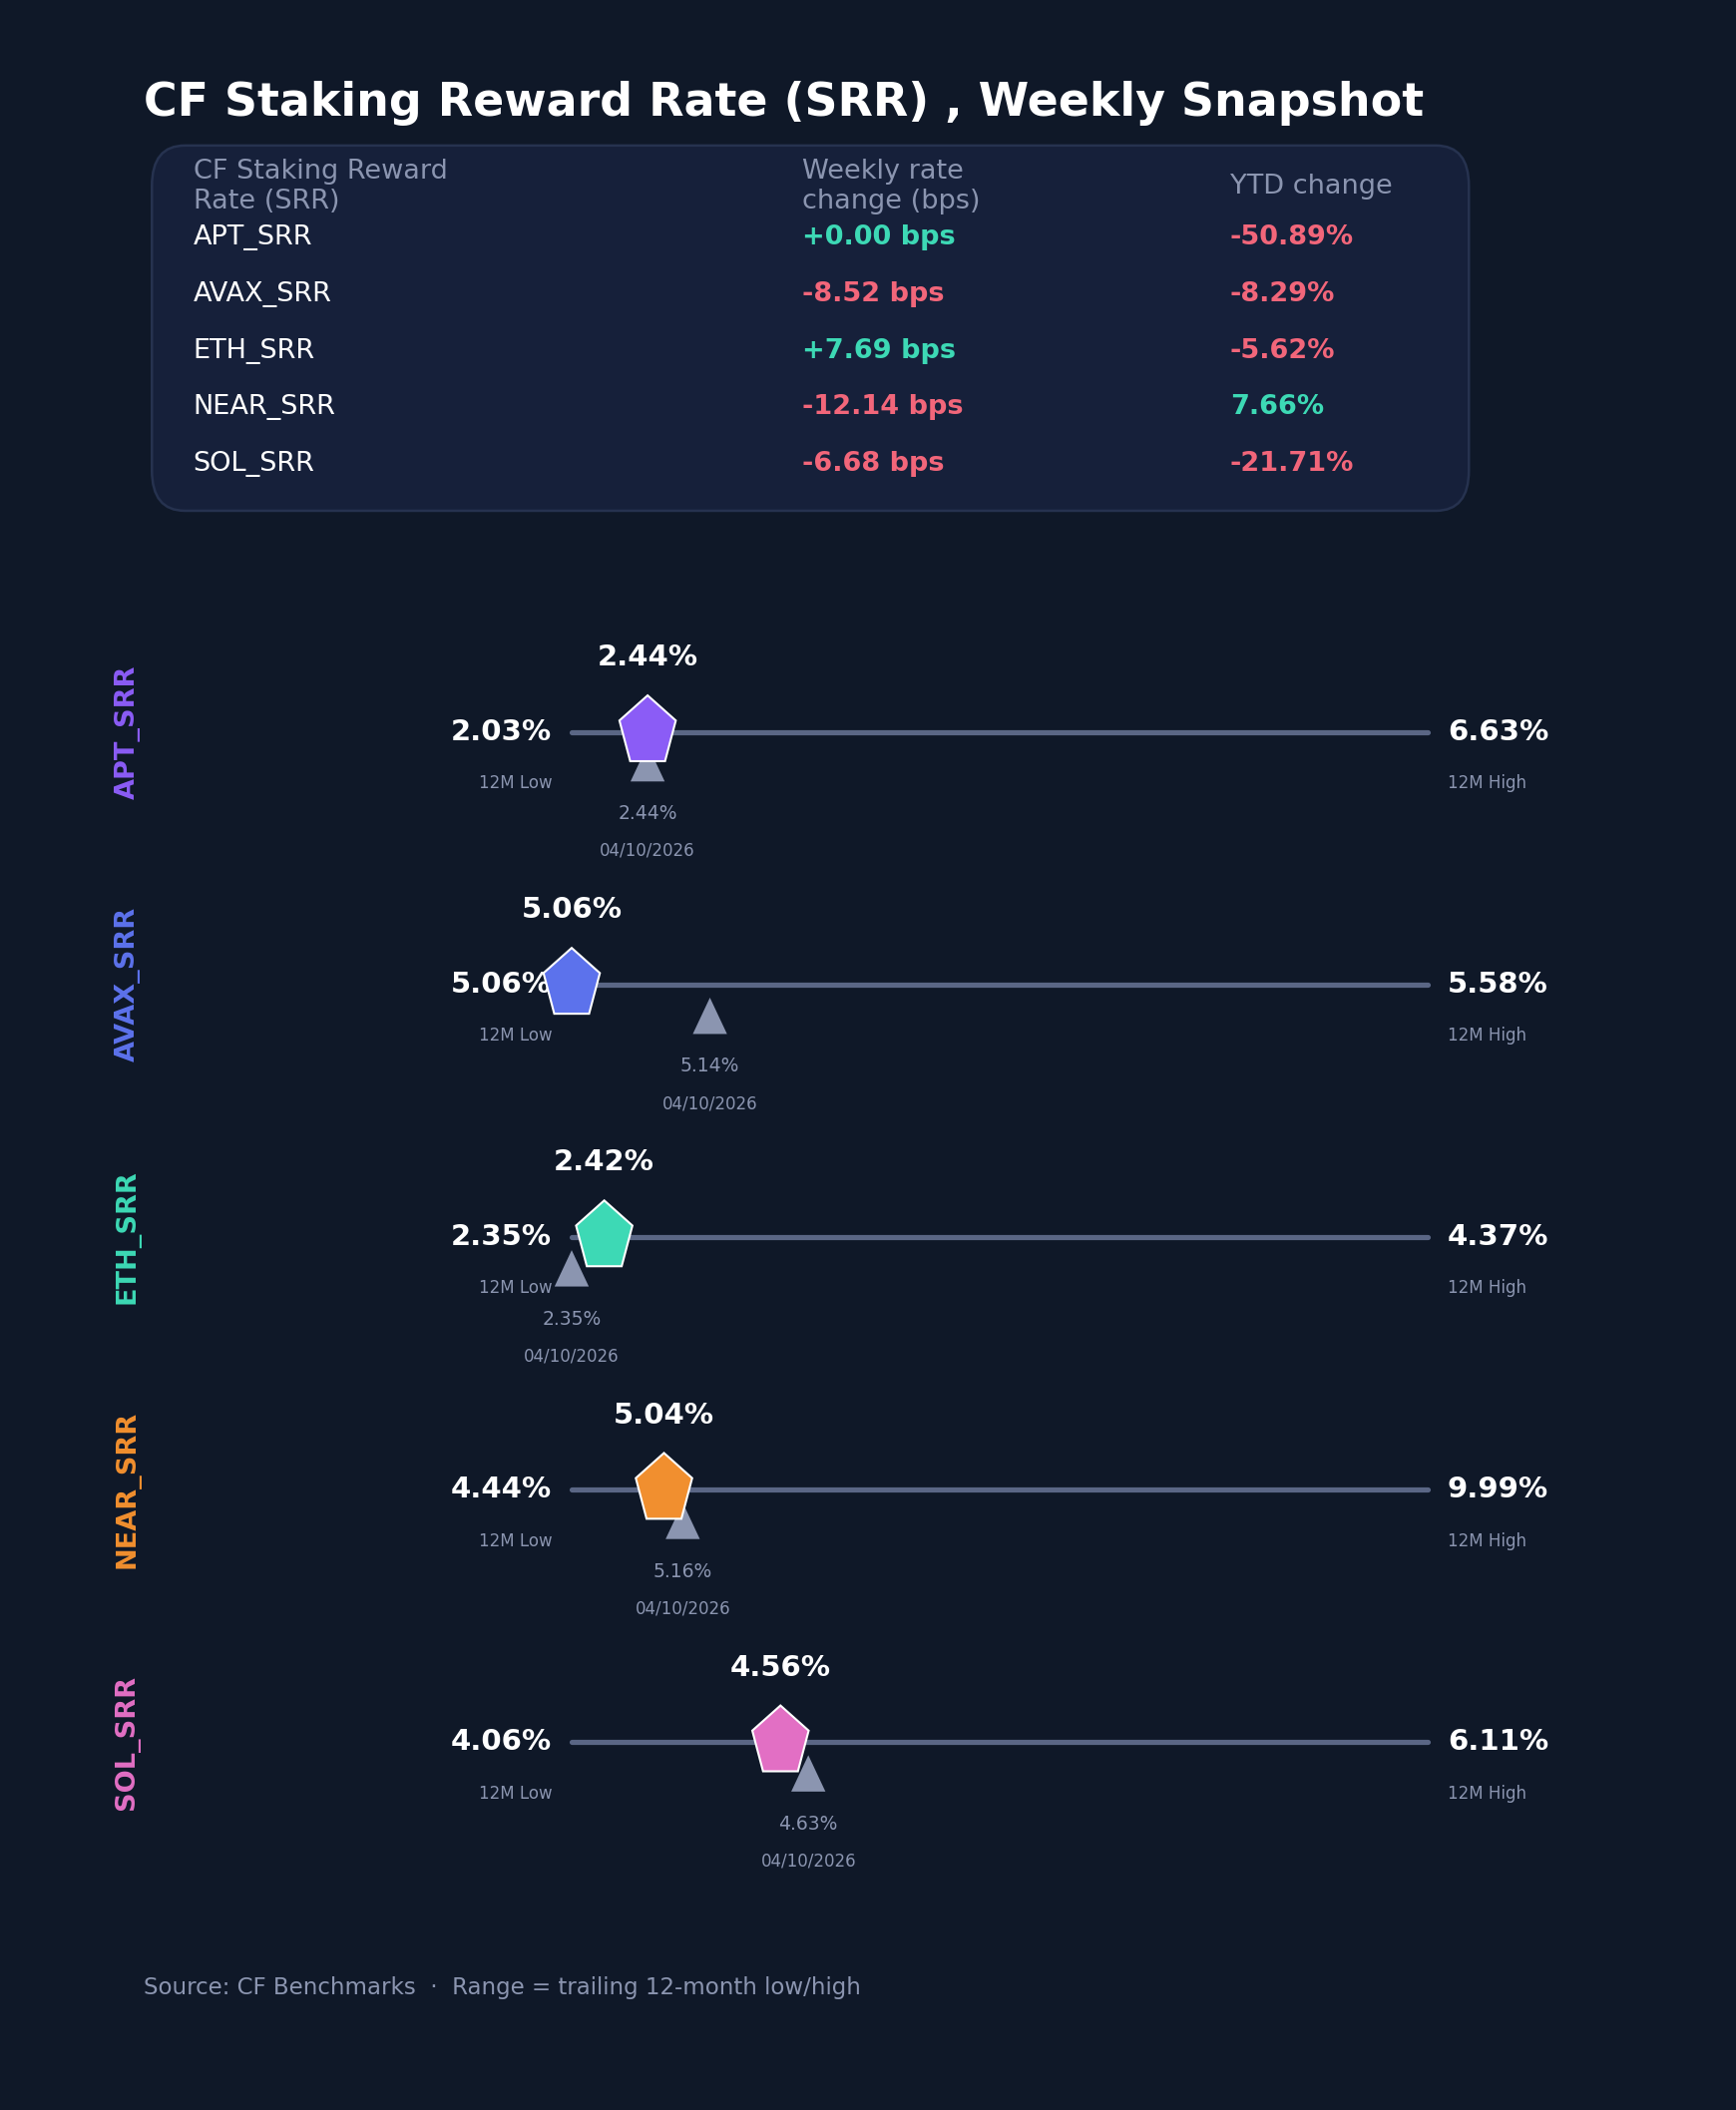
Reward rates moved in both directions across the CF Staking Series, with ETH the only rate to rise. ETH's rate index gained 3.28% w/w as its reward rate rose 7.7 basis points (bps) to 2.4241% from 2.3472%, lifting it off the trailing 12-month low it set a week earlier. Near Protocol (NEAR) posted the largest decline, -2.35%, as its rate fell 12.1 bps to 5.0405% from 5.1619%, giving back about a third of the 37.3 bps it added over the prior three weeks. AVAX fell 1.66%, its rate down 8.5 bps to 5.0554%, a 12-month low for a second week, and SOL fell 1.44%, its rate down 6.7 bps to 4.5603%. Aptos (APT) was unchanged at 2.4375%. AVAX moved back to the top of the set, 1.5 bps above NEAR a week after trailing it by 2.1 bps, and ETH stayed at the bottom of the set, though its rise narrowed the gap to APT to 1.3 bps. Reward-rate changes spanned -12.1 bps to +7.7 bps, and current rates spanned 2.63 pp. These are relative changes in the rate series, not staking income earned. The moves were small and mixed against ETH's spot decline, consistent with protocol issuance and participation rather than the spot drawdown setting staking yields.
Interest Rate Analysis
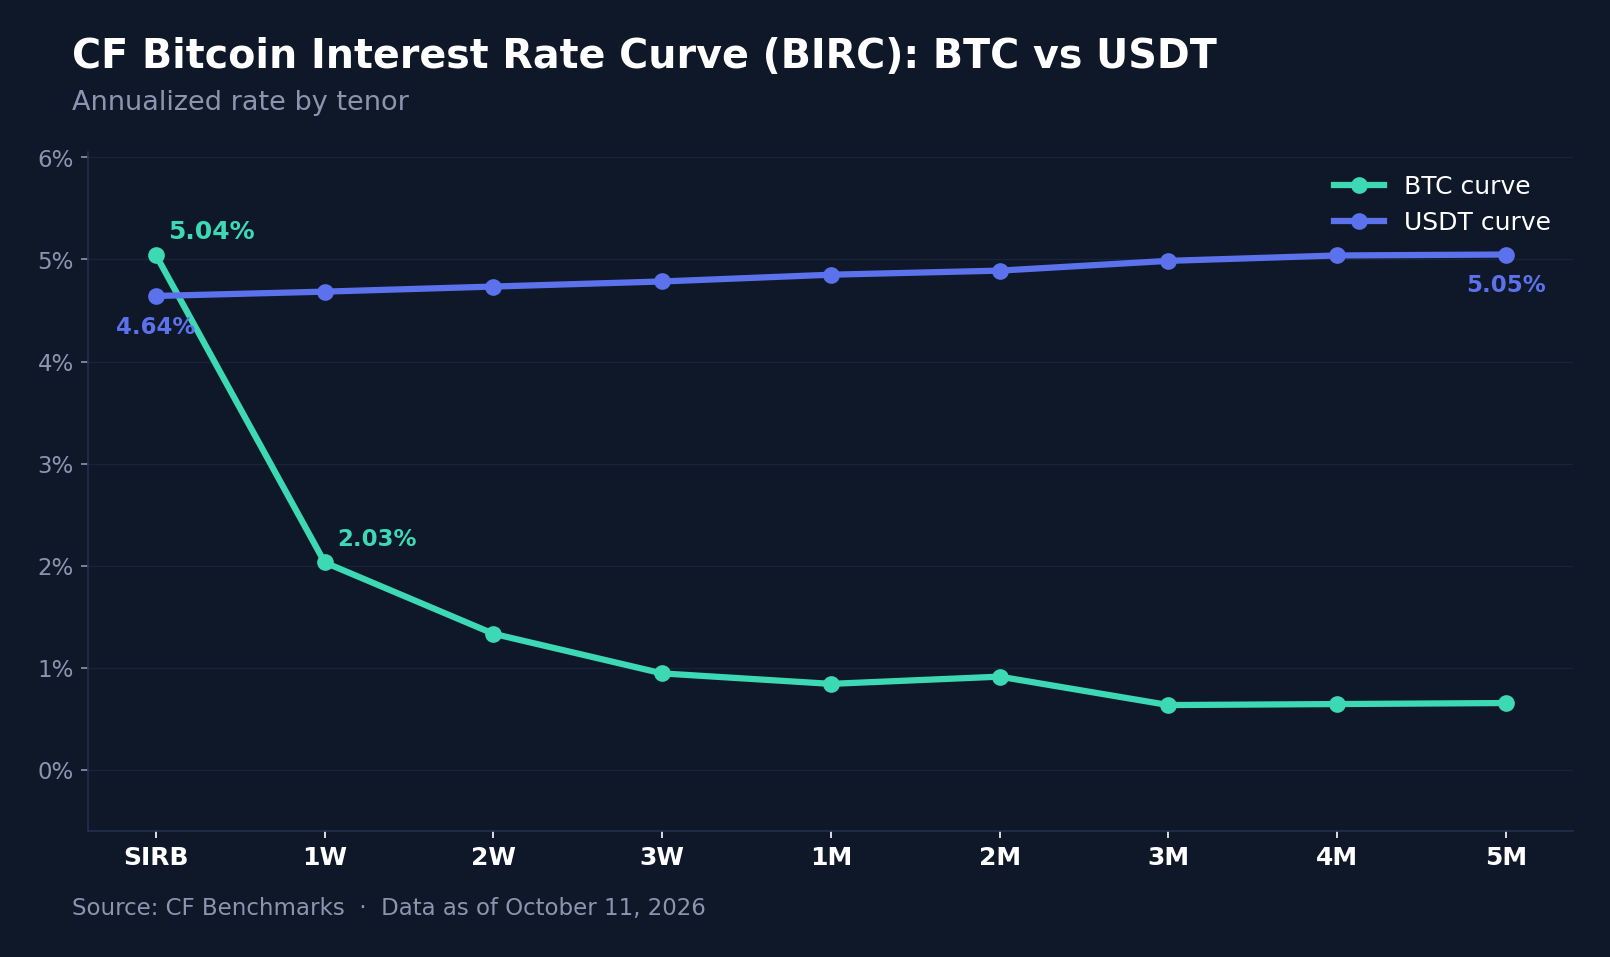
Tether (USDT) funding costs rose at every tenor of the CF Bitcoin Interest Rate Curve (BIRC) on the weekly-average basis, while the BTC curve's front end was dominated by unstable daily prints. USDT rose between 59.6 and 67.2 bps across tenors, taking the Short-term Interest Rate Benchmark (SIRB) to 4.6423% from 4.0231%, 1-month (1M) to 4.8509% and 5-month (5M) to 5.0487%, and preserving the upward slope. The increase was concentrated early in the week: USDT SIRB printed 7.77% on Tuesday, the day of the leverage flush, and 5.94% on Wednesday, before falling to 2.94% on Thursday and ending Sunday at 3.96%, close to the prior week's average. On the BTC curve, SIRB's weekly average rose 238.2 bps to 5.0427% from 2.6605% and 1-week (1W) 27.1 bps to 2.0305%, but SIRB's daily prints ranged from 0.02% to 11.32% and 1W and 2-week (2W) printed zero from October 7th to 11th, so neither average describes a stable funding level. Beyond the front, BTC was little changed: 2W fell 5.0 bps to 1.3312%, 3-week (3W) 6.1 bps to 0.9428%, 1M 1.0 bps to 0.8402% and 2-month (2M) 7.2 bps to 0.9111%, while 3-month (3M) rose 12.1 bps to 0.6324% and 5M 5.8 bps to 0.6523%. On these averages BTC SIRB sat 40.0 bps above USDT's, against 136.3 bps below a week earlier, a reading we attribute to the unstable prints rather than a change in relative funding. Across both curves, tenor changes ranged from -7.2 bps to +238.2 bps. The spike in dollar stablecoin funding coincided with the Tuesday and Wednesday deleveraging, and its reversal left Sunday's USDT levels close to where the prior week averaged.
Closing Synthesis
We read the week as a healthy retracement rather than a break in trend. BTC pulled back to test its 50-day average and held above it at every daily fix, giving back about 29% of the 12.44% it gained over the three weeks to October 4th and finishing 16.06% above its 200-day average. The broader market followed BTC lower, and the losses scaled with distance from it: the free-float indices fell less than their diversified counterparts, Emerging Crypto fell most, and DeFi ceded its YTD lead to Digital Culture. Fund redemptions and long liquidations accompanied the decline, and the factors compressed as market direction set returns. Macro supplied a hawkish backdrop, with Fed minutes and a 10-year yield at 24-year highs, but no consistent link to the move, as equities rose through it. BVXS rose only modestly while the surface repriced toward downside protection, dollar stablecoin funding spiked during the flush before settling by Sunday, and Starknet's layer-1 consideration was the week's one material idiosyncratic catalyst.
The information contained within is for educational and informational purposes ONLY. It is not intended nor should it be considered an invitation or inducement to buy or sell any of the underlying instruments cited including but not limited to cryptoassets, financial instruments or any instruments that reference any index provided by CF Benchmarks Ltd. This communication is not intended to persuade or incite you to buy or sell security or securities noted within. Any commentary provided is the opinion of the author and should not be considered a personalised recommendation. Please contact your financial adviser or professional before making an investment decision.
Note: Some of the underlying instruments cited within this material may be restricted to certain customer categories in certain jurisdictions.
Notice of the Demising of Certain CF Spot Rates
The Administrator announces that it will demise the CF Storj-Dollar Spot Rate (STORJUSD_RTI) and CF Badger DAO-Dollar Spot Rate (BADGERUSD_RTI) which are members of the CF Digital Asset Index Family

CF Benchmarks
Bitcoin Tests Its 50-Day Moving Average
Digital assets gave back some recent gains over the past week as Bitcoin retraced to test a key moving average and the broader market followed it lower. Diversified and smaller-cap exposures fell hardest, factor spreads compressed, downside protection richened and a scaling-token rally stood apart.
Mark Pilipczuk
Coinbase to be added as CF Constituent Exchange for CF PAX Gold-Dollar Indices
The Administrator announces that Coinbase will be added as a CF Constituent Exchange for CF PAX Gold-Dollar Indices from October 19th, 2026.
CF Benchmarks
By clicking Accept, you consent to CF Benchmarks's use of cookies.
Visit Cookie Settings to learn how CF Benchmarks uses cookies and to adjust your preferences.